Races in Ira, Vermont (VT) Detailed Stats
Ancestries, Foreign-born residents, place of birth

Recent posts about races in Ira, Vermont on our local forum with over 2,400,000 registered users:
 | What the HELL is up with Vermont's insane property taxes???? (59 replies) |
| Retire to Vermont (39 replies) |
| Retirement-dreams question: How do Upstate NY, Vermont, &NH compare re: tax burden & cost of living? (10 replies) |
| Embezzlement Cases – This is crazy !!!! (28 replies) |
| Rutland and surrounding areas? (44 replies) |
0.4% of Ira, VT residents are foreign-born , which is 810.0% less than the foreign-born rate of 4.0% across the entire state of Vermont.
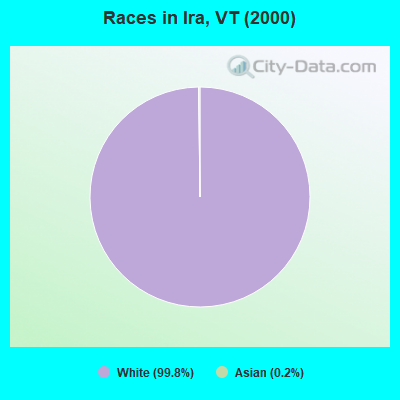
Race distribution in Ira

- 45499.8%White alone
- 10.2%Asian alone
2000
2022
-
- 585,43196.2%White alone
- 6,8091.1%Two or more races
- 5,5040.9%Hispanic
- 5,1600.8%Asian alone
- 2,9210.5%Black alone
- 2,3250.4%American Indian alone
- 5570.09%Other race alone
- 1200.02%Native Hawaiian and Other
Pacific Islander alone

-
- 583,54690.2%White alone
- 27,3404.2%Two or more races
- 14,7702.3%Hispanic
- 11,5121.8%Asian alone
- 6,2641.0%Black alone
- 2,5210.4%Other race alone
- 1,0520.2%American Indian alone
- 590.01%Native Hawaiian and Other
Pacific Islander alone

Income and house value in Ira
- Median household income in 2022
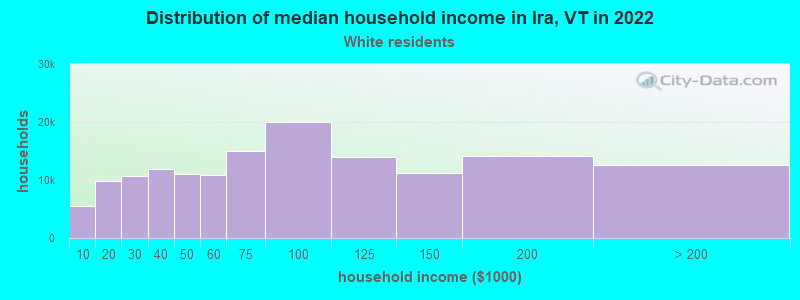
- $83,898White non-Hispanic householders
- Median 2022 house value
- $214,281White Non-Hispanic householders
Household income for White non-Hispanic householders
Foreign-born residents in Ira
2 residents are foreign born
| This city: | 0.4% |
| Vermont: | 3.8% |
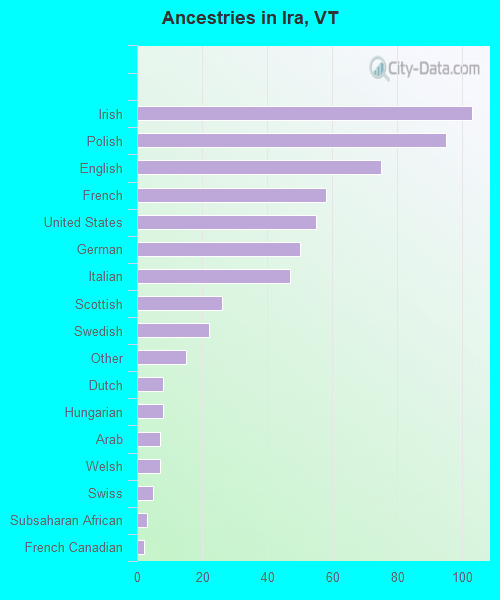
Ancestries in Ira

- 10317.6%Irish
- 9516.2%Polish
- 7512.8%English
- 589.9%French
- 559.4%United States
- 508.5%German
- 478.0%Italian
- 264.4%Scottish
- 223.8%Swedish
- 152.6%Other
- 81.4%Dutch
- 81.4%Hungarian
- 71.2%Arab
- 71.2%Welsh
- 50.9%Swiss
- 30.5%Subsaharan African
- 20.3%French Canadian
Zip codes: 05777.