Races in Java, New York (NY) Detailed Stats
Ancestries, Foreign-born residents, place of birth
1.5% of Java, NY residents are foreign-born , which is 1337.8% less than the foreign-born rate of 22.0% across the entire state of New York.
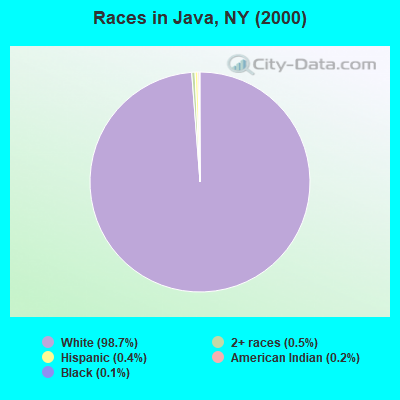
Race distribution in Java

- 2,19498.7%White alone
- 100.5%Two or more races
- 90.4%Hispanic
- 40.2%American Indian alone
- 30.1%Black alone
- 20.09%Asian alone
2000
2022
-
- 11,760,98162.0%White alone
- 2,867,58315.1%Hispanic
- 2,812,62314.8%Black alone
- 1,035,9265.5%Asian alone
- 366,1161.9%Two or more races
- 75,4990.4%Other race alone
- 52,4990.3%American Indian alone
- 5,2300.03%Native Hawaiian and Other
Pacific Islander alone

-
- 10,408,93352.9%White alone
- 3,867,29919.7%Hispanic
- 2,633,84013.4%Black alone
- 1,776,2869.0%Asian alone
- 732,6703.7%Two or more races
- 216,1101.1%Other race alone
- 35,0820.2%American Indian alone
- 6,9310.04%Native Hawaiian and Other
Pacific Islander alone

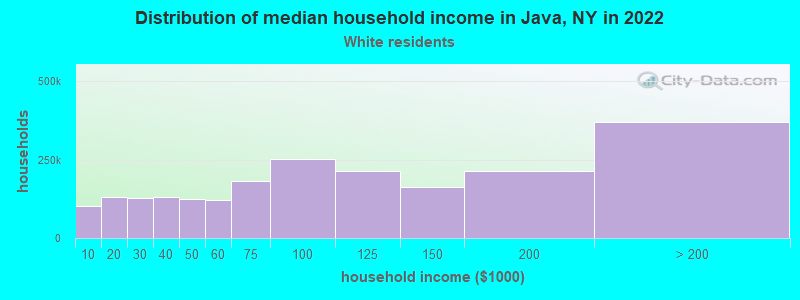
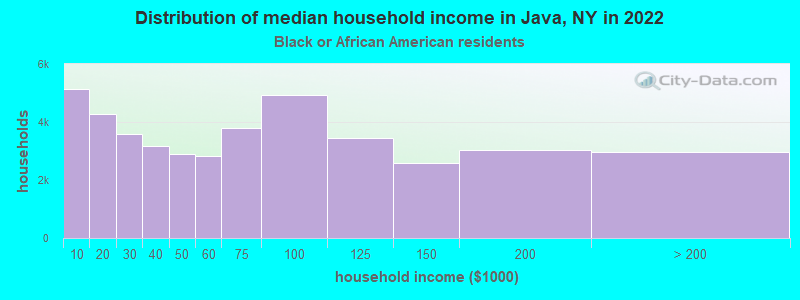
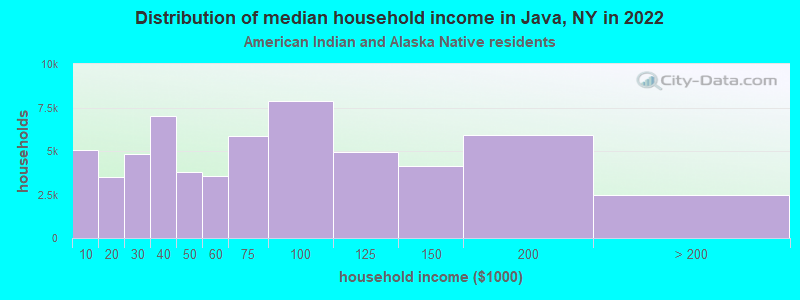
Income and house value in Java
- Median household income in 2022
- $77,987White non-Hispanic householders
- $5,404Black householders
- $139,600American Indian and Alaska Native householders
- Median 2022 house value
- $159,758White Non-Hispanic householders
- $64,338Black or African American householders
- $168,271American Indian or Alaska Native householders
Household income for White non-Hispanic householders
Household income for Black householders
Household income for American Indian and Alaska Native householders
Foreign-born residents in Java
34 residents are foreign born
| This city: | 1.5% |
| New York: | 20.4% |
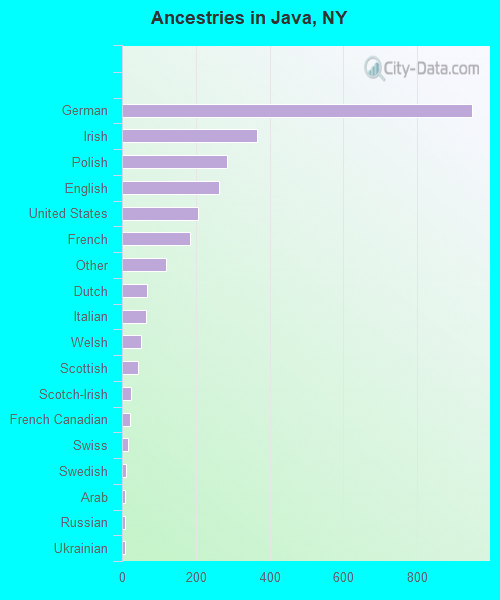
Ancestries in Java

- 94734.8%German
- 36513.4%Irish
- 28410.4%Polish
- 2649.7%English
- 2057.5%United States
- 1856.8%French
- 1194.4%Other
- 692.5%Dutch
- 662.4%Italian
- 521.9%Welsh
- 441.6%Scottish
- 250.9%Scotch-Irish
- 230.8%French Canadian
- 160.6%Swiss
- 100.4%Swedish
- 90.3%Arab
- 90.3%Russian
- 90.3%Ukrainian
- 70.3%Czech
- 70.3%Hungarian
- 50.2%Norwegian
- 20.07%Slovak
Zip codes: 14082.