Races in Jeffersontown, Kentucky (KY) Detailed Stats
Data:
Races - White alone (%)
Races - White alone (% change since 2000)
Races - Black alone (%)
Races - Black alone (% change since 2000)
Races - American Indian alone (%)
Races - American Indian alone (% change since 2000)
Races - Asian alone (%)
Races - Asian alone (% change since 2000)
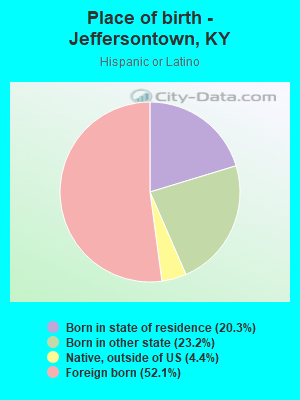
Races - Hispanic (%)
Races - Hispanic (% change since 2000)
Races - Native Hawaiian and Other Pacific Islander alone (%)
Races - Native Hawaiian and Other Pacific Islander alone (% change since 2000)
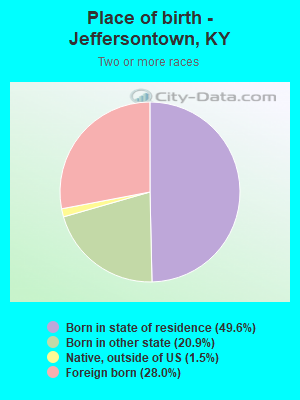
Races - Two or more races(%)
Races - Two or more races(% change since 2000)
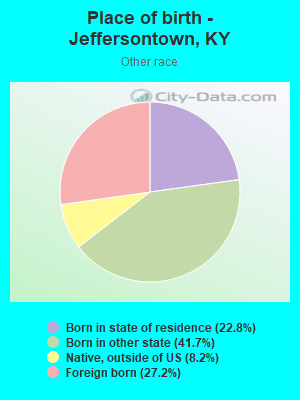
Races - Other race alone (%)
Races - Other race alone (% change since 2000)
Racial diversity
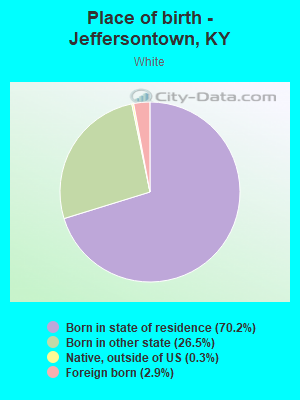
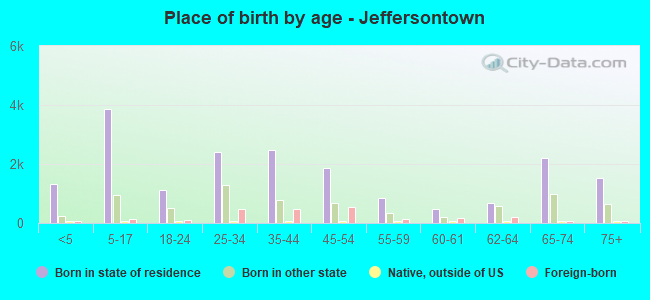
Place of birth - Born in state of residence (%)
Place of birth - Born in state of residence (%) - White
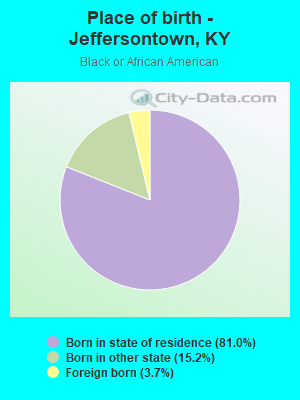
Place of birth - Born in state of residence (%) - Black or African American
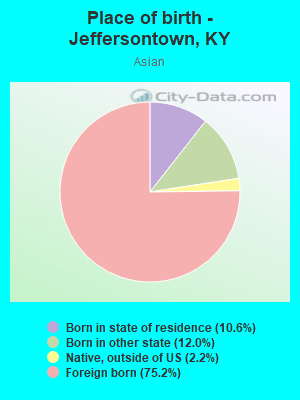
Place of birth - Born in state of residence (%) - Asian
Place of birth - Born in state of residence (%) - Hispanic or Latino
Place of birth - Born in state of residence (%) - American Indian and Alaska Native
Place of birth - Born in state of residence (%) - Multirace
Place of birth - Born in state of residence (%) - Other Race
Place of birth - Born in other state (%)
Place of birth - Born in other state (%) - White
Place of birth - Born in other state (%) - Black or African American
Place of birth - Born in other state (%) - Asian
Place of birth - Born in other state (%) - Hispanic or Latino
Place of birth - Born in other state (%) - American Indian and Alaska Native
Place of birth - Born in other state (%) - Multirace
Place of birth - Born in other state (%) - Other Race
Place of birth - Native, outside of US (%)
Place of birth - Native, outside of US (%) - White
Place of birth - Native, outside of US (%) - Black or African American
Place of birth - Native, outside of US (%) - Asian
Place of birth - Native, outside of US (%) - Hispanic or Latino
Place of birth - Native, outside of US (%) - American Indian and Alaska Native
Place of birth - Native, outside of US (%) - Multirace
Place of birth - Native, outside of US (%) - Other Race
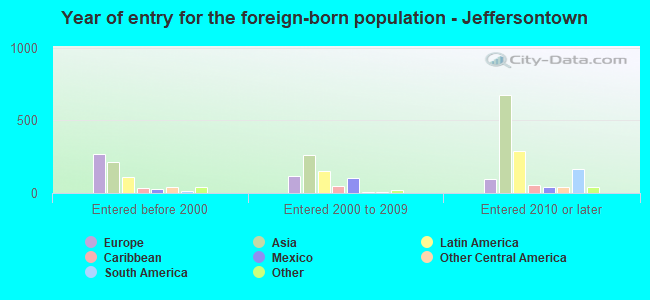
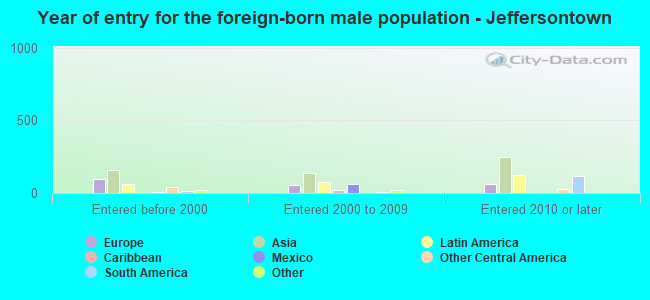
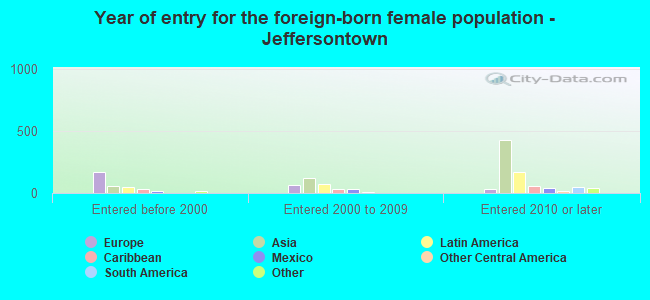
Place of birth - Foreign born (%)
Place of birth - Foreign born (%) - White
Place of birth - Foreign born (%) - Black or African American
Place of birth - Foreign born (%) - Asian
Place of birth - Foreign born (%) - Hispanic or Latino
Place of birth - Foreign born (%) - American Indian and Alaska Native
Place of birth - Foreign born (%) - Multirace
Place of birth - Foreign born (%) - Other Race
Residents speaking English at home (%)
Residents speaking English at home - Born in the United States (%)
Residents speaking English at home - Native, born elsewhere (%)
Residents speaking English at home - Foreign born (%)
Residents speaking Spanish at home (%)
Residents speaking Spanish at home - Born in the United States (%)
Residents speaking Spanish at home - Native, born elsewhere (%)
Residents speaking Spanish at home - Foreign born (%)
Residents speaking other language at home (%)
Residents speaking other language at home - Born in the United States (%)
Residents speaking other language at home - Native, born elsewhere (%)
Residents speaking other language at home - Foreign born (%)
Marital status - Never married (%)
Marital status - Now married (%)
Marital status - Separated (%)
Marital status - Widowed (%)
Marital status - Divorced (%)
Ancestries Reported - Arab (%)
Ancestries Reported - Czech (%)
Ancestries Reported - Danish (%)
Ancestries Reported - Dutch (%)
Ancestries Reported - English (%)
Ancestries Reported - French (%)
Ancestries Reported - French Canadian (%)
Ancestries Reported - German (%)
Ancestries Reported - Greek (%)
Ancestries Reported - Hungarian (%)
Ancestries Reported - Irish (%)
Ancestries Reported - Italian (%)
Ancestries Reported - Lithuanian (%)
Ancestries Reported - Norwegian (%)
Ancestries Reported - Polish (%)
Ancestries Reported - Portuguese (%)
Ancestries Reported - Russian (%)
Ancestries Reported - Scotch-Irish (%)
Ancestries Reported - Scottish (%)
Ancestries Reported - Slovak (%)
Ancestries Reported - Subsaharan African (%)
Ancestries Reported - Swedish (%)
Ancestries Reported - Swiss (%)
Ancestries Reported - Ukrainian (%)
Ancestries Reported - United States (%)
Ancestries Reported - Welsh (%)
Ancestries Reported - West Indian (%)
Ancestries Reported - Other (%)
Geographical mobility - Same house 1 year ago (%)
Geographical mobility - Same house 1 year ago (%) - White
Geographical mobility - Same house 1 year ago (%) - Black or African American
Geographical mobility - Same house 1 year ago (%) - Asian
Geographical mobility - Same house 1 year ago (%) - Hispanic or Latino
Geographical mobility - Same house 1 year ago (%) - American Indian and Alaska Native
Geographical mobility - Same house 1 year ago (%) - Multirace
Geographical mobility - Same house 1 year ago (%) - Other Race
Geographical mobility - Moved within same county (%)
Geographical mobility - Moved within same county (%) - White
Geographical mobility - Moved within same county (%) - Black or African American
Geographical mobility - Moved within same county (%) - Asian
Geographical mobility - Moved within same county (%) - Hispanic or Latino
Geographical mobility - Moved within same county (%) - American Indian and Alaska Native
Geographical mobility - Moved within same county (%) - Multirace
Geographical mobility - Moved within same county (%) - Other Race
Geographical mobility - Moved from different county within same state (%)
Geographical mobility - Moved from different county within same state (%) - White
Geographical mobility - Moved from different county within same state (%) - Black or African American
Geographical mobility - Moved from different county within same state (%) - Asian
Geographical mobility - Moved from different county within same state (%) - Hispanic or Latino
Geographical mobility - Moved from different county within same state (%) - American Indian and Alaska Native
Geographical mobility - Moved from different county within same state (%) - Multirace
Geographical mobility - Moved from different county within same state (%) - Other Race
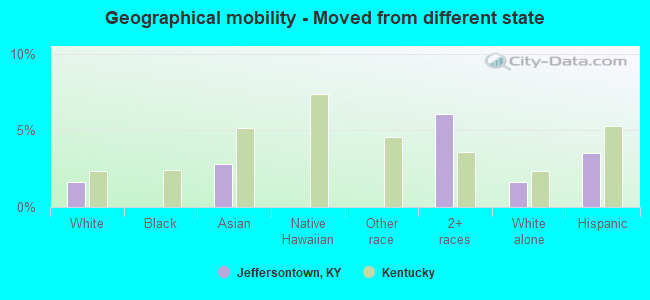
Geographical mobility - Moved from different state (%)
Geographical mobility - Moved from different state (%) - White
Geographical mobility - Moved from different state (%) - Black or African American
Geographical mobility - Moved from different state (%) - Asian
Geographical mobility - Moved from different state (%) - Hispanic or Latino
Geographical mobility - Moved from different state (%) - American Indian and Alaska Native
Geographical mobility - Moved from different state (%) - Multirace
Geographical mobility - Moved from different state (%) - Other Race
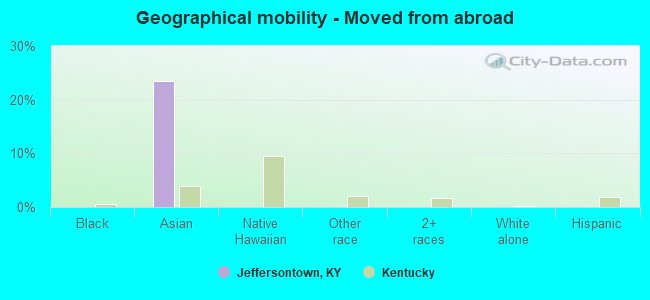
Geographical mobility - Moved from abroad (%)
Geographical mobility - Moved from abroad (%) - White
Geographical mobility - Moved from abroad (%) - Black or African American
Geographical mobility - Moved from abroad (%) - Asian
Geographical mobility - Moved from abroad (%) - Hispanic or Latino
Geographical mobility - Moved from abroad (%) - American Indian and Alaska Native
Geographical mobility - Moved from abroad (%) - Multirace
Geographical mobility - Moved from abroad (%) - Other Race
Place of birth for the foreign-born population - Ireland (%)
Place of birth for the foreign-born population - Denmark (%)
Place of birth for the foreign-born population - Norway (%)
Place of birth for the foreign-born population - Sweden (%)
Place of birth for the foreign-born population - United Kingdom (%)
Place of birth for the foreign-born population - England (%)
Place of birth for the foreign-born population - Scotland (%)
Place of birth for the foreign-born population - Other Northern Europe (%)
Place of birth for the foreign-born population - Austria (%)
Place of birth for the foreign-born population - Belgium (%)
Place of birth for the foreign-born population - France (%)
Place of birth for the foreign-born population - Germany (%)
Place of birth for the foreign-born population - Netherlands (%)
Place of birth for the foreign-born population - Switzerland (%)
Place of birth for the foreign-born population - Other Western Europe (%)
Place of birth for the foreign-born population - Greece (%)
Place of birth for the foreign-born population - Italy (%)
Place of birth for the foreign-born population - Portugal (%)
Place of birth for the foreign-born population - Spain (%)
Place of birth for the foreign-born population - Other Southern Europe (%)
Place of birth for the foreign-born population - Albania (%)
Place of birth for the foreign-born population - Belarus (%)
Place of birth for the foreign-born population - Bosnia and Herzegovina (%)
Place of birth for the foreign-born population - Bulgaria (%)
Place of birth for the foreign-born population - Croatia (%)
Place of birth for the foreign-born population - Czechoslovakia (%)
Place of birth for the foreign-born population - Hungary (%)
Place of birth for the foreign-born population - Latvia (%)
Place of birth for the foreign-born population - Lithuania (%)
Place of birth for the foreign-born population - North Macedonia (Macedonia) (%)
Place of birth for the foreign-born population - Moldova (%)
Place of birth for the foreign-born population - Poland (%)
Place of birth for the foreign-born population - Romania (%)
Place of birth for the foreign-born population - Russia (%)
Place of birth for the foreign-born population - Serbia (%)
Place of birth for the foreign-born population - Ukraine (%)
Place of birth for the foreign-born population - Other Eastern Europe (%)
Place of birth for the foreign-born population - China (%)
Place of birth for the foreign-born population - Hong Kong (%)
Place of birth for the foreign-born population - Taiwan (%)
Place of birth for the foreign-born population - Japan (%)
Place of birth for the foreign-born population - Korea (%)
Place of birth for the foreign-born population - Other Eastern Asia (%)
Place of birth for the foreign-born population - Afghanistan (%)
Place of birth for the foreign-born population - Bangladesh (%)
Place of birth for the foreign-born population - India (%)
Place of birth for the foreign-born population - Iran (%)
Place of birth for the foreign-born population - Kazakhstan (%)
Place of birth for the foreign-born population - Nepal (%)
Place of birth for the foreign-born population - Pakistan (%)
Place of birth for the foreign-born population - Sri Lanka (%)
Place of birth for the foreign-born population - Uzbekistan (%)
Place of birth for the foreign-born population - Other South Central Asia (%)
Place of birth for the foreign-born population - Burma (%)
Place of birth for the foreign-born population - Cambodia (%)
Place of birth for the foreign-born population - Indonesia (%)
Place of birth for the foreign-born population - Laos (%)
Place of birth for the foreign-born population - Malaysia (%)
Place of birth for the foreign-born population - Philippines (%)
Place of birth for the foreign-born population - Singapore (%)
Place of birth for the foreign-born population - Thailand (%)
Place of birth for the foreign-born population - Vietnam (%)
Place of birth for the foreign-born population - Other South Eastern Asia (%)
Place of birth for the foreign-born population - Armenia (%)
Place of birth for the foreign-born population - Iraq (%)
Place of birth for the foreign-born population - Israel (%)
Place of birth for the foreign-born population - Jordan (%)
Place of birth for the foreign-born population - Kuwait (%)
Place of birth for the foreign-born population - Lebanon (%)
Place of birth for the foreign-born population - Saudi Arabia (%)
Place of birth for the foreign-born population - Syria (%)
Place of birth for the foreign-born population - Turkey (%)
Place of birth for the foreign-born population - Yemen (%)
Place of birth for the foreign-born population - Other Western Asia (%)
Place of birth for the foreign-born population - Eritrea (%)
Place of birth for the foreign-born population - Ethiopia (%)
Place of birth for the foreign-born population - Kenya (%)
Place of birth for the foreign-born population - Somalia (%)
Place of birth for the foreign-born population - Uganda (%)
Place of birth for the foreign-born population - Zimbabwe (%)
Place of birth for the foreign-born population - Other Eastern Africa (%)
Place of birth for the foreign-born population - Cameroon (%)
Place of birth for the foreign-born population - Congo (%)
Place of birth for the foreign-born population - Democratic Republic of Congo (Zaire) (%)
Place of birth for the foreign-born population - Other Middle Africa (%)
Place of birth for the foreign-born population - Egypt (%)
Place of birth for the foreign-born population - Morocco (%)
Place of birth for the foreign-born population - Sudan (%)
Place of birth for the foreign-born population - Other Northern Africa (%)
Place of birth for the foreign-born population - South Africa (%)
Place of birth for the foreign-born population - Other Southern Africa (%)
Place of birth for the foreign-born population - Cabo Verde (%)
Place of birth for the foreign-born population - Ghana (%)
Place of birth for the foreign-born population - Liberia (%)
Place of birth for the foreign-born population - Nigeria (%)
Place of birth for the foreign-born population - Senegal (%)
Place of birth for the foreign-born population - Sierra Leone (%)
Place of birth for the foreign-born population - Other Western Africa (%)
Place of birth for the foreign-born population - Australia (%)
Place of birth for the foreign-born population - New Zealand (%)
Place of birth for the foreign-born population - Fiji (%)
Place of birth for the foreign-born population - Micronesia (%)
Place of birth for the foreign-born population - Bahamas (%)
Place of birth for the foreign-born population - Barbados (%)
Place of birth for the foreign-born population - Cuba (%)
Place of birth for the foreign-born population - Dominica (%)
Place of birth for the foreign-born population - Dominican Republic (%)
Place of birth for the foreign-born population - Grenada (%)
Place of birth for the foreign-born population - Haiti (%)
Place of birth for the foreign-born population - Jamaica (%)
Place of birth for the foreign-born population - St. Vincent and the Grenadines (%)
Place of birth for the foreign-born population - Trinidad and Tobago (%)
Place of birth for the foreign-born population - West Indies (%)
Place of birth for the foreign-born population - Other Caribbean (%)
Place of birth for the foreign-born population - Belize (%)
Place of birth for the foreign-born population - Costa Rica (%)
Place of birth for the foreign-born population - El Salvador (%)
Place of birth for the foreign-born population - Guatemala (%)
Place of birth for the foreign-born population - Honduras (%)
Place of birth for the foreign-born population - Mexico (%)
Place of birth for the foreign-born population - Nicaragua (%)
Place of birth for the foreign-born population - Panama (%)
Place of birth for the foreign-born population - Other Central America (%)
Place of birth for the foreign-born population - Argentina (%)
Place of birth for the foreign-born population - Bolivia (%)
Place of birth for the foreign-born population - Brazil (%)
Place of birth for the foreign-born population - Chile (%)
Place of birth for the foreign-born population - Colombia (%)
Place of birth for the foreign-born population - Ecuador (%)
Place of birth for the foreign-born population - Guyana (%)
Place of birth for the foreign-born population - Peru (%)
Place of birth for the foreign-born population - Uruguay (%)
Place of birth for the foreign-born population - Venezuela (%)
Place of birth for the foreign-born population - Other South America (%)
Place of birth for the foreign-born population - Canada (%)
Place of birth for the foreign-born population - Other Northern America (%)
Place of birth for the foreign-born population - Other (%)
Latest news about races in Jeffersontown, KY collected exclusively by city-data.com from local newspapers, TV, and radio stations
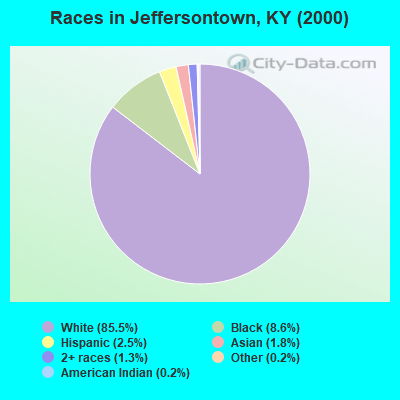
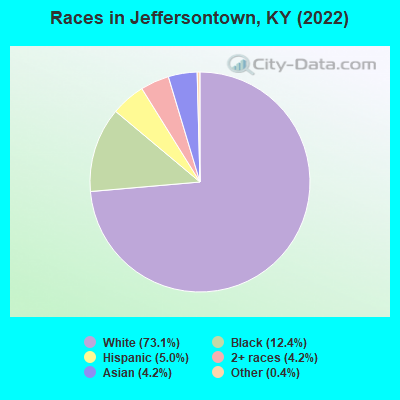
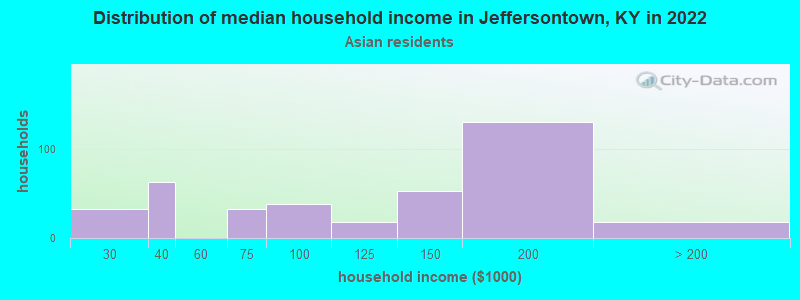
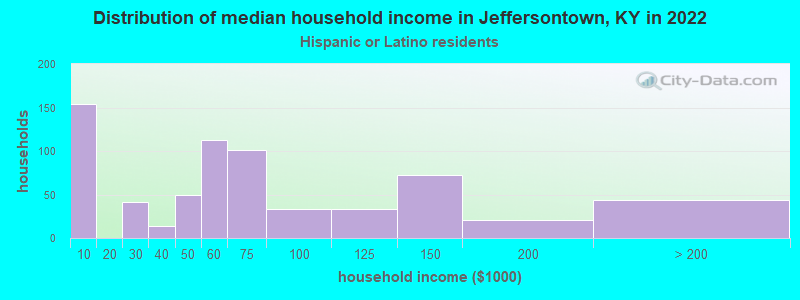
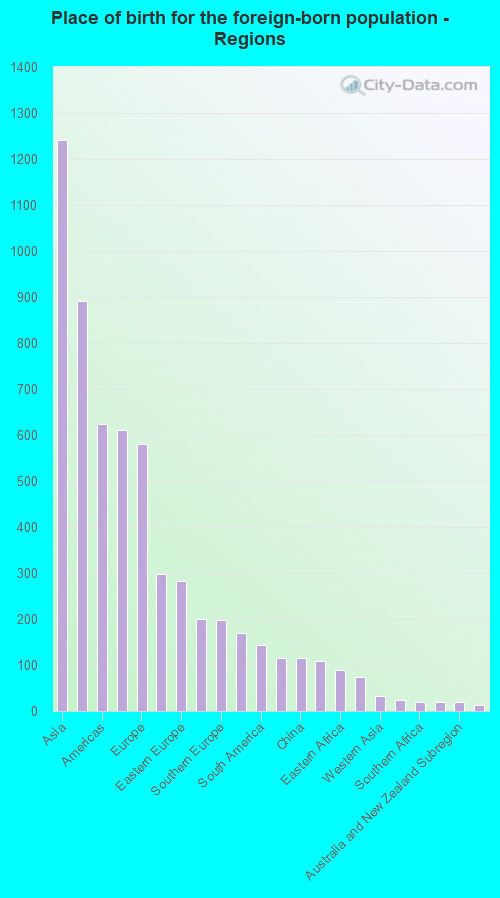
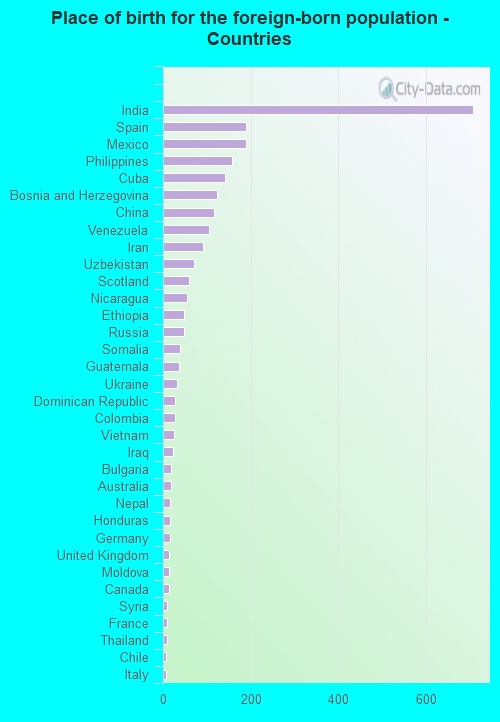
According to 2022 data, the most numerous races in Jeffersontown, KY are White alone (20,888 residents), Black alone (3,542 residents), and Hispanic (1,429 residents). 89.9% of Jeffersontown residents speak English at home. 9.0% of Jeffersontown, KY residents are foreign-born (4.2% born in Asia, 2.1% born in Latin America, 2.0% born in Europe), which is 55.6% greater than the foreign-born rate of 4.0% across the entire state of Kentucky.
Race distribution in Jeffersontown
2000 2022
3,608,013 89.3% White alone 293,639 7.3% Black alone 59,939 1.5% Hispanic 37,750 0.9% Two or more races 29,368 0.7% Asian alone 7,939 0.2% American Indian alone 3,846 0.10% Other race alone 1,275 0.03% Native Hawaiian and Other
3,710,998 82.2% White alone 343,194 7.6% Black alone 187,483 4.2% Hispanic 187,394 4.2% Two or more races 62,240 1.4% Asian alone 13,529 0.3% Other race alone 4,302 0.10% American Indian alone 3,170 0.07% Native Hawaiian and Other
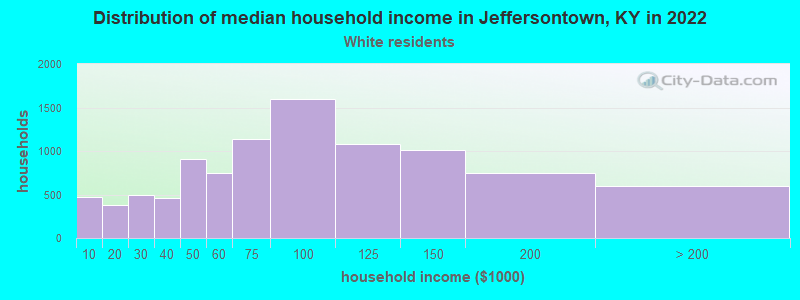
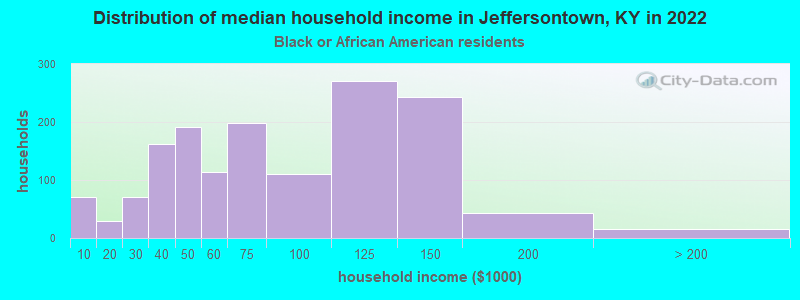
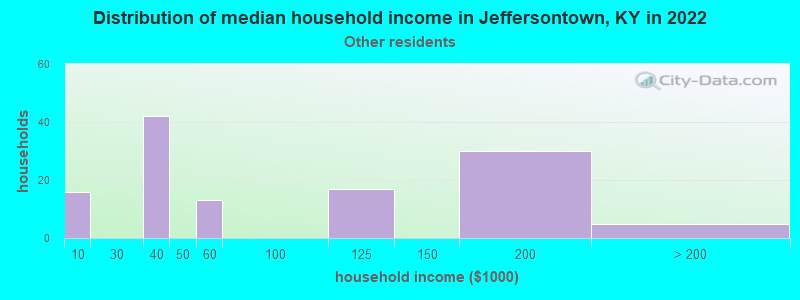
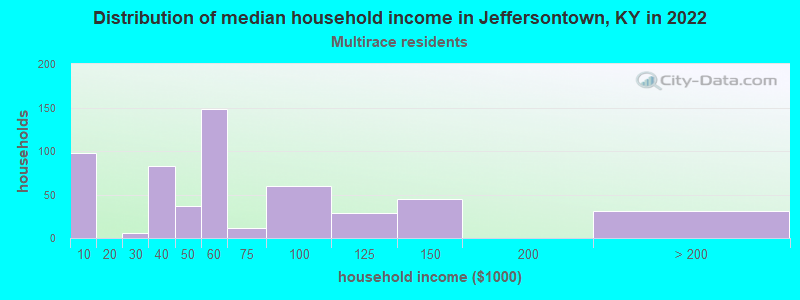
Income and house value in Jeffersontown Median household income in 2022 $79,426 White non-Hispanic householders$67,907 Black householders$110,794 Asian householders$63,981 Two or more races householders$67,498 Hispanic or Latino race householdersMedian 2022 house value $246,507 White Non-Hispanic householders$250,343 Black or African American householders$171,606 American Indian or Alaska Native householders $375,313 Asian householders$249,131 Some other race householders$274,368 Two or more races householders$247,718 Hispanic or Latino householders
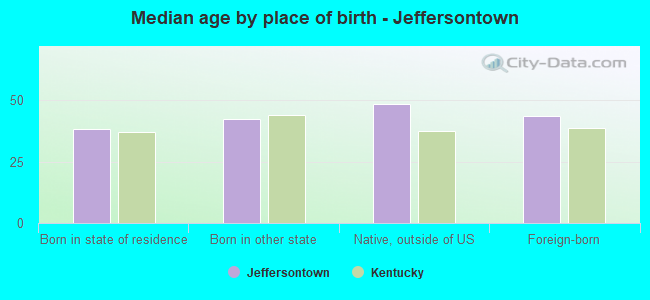
Median age by race in Jeffersontown
41.7 Median age for White residents41.0 44.5 31.8 Median age for Black or African American residents32.4 28.5 -437,389,770.3 Median age for American Indian / Alaska Native residents-773,391,812.1 -540,838,851.6 37.5 Median age for Asian residents40.9 36.3 -724,183,005.8 Median age for Native Hawaiian / Pacific Islander residents-724,043,715.1 -853,801,168.7 25.8 Median age for Other race residents16.7 24.7 27.8 Median age for Two or more races residents18.2 33.5 41.2 Median age for White alone residents40.4 44.2 44.8 Median age for Hispanic or Latino residents43.0 46.5
Owner/renter occupied households by race in Jeffersontown
House owners and renters - White residents 7,230 74.3% Owner occupied2,506 25.7% Renter occupiedHouse owners and renters - Black or African American residents 880 58.2% Owner occupied631 41.8% Renter occupiedHouse owners and renters - Asian residents 131 31.5% Owner occupied283 68.5% Renter occupiedHouse owners and renters - Other race residents 78 43.6% Owner occupied101 56.4% Renter occupiedHouse owners and renters - Two or more races residents 360 55.6% Owner occupied287 44.4% Renter occupiedHouse owners and renters - White alone residents 7,152 74.3% Owner occupied2,473 25.7% Renter occupiedHouse owners and renters - Hispanic or Latino residents 440 64.9% Owner occupied238 35.1% Renter occupied
Language usage in Jeffersontown
English speakers - Total 89.9% of residents of Jeffersontown speak English at home.
3.6% of residents speak Spanish at home 610 63.5% Speak English very well351 36.5% Speak English less than very well6.6% of residents speak other language at home 1,251 70.4% Speak English very well527 29.6% Speak English less than very well
English speakers - Born in the United States 96.6% of residents of Jeffersontown speak English at home.
2.1% of residents speak Spanish at home 133 91.7% Speak English very well12 8.3% Speak English less than very well1.0% of residents speak other language at home 71 100.0% Speak English very well
English speakers - Native, born elsewhere 66.5% of residents of Jeffersontown speak English at home.
10.5% of residents speak Spanish at home 2 10.0% Speak English very well18 90.0% Speak English less than very well25.7% of residents speak other language at home 49 100.0% Speak English very well
English speakers - Foreign-born 15.2% of residents of Jeffersontown speak English at home.
26.4% of residents speak Spanish at home 347 56.5% Speak English very well267 43.5% Speak English less than very well59.3% of residents speak other language at home 903 65.5% Speak English very well476 34.5% Speak English less than very well
White (Caucasian) - Speak only English Native:
98.5% (19,185)Foreign-born:
29.9% (184)
White (Caucasian) - Speak another language Native:
1.4% (278)Foreign-born:
71.3% (439)
Black or African American - Speak only English Native:
99.9% (3,176)Foreign-born:
45.4% (49)
Black or African American - Speak another language Native:
0.4% (14)Foreign-born:
59.1% (64)
Asian - Speak only English Native:
43.0% (118)Foreign-born:
5.7% (49)
Asian - Speak another language Native:
51.9% (143)Foreign-born:
94.8% (808)
Other race - Speak only English Native:
62.2% (219)Foreign-born:
13.3% (22)
Other race - Speak another language Native:
30.0% (105)Foreign-born:
87.0% (142)
Two or more races - Speak only English Native:
91.3% (1,020)Foreign-born:
4.0% (19)
Two or more races - Speak another language Native:
3.0% (34)Foreign-born:
96.0% (457)
White alone - Speak only English Native:
98.7% (19,107)Foreign-born:
24.5% (132)
White alone - Speak another language Native:
1.3% (257)Foreign-born:
75.9% (408)
Hispanic or Latino - Speak only English Native:
60.9% (343)Foreign-born:
16.2% (118)
Hispanic or Latino - Speak another language Native:
40.1% (226)Foreign-born:
84.5% (615)
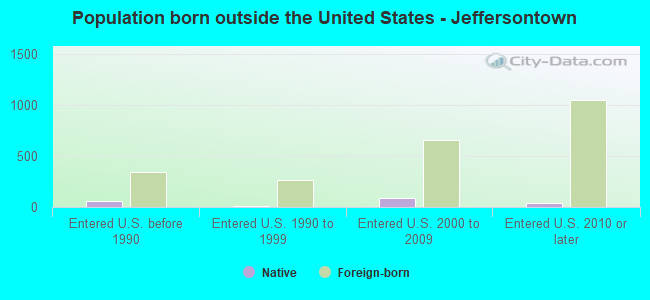
Foreign-born residents in Jeffersontown 2,576 residents are foreign born (4.2% Asia , 2.1% Latin America , 2.0% Europe ).
This city:
9.0%Kentucky:
4.1%
Marital status for residents in Jeffersontown Marital status - White (Caucasian) population 15 years and over
Males 27.7% Never married56.9% Now married2.0% Separated2.3% Widowed11.0% DivorcedFemales 22.2% Never married52.6% Now married2.0% Separated9.4% Widowed13.8% DivorcedWomen who gave birth in the past 12 months Now married:
100.0% (179)Unmarried:
0.0% (0)
Women who did not give birth in the past 12 months Now married:
49.5% (2,104)Unmarried:
50.5% (2,144)
Marital status - Black or African American population 15 years and over
Males 31.7% Never married53.0% Now married1.1% Separated2.4% Widowed11.9% DivorcedFemales 41.0% Never married34.1% Now married4.0% Separated6.5% Widowed14.4% DivorcedWomen who gave birth in the past 12 months Now married:
100.0% (25)Unmarried:
0.0% (0)
Women who did not give birth in the past 12 months Now married:
28.3% (250)Unmarried:
71.7% (635)
Marital status - Asian population 15 years and over
Males 20.2% Never married76.2% Now married3.6% Separated0.0% Widowed0.0% DivorcedFemales 24.7% Never married60.8% Now married4.1% Separated8.1% Widowed2.3% DivorcedWomen who gave birth in the past 12 months Now married:
100.0% (17)Unmarried:
0.0% (0)
Women who did not give birth in the past 12 months Now married:
58.1% (214)Unmarried:
41.9% (155)
Marital status - Other race population 15 years and over
Males 0.0% Never married87.0% Now married0.0% Separated0.0% Widowed13.0% DivorcedFemales 50.0% Never married45.0% Now married0.0% Separated0.0% Widowed5.0% DivorcedWomen who gave birth in the past 12 months Now married:
100.0% (37)Unmarried:
0.0% (0)
Women who did not give birth in the past 12 months Now married:
33.6% (75)Unmarried:
66.4% (148)
Marital status - Two or more races population 15 years and over
Males 28.4% Never married61.4% Now married0.0% Separated0.0% Widowed10.1% DivorcedFemales 49.8% Never married31.8% Now married0.0% Separated0.0% Widowed18.5% DivorcedWomen who gave birth in the past 12 months Now married:
100.0% (9)Unmarried:
0.0% (0)
Women who did not give birth in the past 12 months Now married:
16.5% (91)Unmarried:
83.5% (463)
Marital status - White alone, not Hispanic / Latino population 15 years and over
Males 28.2% Never married57.0% Now married2.0% Separated2.2% Widowed10.5% DivorcedFemales 22.2% Never married52.8% Now married1.5% Separated9.4% Widowed14.1% DivorcedWomen who gave birth in the past 12 months Now married:
100.0% (174)Unmarried:
0.0% (0)
Women who did not give birth in the past 12 months Now married:
49.0% (2,071)Unmarried:
51.0% (2,152)
Marital status - Hispanic or Latino population 15 years and over
Males 7.1% Never married72.9% Now married0.0% Separated3.5% Widowed16.5% DivorcedFemales 18.9% Never married50.4% Now married9.2% Separated4.1% Widowed17.5% DivorcedWomen who gave birth in the past 12 months Now married:
100.0% (47)Unmarried:
0.0% (0)
Women who did not give birth in the past 12 months Now married:
54.5% (143)Unmarried:
45.5% (120)
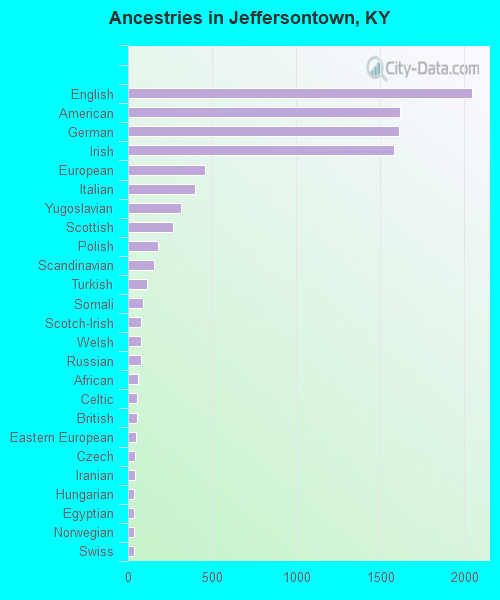
Ancestries in Jeffersontown
2,044 13.3% English1,620 10.5% American1,610 10.5% German1,580 10.3% Irish456 3.0% European401 2.6% Italian313 2.0% Yugoslavian270 1.8% Scottish179 1.2% Polish154 1.0% Scandinavian115 0.7% Turkish89 0.6% Somali80 0.5% Scotch-Irish80 0.5% Welsh79 0.5% Russian62 0.4% African54 0.4% Celtic52 0.3% British49 0.3% Eastern European44 0.3% Czech42 0.3% Iranian34 0.2% Hungarian33 0.2% Egyptian33 0.2% Norwegian33 0.2% Swiss26 0.2% French23 0.1% Lebanese19 0.1% Swedish18 0.1% Israeli16 0.1% French Canadian13 0.08% Palestinian12 0.08% Austrian11 0.07% Ukrainian9 0.06% Danish8 0.05% Czechoslovakian
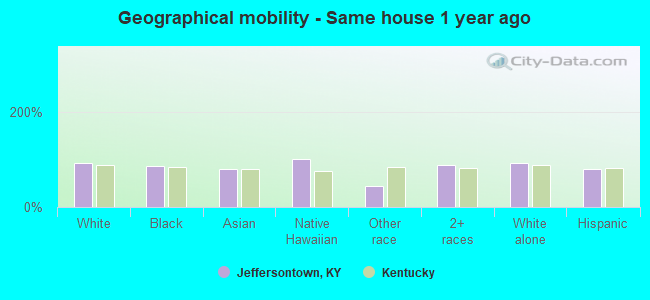
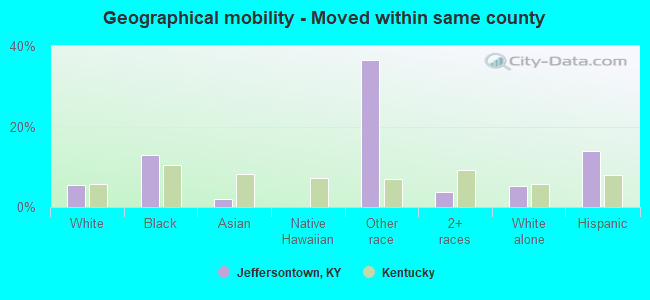
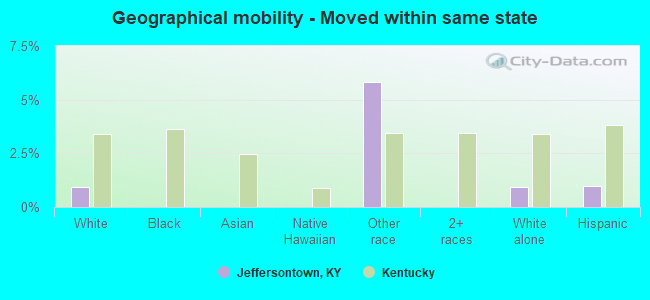
Geographical mobility in Jeffersontown Same house 1 year ago 19,132 92.2% White (Caucasian)2,972 85.1% Black or African American950 80.3% Asian6 100.0% Native Hawaiian / Pacific Islander260 44.9% Other race1,563 88.4% Two or more races19,000 92.5% White alone, not Hispanic / Latino1,120 79.7% Hispanic or LatinoMoved within same county 1,130 5.4% White / Caucasian450 12.9% Black or African American24 2.0% Asian212 36.6% Other race67 3.8% Two or more races1,054 5.1% White alone, not Hispanic / Latino197 14.0% Hispanic or LatinoMoved within same state 192 0.9% White / Caucasian34 5.8% Other race187 0.9% White alone, not Hispanic / Latino14 1.0% Hispanic or LatinoMoved from different state 343 1.7% White / Caucasian33 2.8% Asian108 6.1% Two or more races337 1.6% White alone, not Hispanic / Latino50 3.5% Hispanic or LatinoMoved from abroad 279 23.6% Asian
Children Nativity (place of birth) in Jeffersontown
Children under 6 years - Living with two parents Both parents native 1,345 100.0% NativeBoth parents foreign-born 182 70.6% Native76 29.4% Foreign-bornOne native, one foreign-born parent 23 100.0% NativeChildren under 6 years - Living with one parent Native parent 329 100.0% NativeChildren 6 to 17 years - Living with two parents Both parents native 2,231 99.7% Native7 0.3% Foreign-bornBoth parents foreign-born 243 73.3% Native88 26.7% Foreign-bornOne native, one foreign-born parent 10 100.0% NativeChildren 6 to 17 years - Living with one parent Native parent 1,318 100.0% NativeForeign-born parent 154 48.4% Native164 51.6% Foreign-born
Grandparents responsible for own grandchildren in Jeffersontown
Grandparents (30 to 59 years) White / Caucasian 53 47.6% Responsible for grandchildren58 52.4% Not responsible for grandchildrenBlack or African American 6 9.4% Responsible for grandchildren53 90.6% Not responsible for grandchildrenWhite alone, not Hispanic / Latino 54 46.0% Responsible for grandchildren64 54.0% Not responsible for grandchildrenGrandparents (60 years and over) White / Caucasian 34 53.0% Responsible for grandchildren30 47.0% Not responsible for grandchildrenBlack or African American 5 100.0% Not responsible for grandchildrenWhite alone, not Hispanic / Latino 35 52.3% Responsible for grandchildren32 47.7% Not responsible for grandchildren