Races in Johnston, Iowa (IA) Detailed Stats
Data:
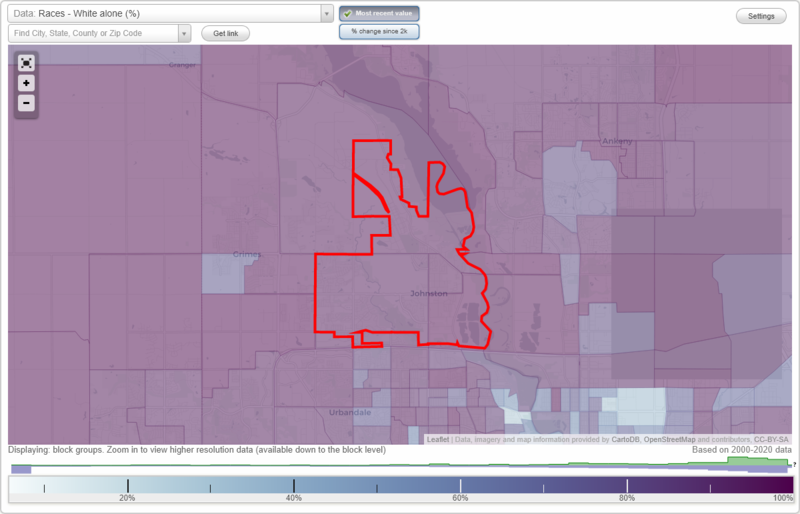
Races - White alone (%)
Races - White alone (% change since 2000)
Races - Black alone (%)
Races - Black alone (% change since 2000)
Races - American Indian alone (%)
Races - American Indian alone (% change since 2000)
Races - Asian alone (%)
Races - Asian alone (% change since 2000)
Races - Hispanic (%)
Races - Hispanic (% change since 2000)
Races - Native Hawaiian and Other Pacific Islander alone (%)
Races - Native Hawaiian and Other Pacific Islander alone (% change since 2000)
Races - Two or more races(%)
Races - Two or more races(% change since 2000)
Races - Other race alone (%)
Races - Other race alone (% change since 2000)
Racial diversity
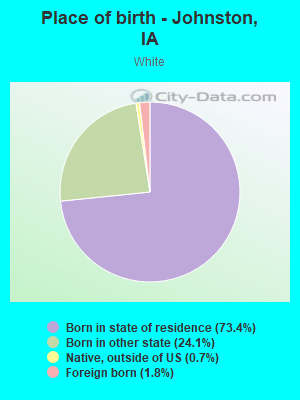
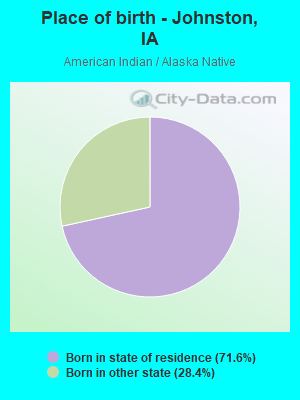
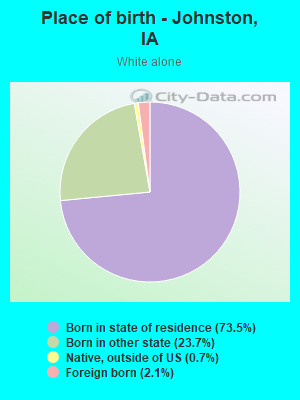
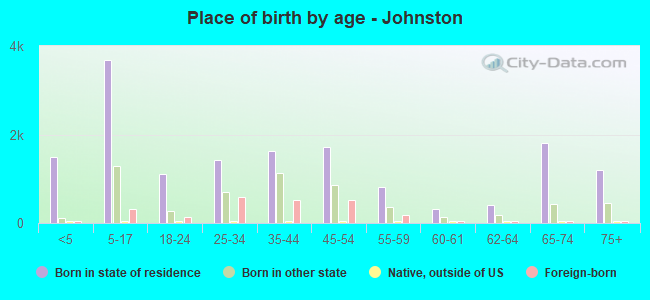
Place of birth - Born in state of residence (%)
Place of birth - Born in state of residence (%) - White
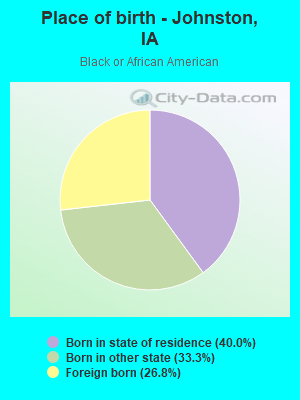
Place of birth - Born in state of residence (%) - Black or African American
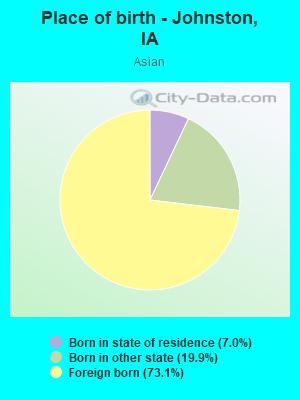
Place of birth - Born in state of residence (%) - Asian
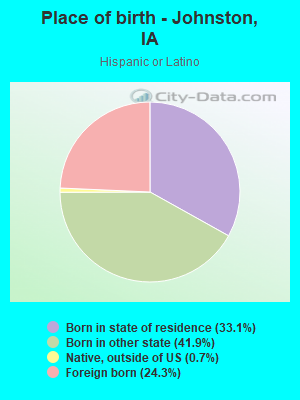
Place of birth - Born in state of residence (%) - Hispanic or Latino
Place of birth - Born in state of residence (%) - American Indian and Alaska Native
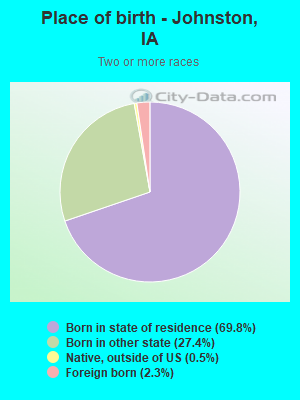
Place of birth - Born in state of residence (%) - Multirace
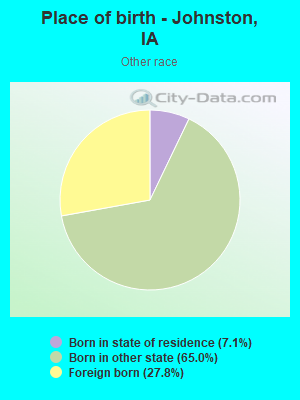
Place of birth - Born in state of residence (%) - Other Race
Place of birth - Born in other state (%)
Place of birth - Born in other state (%) - White
Place of birth - Born in other state (%) - Black or African American
Place of birth - Born in other state (%) - Asian
Place of birth - Born in other state (%) - Hispanic or Latino
Place of birth - Born in other state (%) - American Indian and Alaska Native
Place of birth - Born in other state (%) - Multirace
Place of birth - Born in other state (%) - Other Race
Place of birth - Native, outside of US (%)
Place of birth - Native, outside of US (%) - White
Place of birth - Native, outside of US (%) - Black or African American
Place of birth - Native, outside of US (%) - Asian
Place of birth - Native, outside of US (%) - Hispanic or Latino
Place of birth - Native, outside of US (%) - American Indian and Alaska Native
Place of birth - Native, outside of US (%) - Multirace
Place of birth - Native, outside of US (%) - Other Race
Place of birth - Foreign born (%)
Place of birth - Foreign born (%) - White
Place of birth - Foreign born (%) - Black or African American
Place of birth - Foreign born (%) - Asian
Place of birth - Foreign born (%) - Hispanic or Latino
Place of birth - Foreign born (%) - American Indian and Alaska Native
Place of birth - Foreign born (%) - Multirace
Place of birth - Foreign born (%) - Other Race
Residents speaking English at home (%)
Residents speaking English at home - Born in the United States (%)
Residents speaking English at home - Native, born elsewhere (%)
Residents speaking English at home - Foreign born (%)
Residents speaking Spanish at home (%)
Residents speaking Spanish at home - Born in the United States (%)
Residents speaking Spanish at home - Native, born elsewhere (%)
Residents speaking Spanish at home - Foreign born (%)
Residents speaking other language at home (%)
Residents speaking other language at home - Born in the United States (%)
Residents speaking other language at home - Native, born elsewhere (%)
Residents speaking other language at home - Foreign born (%)
Marital status - Never married (%)
Marital status - Now married (%)
Marital status - Separated (%)
Marital status - Widowed (%)
Marital status - Divorced (%)
Ancestries Reported - Arab (%)
Ancestries Reported - Czech (%)
Ancestries Reported - Danish (%)
Ancestries Reported - Dutch (%)
Ancestries Reported - English (%)
Ancestries Reported - French (%)
Ancestries Reported - French Canadian (%)
Ancestries Reported - German (%)
Ancestries Reported - Greek (%)
Ancestries Reported - Hungarian (%)
Ancestries Reported - Irish (%)
Ancestries Reported - Italian (%)
Ancestries Reported - Lithuanian (%)
Ancestries Reported - Norwegian (%)
Ancestries Reported - Polish (%)
Ancestries Reported - Portuguese (%)
Ancestries Reported - Russian (%)
Ancestries Reported - Scotch-Irish (%)
Ancestries Reported - Scottish (%)
Ancestries Reported - Slovak (%)
Ancestries Reported - Subsaharan African (%)
Ancestries Reported - Swedish (%)
Ancestries Reported - Swiss (%)
Ancestries Reported - Ukrainian (%)
Ancestries Reported - United States (%)
Ancestries Reported - Welsh (%)
Ancestries Reported - West Indian (%)
Ancestries Reported - Other (%)
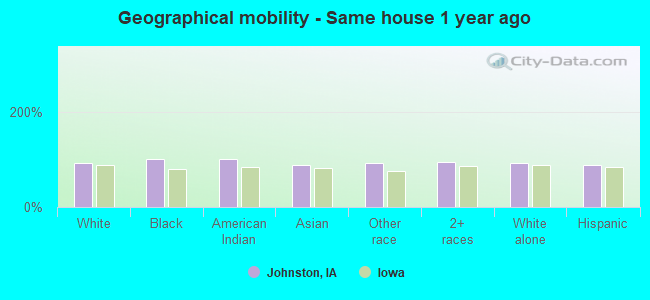
Geographical mobility - Same house 1 year ago (%)
Geographical mobility - Same house 1 year ago (%) - White
Geographical mobility - Same house 1 year ago (%) - Black or African American
Geographical mobility - Same house 1 year ago (%) - Asian
Geographical mobility - Same house 1 year ago (%) - Hispanic or Latino
Geographical mobility - Same house 1 year ago (%) - American Indian and Alaska Native
Geographical mobility - Same house 1 year ago (%) - Multirace
Geographical mobility - Same house 1 year ago (%) - Other Race
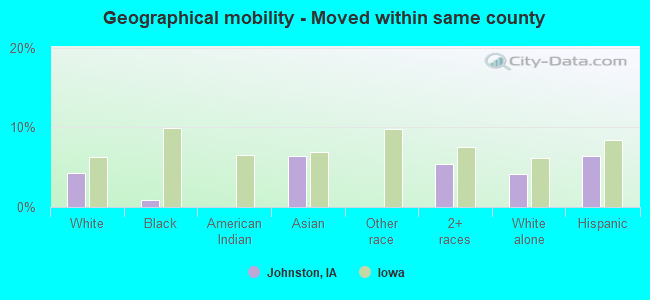
Geographical mobility - Moved within same county (%)
Geographical mobility - Moved within same county (%) - White
Geographical mobility - Moved within same county (%) - Black or African American
Geographical mobility - Moved within same county (%) - Asian
Geographical mobility - Moved within same county (%) - Hispanic or Latino
Geographical mobility - Moved within same county (%) - American Indian and Alaska Native
Geographical mobility - Moved within same county (%) - Multirace
Geographical mobility - Moved within same county (%) - Other Race
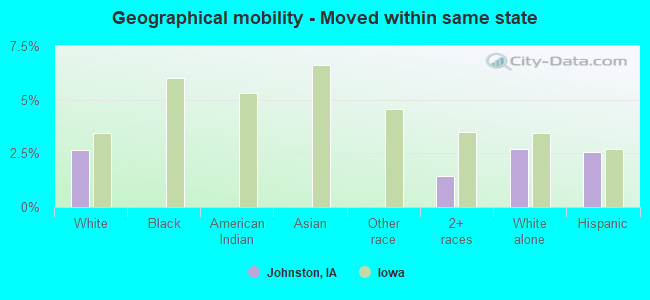
Geographical mobility - Moved from different county within same state (%)
Geographical mobility - Moved from different county within same state (%) - White
Geographical mobility - Moved from different county within same state (%) - Black or African American
Geographical mobility - Moved from different county within same state (%) - Asian
Geographical mobility - Moved from different county within same state (%) - Hispanic or Latino
Geographical mobility - Moved from different county within same state (%) - American Indian and Alaska Native
Geographical mobility - Moved from different county within same state (%) - Multirace
Geographical mobility - Moved from different county within same state (%) - Other Race
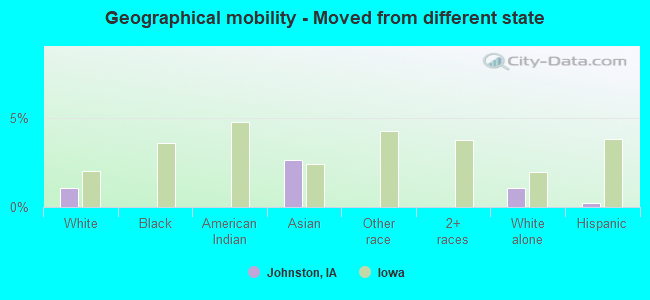
Geographical mobility - Moved from different state (%)
Geographical mobility - Moved from different state (%) - White
Geographical mobility - Moved from different state (%) - Black or African American
Geographical mobility - Moved from different state (%) - Asian
Geographical mobility - Moved from different state (%) - Hispanic or Latino
Geographical mobility - Moved from different state (%) - American Indian and Alaska Native
Geographical mobility - Moved from different state (%) - Multirace
Geographical mobility - Moved from different state (%) - Other Race
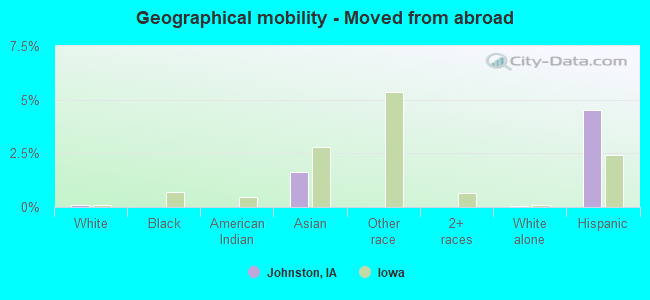
Geographical mobility - Moved from abroad (%)
Geographical mobility - Moved from abroad (%) - White
Geographical mobility - Moved from abroad (%) - Black or African American
Geographical mobility - Moved from abroad (%) - Asian
Geographical mobility - Moved from abroad (%) - Hispanic or Latino
Geographical mobility - Moved from abroad (%) - American Indian and Alaska Native
Geographical mobility - Moved from abroad (%) - Multirace
Geographical mobility - Moved from abroad (%) - Other Race
Place of birth for the foreign-born population - Ireland (%)
Place of birth for the foreign-born population - Denmark (%)
Place of birth for the foreign-born population - Norway (%)
Place of birth for the foreign-born population - Sweden (%)
Place of birth for the foreign-born population - United Kingdom (%)
Place of birth for the foreign-born population - England (%)
Place of birth for the foreign-born population - Scotland (%)
Place of birth for the foreign-born population - Other Northern Europe (%)
Place of birth for the foreign-born population - Austria (%)
Place of birth for the foreign-born population - Belgium (%)
Place of birth for the foreign-born population - France (%)
Place of birth for the foreign-born population - Germany (%)
Place of birth for the foreign-born population - Netherlands (%)
Place of birth for the foreign-born population - Switzerland (%)
Place of birth for the foreign-born population - Other Western Europe (%)
Place of birth for the foreign-born population - Greece (%)
Place of birth for the foreign-born population - Italy (%)
Place of birth for the foreign-born population - Portugal (%)
Place of birth for the foreign-born population - Spain (%)
Place of birth for the foreign-born population - Other Southern Europe (%)
Place of birth for the foreign-born population - Albania (%)
Place of birth for the foreign-born population - Belarus (%)
Place of birth for the foreign-born population - Bosnia and Herzegovina (%)
Place of birth for the foreign-born population - Bulgaria (%)
Place of birth for the foreign-born population - Croatia (%)
Place of birth for the foreign-born population - Czechoslovakia (%)
Place of birth for the foreign-born population - Hungary (%)
Place of birth for the foreign-born population - Latvia (%)
Place of birth for the foreign-born population - Lithuania (%)
Place of birth for the foreign-born population - North Macedonia (Macedonia) (%)
Place of birth for the foreign-born population - Moldova (%)
Place of birth for the foreign-born population - Poland (%)
Place of birth for the foreign-born population - Romania (%)
Place of birth for the foreign-born population - Russia (%)
Place of birth for the foreign-born population - Serbia (%)
Place of birth for the foreign-born population - Ukraine (%)
Place of birth for the foreign-born population - Other Eastern Europe (%)
Place of birth for the foreign-born population - China (%)
Place of birth for the foreign-born population - Hong Kong (%)
Place of birth for the foreign-born population - Taiwan (%)
Place of birth for the foreign-born population - Japan (%)
Place of birth for the foreign-born population - Korea (%)
Place of birth for the foreign-born population - Other Eastern Asia (%)
Place of birth for the foreign-born population - Afghanistan (%)
Place of birth for the foreign-born population - Bangladesh (%)
Place of birth for the foreign-born population - India (%)
Place of birth for the foreign-born population - Iran (%)
Place of birth for the foreign-born population - Kazakhstan (%)
Place of birth for the foreign-born population - Nepal (%)
Place of birth for the foreign-born population - Pakistan (%)
Place of birth for the foreign-born population - Sri Lanka (%)
Place of birth for the foreign-born population - Uzbekistan (%)
Place of birth for the foreign-born population - Other South Central Asia (%)
Place of birth for the foreign-born population - Burma (%)
Place of birth for the foreign-born population - Cambodia (%)
Place of birth for the foreign-born population - Indonesia (%)
Place of birth for the foreign-born population - Laos (%)
Place of birth for the foreign-born population - Malaysia (%)
Place of birth for the foreign-born population - Philippines (%)
Place of birth for the foreign-born population - Singapore (%)
Place of birth for the foreign-born population - Thailand (%)
Place of birth for the foreign-born population - Vietnam (%)
Place of birth for the foreign-born population - Other South Eastern Asia (%)
Place of birth for the foreign-born population - Armenia (%)
Place of birth for the foreign-born population - Iraq (%)
Place of birth for the foreign-born population - Israel (%)
Place of birth for the foreign-born population - Jordan (%)
Place of birth for the foreign-born population - Kuwait (%)
Place of birth for the foreign-born population - Lebanon (%)
Place of birth for the foreign-born population - Saudi Arabia (%)
Place of birth for the foreign-born population - Syria (%)
Place of birth for the foreign-born population - Turkey (%)
Place of birth for the foreign-born population - Yemen (%)
Place of birth for the foreign-born population - Other Western Asia (%)
Place of birth for the foreign-born population - Eritrea (%)
Place of birth for the foreign-born population - Ethiopia (%)
Place of birth for the foreign-born population - Kenya (%)
Place of birth for the foreign-born population - Somalia (%)
Place of birth for the foreign-born population - Uganda (%)
Place of birth for the foreign-born population - Zimbabwe (%)
Place of birth for the foreign-born population - Other Eastern Africa (%)
Place of birth for the foreign-born population - Cameroon (%)
Place of birth for the foreign-born population - Congo (%)
Place of birth for the foreign-born population - Democratic Republic of Congo (Zaire) (%)
Place of birth for the foreign-born population - Other Middle Africa (%)
Place of birth for the foreign-born population - Egypt (%)
Place of birth for the foreign-born population - Morocco (%)
Place of birth for the foreign-born population - Sudan (%)
Place of birth for the foreign-born population - Other Northern Africa (%)
Place of birth for the foreign-born population - South Africa (%)
Place of birth for the foreign-born population - Other Southern Africa (%)
Place of birth for the foreign-born population - Cabo Verde (%)
Place of birth for the foreign-born population - Ghana (%)
Place of birth for the foreign-born population - Liberia (%)
Place of birth for the foreign-born population - Nigeria (%)
Place of birth for the foreign-born population - Senegal (%)
Place of birth for the foreign-born population - Sierra Leone (%)
Place of birth for the foreign-born population - Other Western Africa (%)
Place of birth for the foreign-born population - Australia (%)
Place of birth for the foreign-born population - New Zealand (%)
Place of birth for the foreign-born population - Fiji (%)
Place of birth for the foreign-born population - Micronesia (%)
Place of birth for the foreign-born population - Bahamas (%)
Place of birth for the foreign-born population - Barbados (%)
Place of birth for the foreign-born population - Cuba (%)
Place of birth for the foreign-born population - Dominica (%)
Place of birth for the foreign-born population - Dominican Republic (%)
Place of birth for the foreign-born population - Grenada (%)
Place of birth for the foreign-born population - Haiti (%)
Place of birth for the foreign-born population - Jamaica (%)
Place of birth for the foreign-born population - St. Vincent and the Grenadines (%)
Place of birth for the foreign-born population - Trinidad and Tobago (%)
Place of birth for the foreign-born population - West Indies (%)
Place of birth for the foreign-born population - Other Caribbean (%)
Place of birth for the foreign-born population - Belize (%)
Place of birth for the foreign-born population - Costa Rica (%)
Place of birth for the foreign-born population - El Salvador (%)
Place of birth for the foreign-born population - Guatemala (%)
Place of birth for the foreign-born population - Honduras (%)
Place of birth for the foreign-born population - Mexico (%)
Place of birth for the foreign-born population - Nicaragua (%)
Place of birth for the foreign-born population - Panama (%)
Place of birth for the foreign-born population - Other Central America (%)
Place of birth for the foreign-born population - Argentina (%)
Place of birth for the foreign-born population - Bolivia (%)
Place of birth for the foreign-born population - Brazil (%)
Place of birth for the foreign-born population - Chile (%)
Place of birth for the foreign-born population - Colombia (%)
Place of birth for the foreign-born population - Ecuador (%)
Place of birth for the foreign-born population - Guyana (%)
Place of birth for the foreign-born population - Peru (%)
Place of birth for the foreign-born population - Uruguay (%)
Place of birth for the foreign-born population - Venezuela (%)
Place of birth for the foreign-born population - Other South America (%)
Place of birth for the foreign-born population - Canada (%)
Place of birth for the foreign-born population - Other Northern America (%)
Place of birth for the foreign-born population - Other (%)
Latest news about races in Johnston, IA collected exclusively by city-data.com from local newspapers, TV, and radio stations
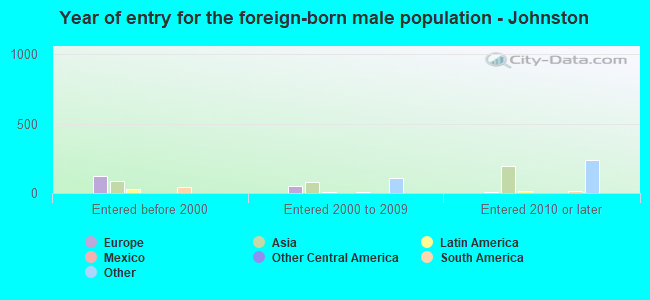
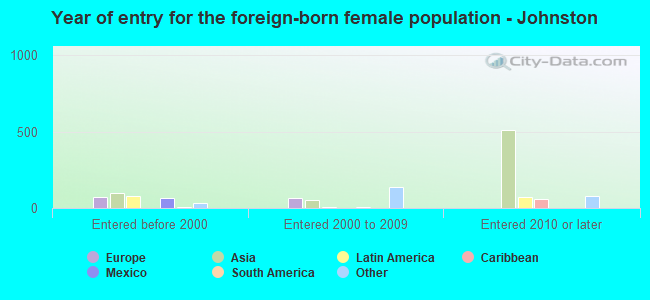
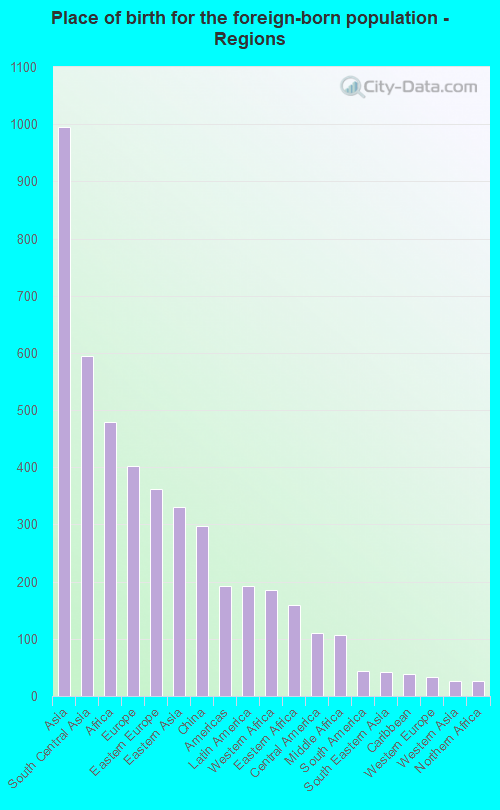
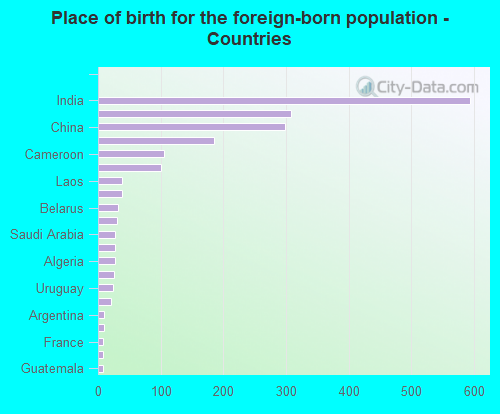
According to 2022 data, the most numerous races in Johnston, IA are White alone (18,441 residents), Hispanic (787 residents), and Black alone (2,640 residents). 87.4% of Johnston residents speak English at home. 8.6% of Johnston, IA residents are foreign-born (4.1% born in Asia, 2.0% born in Africa, 1.7% born in Europe), which is 41.5% greater than the foreign-born rate of 5.0% across the entire state of Iowa.
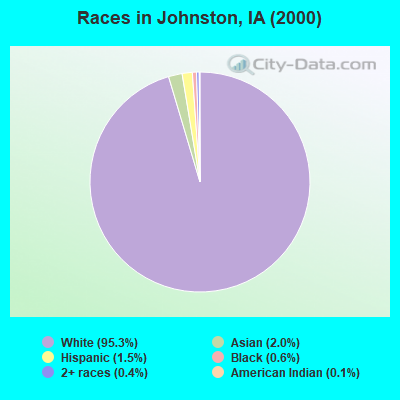
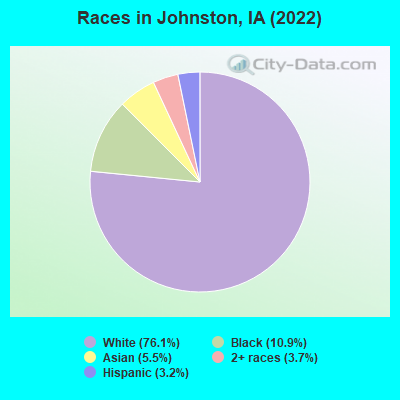
Race distribution in Johnston
2000 2022
2,710,344 92.6% White alone 82,473 2.8% Hispanic 60,744 2.1% Black alone 36,345 1.2% Asian alone 25,472 0.9% Two or more races 7,955 0.3% American Indian alone 2,103 0.07% Other race alone 888 0.03% Native Hawaiian and Other
2,650,110 82.8% White alone 218,024 6.8% Hispanic 119,004 3.7% Black alone 115,286 3.6% Two or more races 74,892 2.3% Asian alone 9,260 0.3% Other race alone 8,595 0.3% Native Hawaiian and Other 5,346 0.2% American Indian alone
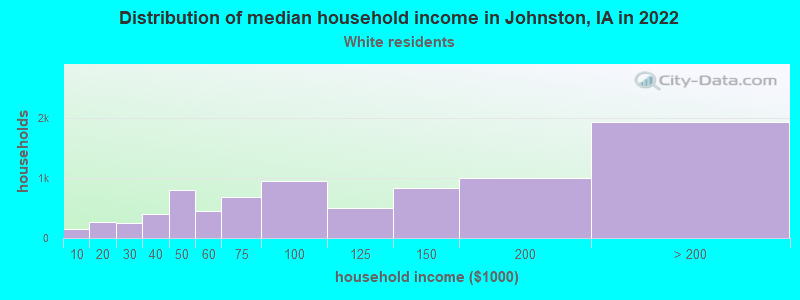
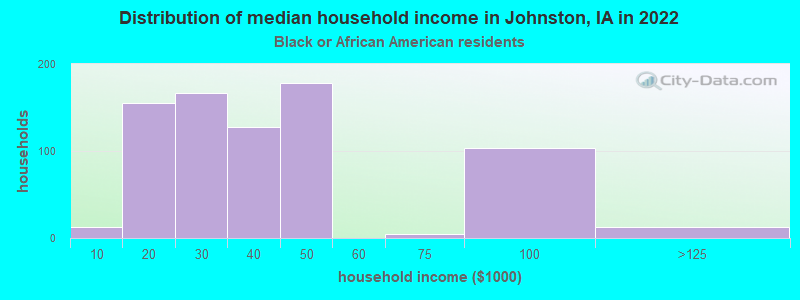
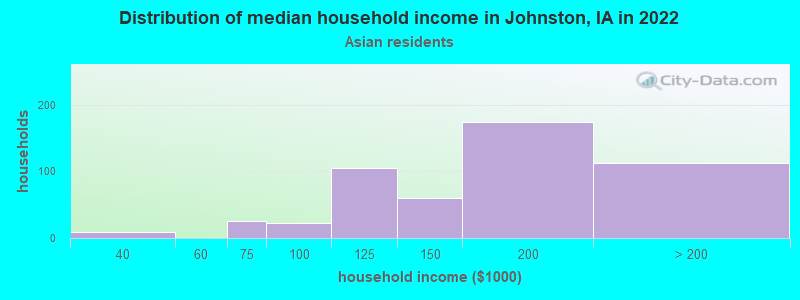
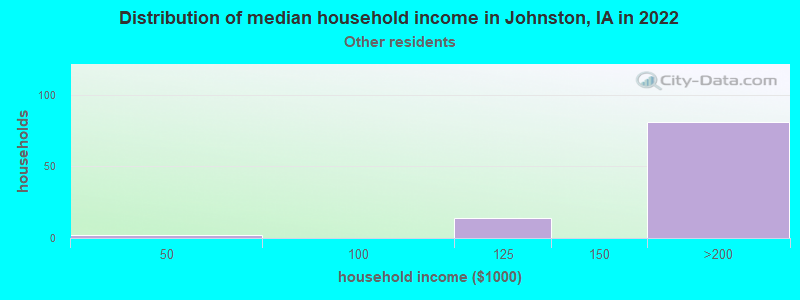
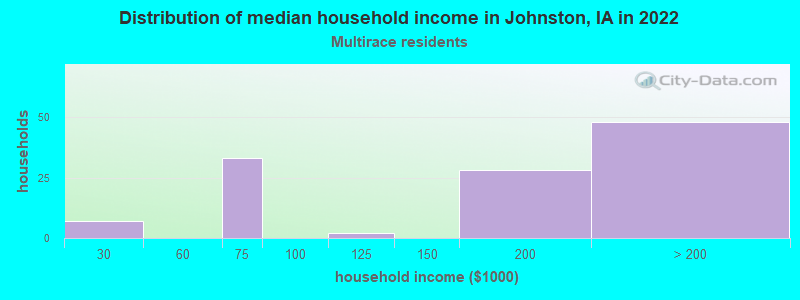
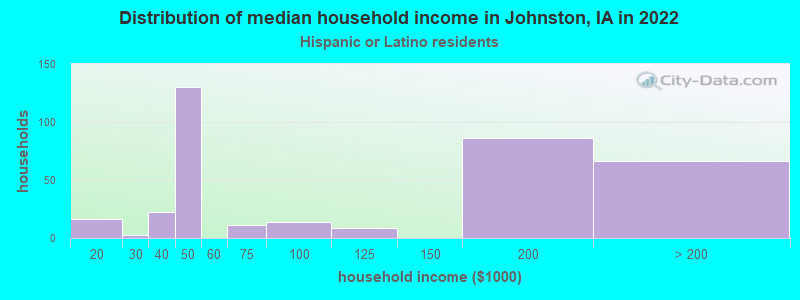
Income and house value in Johnston Median household income in 2022 $103,702 White non-Hispanic householders$32,137 Black householders$158,392 Asian householders$161,705 Some other race householdersover $200,000 Two or more races householdersMedian 2022 house value $364,710 White Non-Hispanic householders$183,029 Black or African American householders $315,581 Asian householders
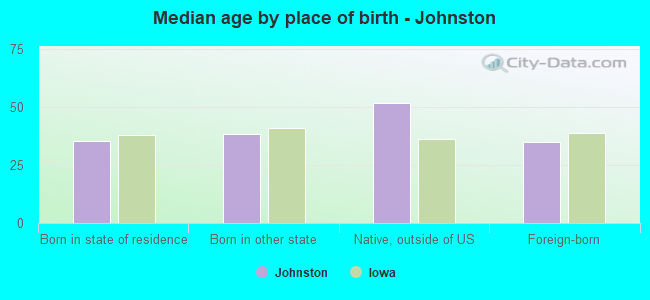
Median age by race in Johnston
42.1 Median age for White residents41.0 44.3 14.3 Median age for Black or African American residents11.2 14.3 34.1 Median age for American Indian / Alaska Native residents-518,072,288.6 15.9 35.9 Median age for Asian residents40.5 27.3 -580,729,166.1 Median age for Native Hawaiian / Pacific Islander residents-776,978,416.5 -504,347,825.6 56.0 Median age for Other race residents47.7 59.1 14.5 Median age for Two or more races residents11.0 21.5 41.9 Median age for White alone residents40.9 44.6 28.3 Median age for Hispanic or Latino residents27.9 27.1
Owner/renter occupied households by race in Johnston
House owners and renters - White residents 6,332 77.9% Owner occupied1,799 22.1% Renter occupiedHouse owners and renters - Black or African American residents 55 8.8% Owner occupied567 91.2% Renter occupiedHouse owners and renters - Asian residents 302 68.9% Owner occupied136 31.1% Renter occupiedHouse owners and renters - Other race residents 72 84.2% Owner occupied14 15.8% Renter occupiedHouse owners and renters - Two or more races residents 119 72.8% Owner occupied44 27.2% Renter occupiedHouse owners and renters - White alone residents 6,334 78.5% Owner occupied1,739 21.5% Renter occupiedHouse owners and renters - Hispanic or Latino residents 123 47.0% Owner occupied139 53.0% Renter occupied
Language usage in Johnston
English speakers - Total 87.4% of residents of Johnston speak English at home.
1.5% of residents speak Spanish at home 229 69.0% Speak English very well103 31.0% Speak English less than very well10.9% of residents speak other language at home 1,681 68.4% Speak English very well778 31.6% Speak English less than very well
English speakers - Born in the United States 92.7% of residents of Johnston speak English at home.
1.8% of residents speak Spanish at home 82 75.9% Speak English very well26 24.1% Speak English less than very well4.2% of residents speak other language at home 160 64.8% Speak English very well87 35.2% Speak English less than very well
All residents speak only English at home
English speakers - Foreign-born 10.0% of residents of Johnston speak English at home.
5.3% of residents speak Spanish at home 64 52.5% Speak English very well58 47.5% Speak English less than very well84.1% of residents speak other language at home 1,398 72.3% Speak English very well536 27.7% Speak English less than very well
White (Caucasian) - Speak only English Native:
99.7% (17,042)Foreign-born:
17.4% (59)
White (Caucasian) - Speak another language Native:
1.0% (176)Foreign-born:
80.3% (271)
Black or African American - Speak only English Native:
86.0% (1,193)Foreign-born:
7.5% (49)
Black or African American - Speak another language Native:
15.5% (215)Foreign-born:
96.7% (632)
Asian - Speak only English Native:
34.1% (121)Foreign-born:
10.4% (101)
Asian - Speak another language Native:
65.1% (232)Foreign-born:
89.1% (863)
Other race - Speak another language Native:
32.9% (64)Foreign-born:
100.0% (76)
Two or more races - Speak only English Native:
89.9% (794)Foreign-born:
94.9% (25)
White alone - Speak only English Native:
98.8% (16,887)Foreign-born:
4.6% (18)
White alone - Speak another language Native:
1.3% (216)Foreign-born:
89.9% (344)
Hispanic or Latino - Speak only English Native:
79.2% (420)Foreign-born:
27.1% (49)
Hispanic or Latino - Speak another language Native:
25.5% (135)Foreign-born:
68.2% (123)
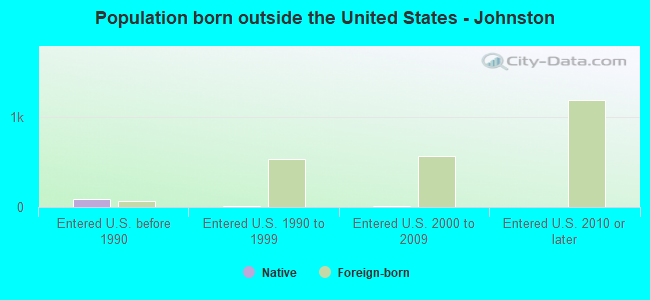
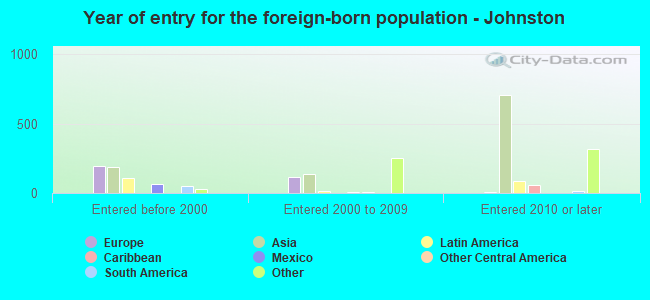
Foreign-born residents in Johnston 2,072 residents are foreign born (4.1% Asia , 2.0% Africa , 1.7% Europe ).
Marital status for residents in Johnston Marital status - White (Caucasian) population 15 years and over
Males 24.3% Never married67.5% Now married0.7% Separated2.4% Widowed5.0% DivorcedFemales 23.4% Never married55.0% Now married1.5% Separated8.8% Widowed11.3% DivorcedWomen who gave birth in the past 12 months Now married:
100.0% (133)Unmarried:
0.0% (0)
Women who did not give birth in the past 12 months Now married:
52.3% (1,957)Unmarried:
47.7% (1,784)
Marital status - Black or African American population 15 years and over
Males 39.5% Never married60.5% Now married0.0% Separated0.0% Widowed0.0% DivorcedFemales 34.1% Never married41.2% Now married0.0% Separated1.2% Widowed23.5% DivorcedWomen who gave birth in the past 12 months Now married:
100.0% (44)Unmarried:
0.0% (0)
Women who did not give birth in the past 12 months Now married:
37.9% (159)Unmarried:
62.1% (261)
Marital status - American Indian / Alaska Native population 15 years and over
Males 0.0% Never married100.0% Now married0.0% Separated0.0% Widowed0.0% DivorcedFemales 66.7% Never married0.0% Now married0.0% Separated0.0% Widowed33.3% DivorcedWomen who did not give birth in the past 12 months Now married:
0.0% (0)Unmarried:
100.0% (8)
Marital status - Asian population 15 years and over
Males 20.3% Never married76.6% Now married0.0% Separated0.0% Widowed3.1% DivorcedFemales 25.6% Never married73.9% Now married0.0% Separated0.0% Widowed0.5% DivorcedWomen who did not give birth in the past 12 months Now married:
71.8% (378)Unmarried:
28.2% (148)
Marital status - Other race population 15 years and over
Males 17.4% Never married82.6% Now married0.0% Separated0.0% Widowed0.0% DivorcedFemales 0.0% Never married100.0% Now married0.0% Separated0.0% Widowed0.0% DivorcedWomen who did not give birth in the past 12 months Now married:
100.0% (5)Unmarried:
0.0% (0)
Marital status - Two or more races population 15 years and over
Males 63.1% Never married29.3% Now married0.0% Separated0.0% Widowed7.6% DivorcedFemales 43.8% Never married48.1% Now married0.0% Separated3.8% Widowed4.3% DivorcedWomen who gave birth in the past 12 months Now married:
100.0% (25)Unmarried:
0.0% (0)
Women who did not give birth in the past 12 months Now married:
44.9% (118)Unmarried:
55.1% (144)
Marital status - White alone, not Hispanic / Latino population 15 years and over
Males 24.5% Never married67.4% Now married0.7% Separated2.2% Widowed5.1% DivorcedFemales 23.5% Never married55.4% Now married0.7% Separated9.0% Widowed11.5% DivorcedWomen who gave birth in the past 12 months Now married:
100.0% (137)Unmarried:
0.0% (0)
Women who did not give birth in the past 12 months Now married:
51.2% (1,878)Unmarried:
48.8% (1,788)
Marital status - Hispanic or Latino population 15 years and over
Males 23.7% Never married70.5% Now married0.0% Separated5.8% Widowed0.0% DivorcedFemales 20.3% Never married50.7% Now married23.1% Separated2.8% Widowed3.1% DivorcedWomen who did not give birth in the past 12 months Now married:
69.1% (162)Unmarried:
30.9% (72)
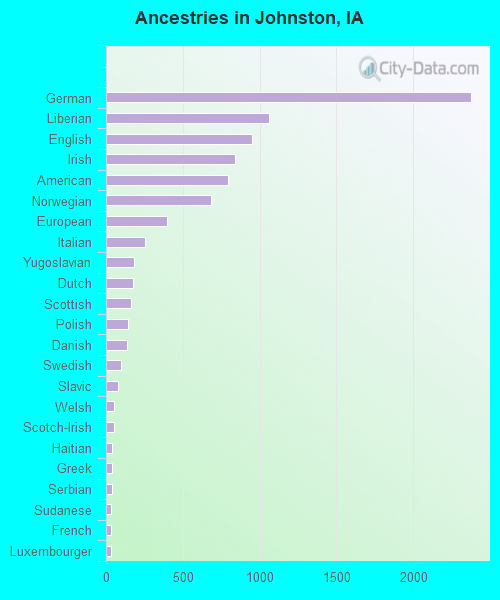
Ancestries in Johnston
2,374 19.2% German1,063 8.6% Liberian952 7.7% English841 6.8% Irish795 6.4% American686 5.5% Norwegian395 3.2% European254 2.1% Italian183 1.5% Yugoslavian173 1.4% Dutch165 1.3% Scottish140 1.1% Polish135 1.1% Danish96 0.8% Swedish78 0.6% Slavic54 0.4% Welsh50 0.4% Scotch-Irish40 0.3% Haitian39 0.3% Greek36 0.3% Serbian34 0.3% Sudanese32 0.3% French31 0.3% Luxembourger20 0.2% Latvian19 0.2% Scandinavian16 0.1% Croatian16 0.1% Eastern European14 0.1% British12 0.10% Swiss10 0.08% Czech7 0.06% Finnish5 0.04% Northern European3 0.02% Lebanese
Geographical mobility in Johnston Same house 1 year ago 16,857 92.6% White (Caucasian)2,717 100.0% Black or African American19 100.0% American Indian / Alaska Native1,167 87.3% Asian256 92.9% Other race1,097 94.3% Two or more races16,913 92.6% White alone, not Hispanic / Latino697 88.5% Hispanic or LatinoMoved within same county 772 4.2% White / Caucasian25 0.9% Black or African American86 6.4% Asian62 5.3% Two or more races767 4.2% White alone, not Hispanic / Latino51 6.5% Hispanic or LatinoMoved within same state 482 2.7% White / Caucasian17 1.4% Two or more races494 2.7% White alone, not Hispanic / Latino20 2.6% Hispanic or LatinoMoved from different state 194 1.1% White / Caucasian35 2.6% Asian198 1.1% White alone, not Hispanic / Latino2 0.3% Hispanic or LatinoMoved from abroad 17 0.1% White22 1.6% Asian6 0.0% White alone, not Hispanic / Latino36 4.5% Hispanic or Latino
Children Nativity (place of birth) in Johnston
Children under 6 years - Living with two parents Both parents native 1,264 100.0% NativeBoth parents foreign-born 108 89.8% Native12 10.2% Foreign-bornOne native, one foreign-born parent 240 100.0% NativeChildren under 6 years - Living with one parent Native parent 332 100.0% NativeForeign-born parent 29 100.0% NativeChildren 6 to 17 years - Living with two parents Both parents native 2,932 100.0% NativeBoth parents foreign-born 250 45.6% Native298 54.4% Foreign-bornOne native, one foreign-born parent 688 100.0% NativeChildren 6 to 17 years - Living with one parent Native parent 775 100.0% NativeForeign-born parent 100 53.0% Native88 47.0% Foreign-born