Races in Johnston, Rhode Island (RI) Detailed Stats
Ancestries, Foreign-born residents, place of birth
4.8% of Johnston, RI residents are foreign-born (2.3% born in Europe, 1.0% born in Asia, 0.8% born in Latin America), which is 191.7% less than the foreign-born rate of 14.0% across the entire state of Rhode Island.
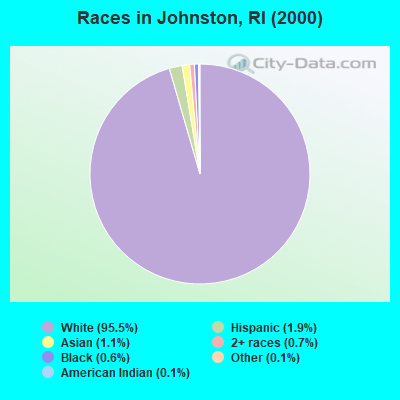
Race distribution in Johnston

- 26,91695.5%White alone
- 5331.9%Hispanic
- 3021.1%Asian alone
- 1960.7%Two or more races
- 1710.6%Black alone
- 350.1%Other race alone
- 320.1%American Indian alone
- 100.04%Native Hawaiian and Other
Pacific Islander alone
2000
2022
-
- 858,43381.9%White alone
- 90,8208.7%Hispanic
- 41,9224.0%Black alone
- 23,4162.2%Asian alone
- 20,8162.0%Two or more races
- 8,4110.8%Other race alone
- 4,1810.4%American Indian alone
- 3200.03%Native Hawaiian and Other
Pacific Islander alone

-
- 745,82568.2%White alone
- 191,97917.6%Hispanic
- 56,7385.2%Two or more races
- 51,3264.7%Black alone
- 37,2343.4%Asian alone
- 9,5140.9%Other race alone
- 9780.09%American Indian alone
- 1400.01%Native Hawaiian and Other
Pacific Islander alone

Income and house value in Johnston
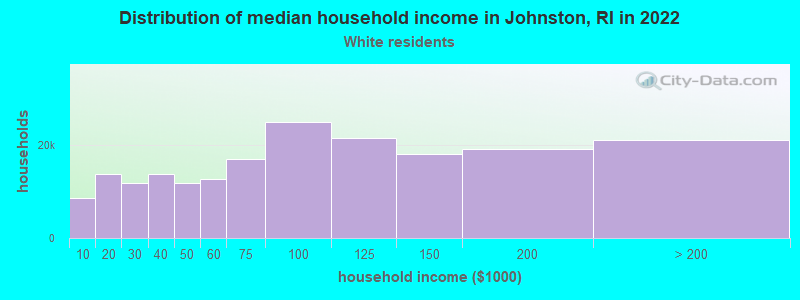
- Median household income in 2022
- $86,854White non-Hispanic householders
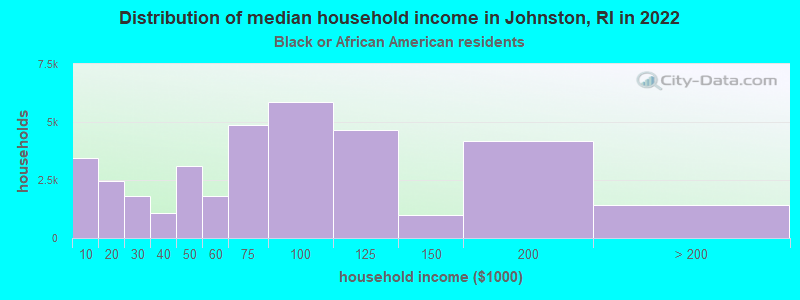
- $154,072Black householders
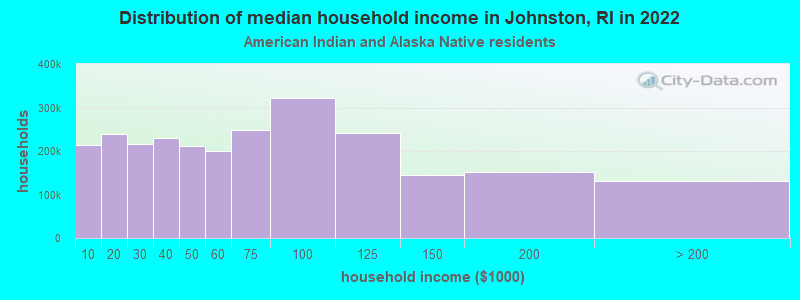
- over $200,000American Indian and Alaska Native householders
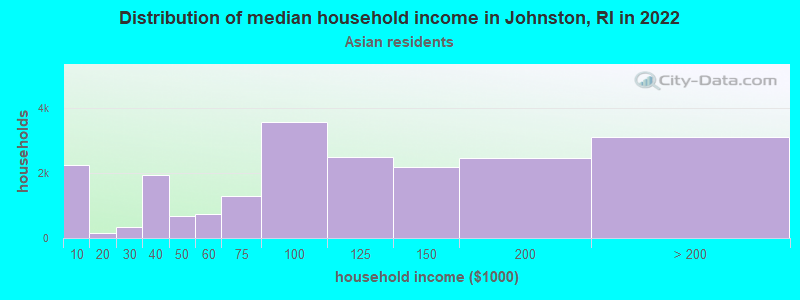
- over $200,000Asian householders
- $76,548Some other race householders
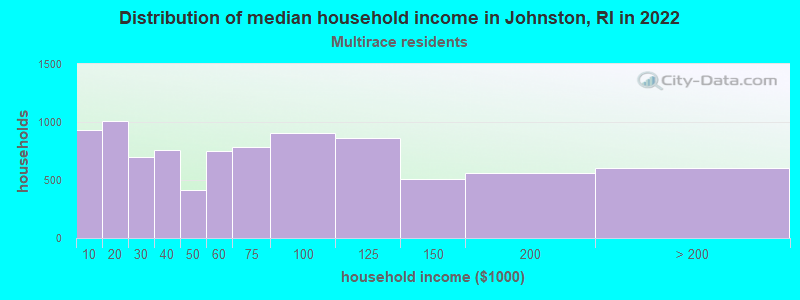
- $15,932Two or more races householders
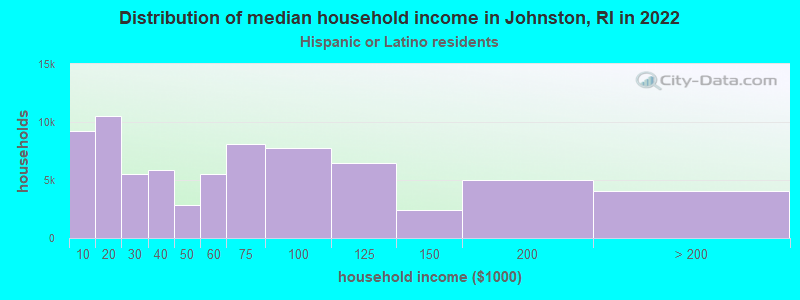
- $76,833Hispanic or Latino race householders
- Median 2022 house value
- $389,837White Non-Hispanic householders
- $418,485Black or African American householders
- $339,040Asian householders
- $406,081Some other race householders
- $328,704Two or more races householders
- $313,937Hispanic or Latino householders
Household income for White non-Hispanic householders
Household income for Black householders
Household income for American Indian and Alaska Native householders
Household income for Asian householders
Household income for Two or more races householders
Household income for Hispanic or Latino race householders
Foreign-born residents in Johnston
1,353 residents are foreign born (2.3% Europe, 1.0% Asia, 0.8% Latin America).
| This city: | 4.8% |
| Rhode Island: | 11.4% |
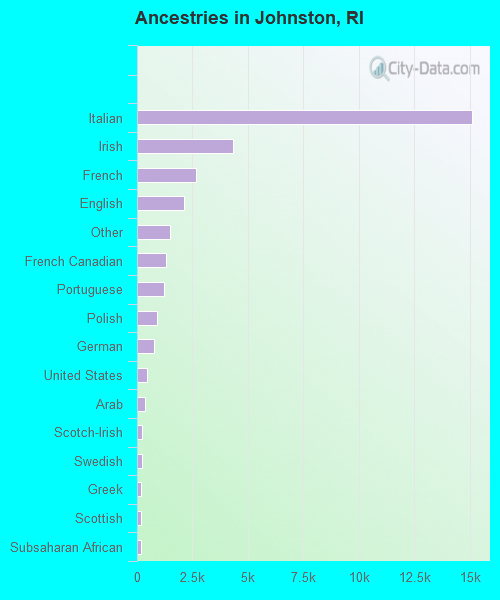
Ancestries in Johnston

- 15,11446.7%Italian
- 4,34213.4%Irish
- 2,6818.3%French
- 2,1186.5%English
- 1,4884.6%Other
- 1,3174.1%French Canadian
- 1,2063.7%Portuguese
- 9162.8%Polish
- 7552.3%German
- 4721.5%United States
- 3501.1%Arab
- 2350.7%Scotch-Irish
- 2090.6%Swedish
- 2000.6%Greek
- 1880.6%Scottish
- 1780.6%Subsaharan African
- 1340.4%Dutch
- 1140.4%Lithuanian
- 920.3%Russian
- 790.2%Ukrainian
- 640.2%Norwegian
- 330.1%Welsh
- 210.06%Slovak
- 110.03%Czech
- 100.03%Swiss
- 80.02%Danish
- 70.02%Hungarian
Zip codes: 02919.