Races in Kalaoa, Hawaii (HI) Detailed Stats
Data:
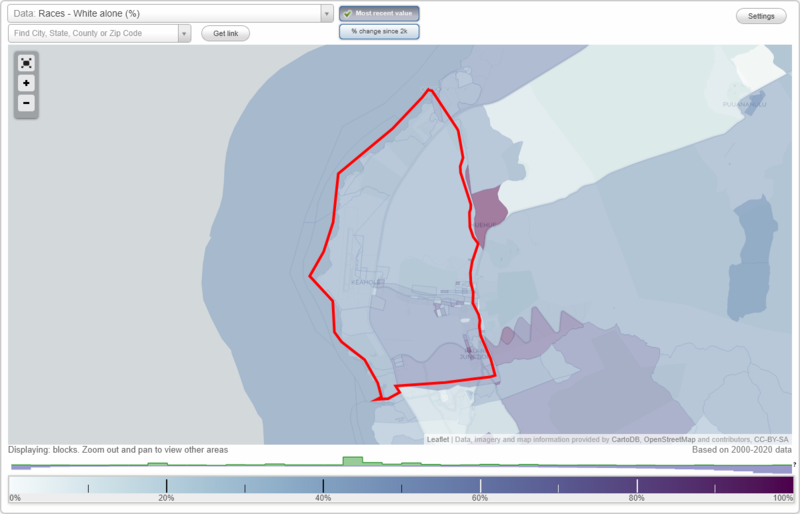
Races - White alone (%)
Races - White alone (% change since 2000)
Races - Black alone (%)
Races - Black alone (% change since 2000)
Races - American Indian alone (%)
Races - American Indian alone (% change since 2000)
Races - Asian alone (%)
Races - Asian alone (% change since 2000)
Races - Hispanic (%)
Races - Hispanic (% change since 2000)
Races - Native Hawaiian and Other Pacific Islander alone (%)
Races - Native Hawaiian and Other Pacific Islander alone (% change since 2000)
Races - Two or more races(%)
Races - Two or more races(% change since 2000)
Races - Other race alone (%)
Races - Other race alone (% change since 2000)
Racial diversity
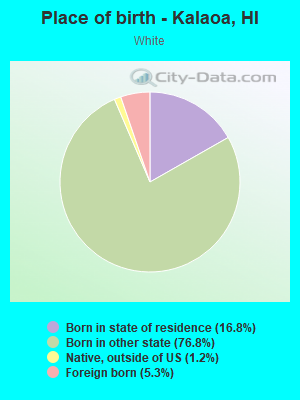
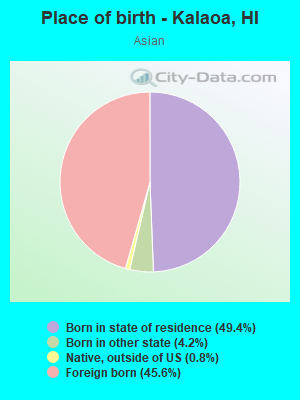
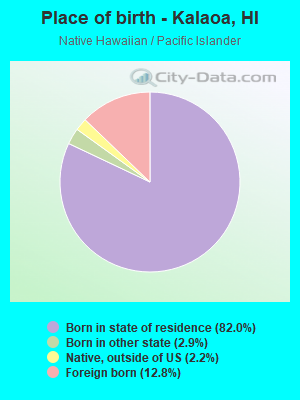
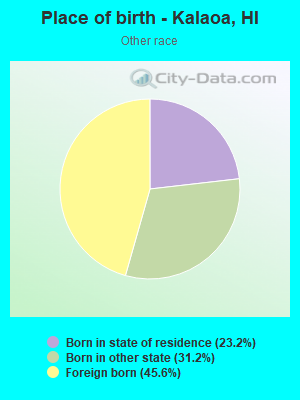
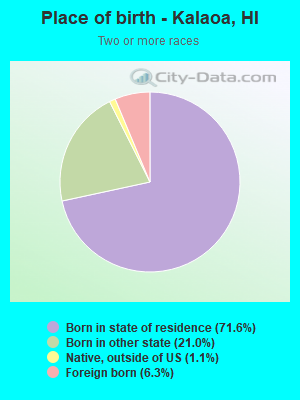
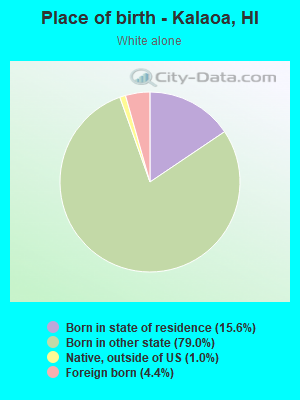
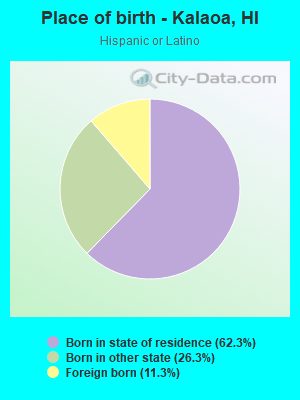
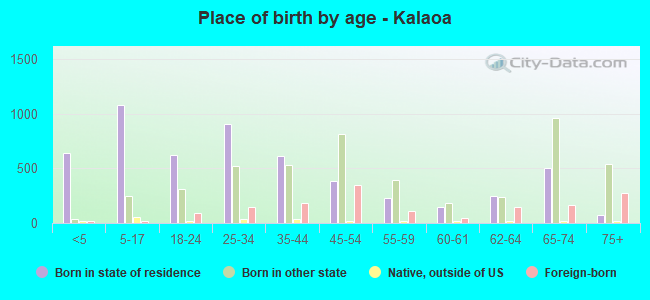
Place of birth - Born in state of residence (%)
Place of birth - Born in state of residence (%) - White
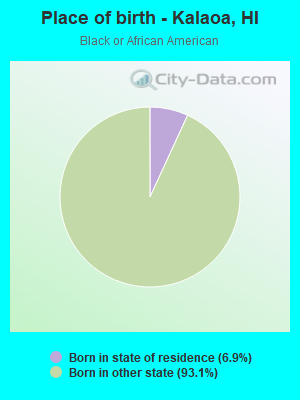
Place of birth - Born in state of residence (%) - Black or African American
Place of birth - Born in state of residence (%) - Asian
Place of birth - Born in state of residence (%) - Hispanic or Latino
Place of birth - Born in state of residence (%) - American Indian and Alaska Native
Place of birth - Born in state of residence (%) - Multirace
Place of birth - Born in state of residence (%) - Other Race
Place of birth - Born in other state (%)
Place of birth - Born in other state (%) - White
Place of birth - Born in other state (%) - Black or African American
Place of birth - Born in other state (%) - Asian
Place of birth - Born in other state (%) - Hispanic or Latino
Place of birth - Born in other state (%) - American Indian and Alaska Native
Place of birth - Born in other state (%) - Multirace
Place of birth - Born in other state (%) - Other Race
Place of birth - Native, outside of US (%)
Place of birth - Native, outside of US (%) - White
Place of birth - Native, outside of US (%) - Black or African American
Place of birth - Native, outside of US (%) - Asian
Place of birth - Native, outside of US (%) - Hispanic or Latino
Place of birth - Native, outside of US (%) - American Indian and Alaska Native
Place of birth - Native, outside of US (%) - Multirace
Place of birth - Native, outside of US (%) - Other Race
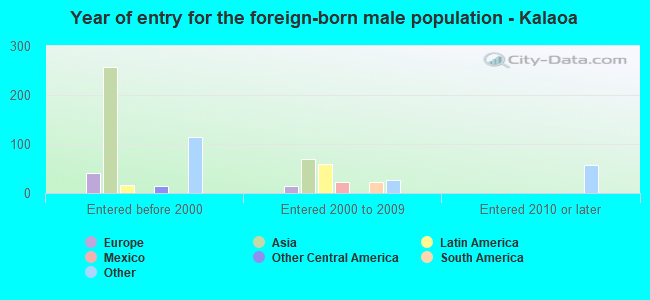
Place of birth - Foreign born (%)
Place of birth - Foreign born (%) - White
Place of birth - Foreign born (%) - Black or African American
Place of birth - Foreign born (%) - Asian
Place of birth - Foreign born (%) - Hispanic or Latino
Place of birth - Foreign born (%) - American Indian and Alaska Native
Place of birth - Foreign born (%) - Multirace
Place of birth - Foreign born (%) - Other Race
Residents speaking English at home (%)
Residents speaking English at home - Born in the United States (%)
Residents speaking English at home - Native, born elsewhere (%)
Residents speaking English at home - Foreign born (%)
Residents speaking Spanish at home (%)
Residents speaking Spanish at home - Born in the United States (%)
Residents speaking Spanish at home - Native, born elsewhere (%)
Residents speaking Spanish at home - Foreign born (%)
Residents speaking other language at home (%)
Residents speaking other language at home - Born in the United States (%)
Residents speaking other language at home - Native, born elsewhere (%)
Residents speaking other language at home - Foreign born (%)
Marital status - Never married (%)
Marital status - Now married (%)
Marital status - Separated (%)
Marital status - Widowed (%)
Marital status - Divorced (%)
Ancestries Reported - Arab (%)
Ancestries Reported - Czech (%)
Ancestries Reported - Danish (%)
Ancestries Reported - Dutch (%)
Ancestries Reported - English (%)
Ancestries Reported - French (%)
Ancestries Reported - French Canadian (%)
Ancestries Reported - German (%)
Ancestries Reported - Greek (%)
Ancestries Reported - Hungarian (%)
Ancestries Reported - Irish (%)
Ancestries Reported - Italian (%)
Ancestries Reported - Lithuanian (%)
Ancestries Reported - Norwegian (%)
Ancestries Reported - Polish (%)
Ancestries Reported - Portuguese (%)
Ancestries Reported - Russian (%)
Ancestries Reported - Scotch-Irish (%)
Ancestries Reported - Scottish (%)
Ancestries Reported - Slovak (%)
Ancestries Reported - Subsaharan African (%)
Ancestries Reported - Swedish (%)
Ancestries Reported - Swiss (%)
Ancestries Reported - Ukrainian (%)
Ancestries Reported - United States (%)
Ancestries Reported - Welsh (%)
Ancestries Reported - West Indian (%)
Ancestries Reported - Other (%)
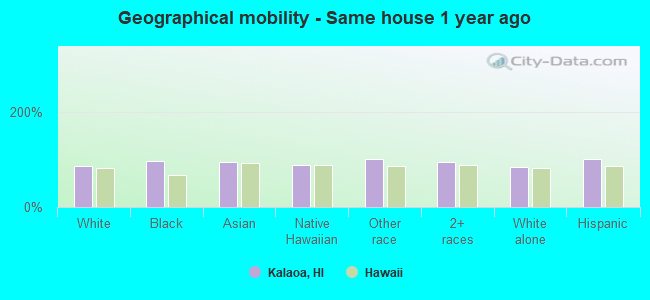
Geographical mobility - Same house 1 year ago (%)
Geographical mobility - Same house 1 year ago (%) - White
Geographical mobility - Same house 1 year ago (%) - Black or African American
Geographical mobility - Same house 1 year ago (%) - Asian
Geographical mobility - Same house 1 year ago (%) - Hispanic or Latino
Geographical mobility - Same house 1 year ago (%) - American Indian and Alaska Native
Geographical mobility - Same house 1 year ago (%) - Multirace
Geographical mobility - Same house 1 year ago (%) - Other Race
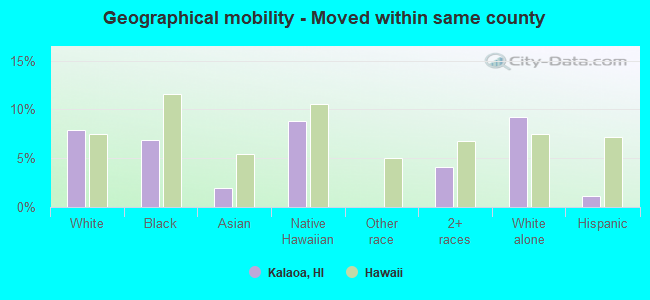
Geographical mobility - Moved within same county (%)
Geographical mobility - Moved within same county (%) - White
Geographical mobility - Moved within same county (%) - Black or African American
Geographical mobility - Moved within same county (%) - Asian
Geographical mobility - Moved within same county (%) - Hispanic or Latino
Geographical mobility - Moved within same county (%) - American Indian and Alaska Native
Geographical mobility - Moved within same county (%) - Multirace
Geographical mobility - Moved within same county (%) - Other Race
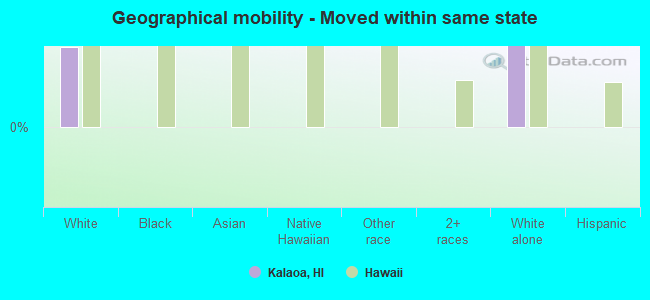
Geographical mobility - Moved from different county within same state (%)
Geographical mobility - Moved from different county within same state (%) - White
Geographical mobility - Moved from different county within same state (%) - Black or African American
Geographical mobility - Moved from different county within same state (%) - Asian
Geographical mobility - Moved from different county within same state (%) - Hispanic or Latino
Geographical mobility - Moved from different county within same state (%) - American Indian and Alaska Native
Geographical mobility - Moved from different county within same state (%) - Multirace
Geographical mobility - Moved from different county within same state (%) - Other Race
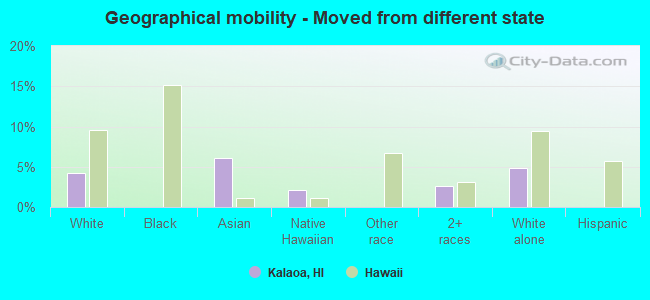
Geographical mobility - Moved from different state (%)
Geographical mobility - Moved from different state (%) - White
Geographical mobility - Moved from different state (%) - Black or African American
Geographical mobility - Moved from different state (%) - Asian
Geographical mobility - Moved from different state (%) - Hispanic or Latino
Geographical mobility - Moved from different state (%) - American Indian and Alaska Native
Geographical mobility - Moved from different state (%) - Multirace
Geographical mobility - Moved from different state (%) - Other Race
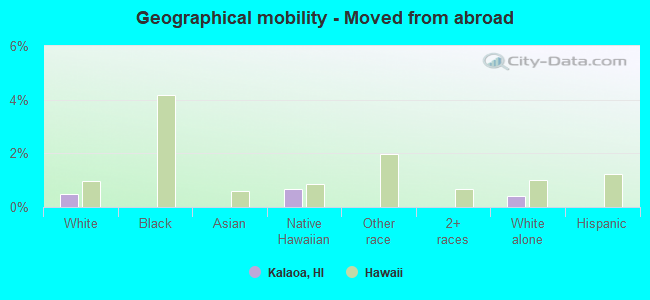
Geographical mobility - Moved from abroad (%)
Geographical mobility - Moved from abroad (%) - White
Geographical mobility - Moved from abroad (%) - Black or African American
Geographical mobility - Moved from abroad (%) - Asian
Geographical mobility - Moved from abroad (%) - Hispanic or Latino
Geographical mobility - Moved from abroad (%) - American Indian and Alaska Native
Geographical mobility - Moved from abroad (%) - Multirace
Geographical mobility - Moved from abroad (%) - Other Race
Place of birth for the foreign-born population - Ireland (%)
Place of birth for the foreign-born population - Denmark (%)
Place of birth for the foreign-born population - Norway (%)
Place of birth for the foreign-born population - Sweden (%)
Place of birth for the foreign-born population - United Kingdom (%)
Place of birth for the foreign-born population - England (%)
Place of birth for the foreign-born population - Scotland (%)
Place of birth for the foreign-born population - Other Northern Europe (%)
Place of birth for the foreign-born population - Austria (%)
Place of birth for the foreign-born population - Belgium (%)
Place of birth for the foreign-born population - France (%)
Place of birth for the foreign-born population - Germany (%)
Place of birth for the foreign-born population - Netherlands (%)
Place of birth for the foreign-born population - Switzerland (%)
Place of birth for the foreign-born population - Other Western Europe (%)
Place of birth for the foreign-born population - Greece (%)
Place of birth for the foreign-born population - Italy (%)
Place of birth for the foreign-born population - Portugal (%)
Place of birth for the foreign-born population - Spain (%)
Place of birth for the foreign-born population - Other Southern Europe (%)
Place of birth for the foreign-born population - Albania (%)
Place of birth for the foreign-born population - Belarus (%)
Place of birth for the foreign-born population - Bosnia and Herzegovina (%)
Place of birth for the foreign-born population - Bulgaria (%)
Place of birth for the foreign-born population - Croatia (%)
Place of birth for the foreign-born population - Czechoslovakia (%)
Place of birth for the foreign-born population - Hungary (%)
Place of birth for the foreign-born population - Latvia (%)
Place of birth for the foreign-born population - Lithuania (%)
Place of birth for the foreign-born population - North Macedonia (Macedonia) (%)
Place of birth for the foreign-born population - Moldova (%)
Place of birth for the foreign-born population - Poland (%)
Place of birth for the foreign-born population - Romania (%)
Place of birth for the foreign-born population - Russia (%)
Place of birth for the foreign-born population - Serbia (%)
Place of birth for the foreign-born population - Ukraine (%)
Place of birth for the foreign-born population - Other Eastern Europe (%)
Place of birth for the foreign-born population - China (%)
Place of birth for the foreign-born population - Hong Kong (%)
Place of birth for the foreign-born population - Taiwan (%)
Place of birth for the foreign-born population - Japan (%)
Place of birth for the foreign-born population - Korea (%)
Place of birth for the foreign-born population - Other Eastern Asia (%)
Place of birth for the foreign-born population - Afghanistan (%)
Place of birth for the foreign-born population - Bangladesh (%)
Place of birth for the foreign-born population - India (%)
Place of birth for the foreign-born population - Iran (%)
Place of birth for the foreign-born population - Kazakhstan (%)
Place of birth for the foreign-born population - Nepal (%)
Place of birth for the foreign-born population - Pakistan (%)
Place of birth for the foreign-born population - Sri Lanka (%)
Place of birth for the foreign-born population - Uzbekistan (%)
Place of birth for the foreign-born population - Other South Central Asia (%)
Place of birth for the foreign-born population - Burma (%)
Place of birth for the foreign-born population - Cambodia (%)
Place of birth for the foreign-born population - Indonesia (%)
Place of birth for the foreign-born population - Laos (%)
Place of birth for the foreign-born population - Malaysia (%)
Place of birth for the foreign-born population - Philippines (%)
Place of birth for the foreign-born population - Singapore (%)
Place of birth for the foreign-born population - Thailand (%)
Place of birth for the foreign-born population - Vietnam (%)
Place of birth for the foreign-born population - Other South Eastern Asia (%)
Place of birth for the foreign-born population - Armenia (%)
Place of birth for the foreign-born population - Iraq (%)
Place of birth for the foreign-born population - Israel (%)
Place of birth for the foreign-born population - Jordan (%)
Place of birth for the foreign-born population - Kuwait (%)
Place of birth for the foreign-born population - Lebanon (%)
Place of birth for the foreign-born population - Saudi Arabia (%)
Place of birth for the foreign-born population - Syria (%)
Place of birth for the foreign-born population - Turkey (%)
Place of birth for the foreign-born population - Yemen (%)
Place of birth for the foreign-born population - Other Western Asia (%)
Place of birth for the foreign-born population - Eritrea (%)
Place of birth for the foreign-born population - Ethiopia (%)
Place of birth for the foreign-born population - Kenya (%)
Place of birth for the foreign-born population - Somalia (%)
Place of birth for the foreign-born population - Uganda (%)
Place of birth for the foreign-born population - Zimbabwe (%)
Place of birth for the foreign-born population - Other Eastern Africa (%)
Place of birth for the foreign-born population - Cameroon (%)
Place of birth for the foreign-born population - Congo (%)
Place of birth for the foreign-born population - Democratic Republic of Congo (Zaire) (%)
Place of birth for the foreign-born population - Other Middle Africa (%)
Place of birth for the foreign-born population - Egypt (%)
Place of birth for the foreign-born population - Morocco (%)
Place of birth for the foreign-born population - Sudan (%)
Place of birth for the foreign-born population - Other Northern Africa (%)
Place of birth for the foreign-born population - South Africa (%)
Place of birth for the foreign-born population - Other Southern Africa (%)
Place of birth for the foreign-born population - Cabo Verde (%)
Place of birth for the foreign-born population - Ghana (%)
Place of birth for the foreign-born population - Liberia (%)
Place of birth for the foreign-born population - Nigeria (%)
Place of birth for the foreign-born population - Senegal (%)
Place of birth for the foreign-born population - Sierra Leone (%)
Place of birth for the foreign-born population - Other Western Africa (%)
Place of birth for the foreign-born population - Australia (%)
Place of birth for the foreign-born population - New Zealand (%)
Place of birth for the foreign-born population - Fiji (%)
Place of birth for the foreign-born population - Micronesia (%)
Place of birth for the foreign-born population - Bahamas (%)
Place of birth for the foreign-born population - Barbados (%)
Place of birth for the foreign-born population - Cuba (%)
Place of birth for the foreign-born population - Dominica (%)
Place of birth for the foreign-born population - Dominican Republic (%)
Place of birth for the foreign-born population - Grenada (%)
Place of birth for the foreign-born population - Haiti (%)
Place of birth for the foreign-born population - Jamaica (%)
Place of birth for the foreign-born population - St. Vincent and the Grenadines (%)
Place of birth for the foreign-born population - Trinidad and Tobago (%)
Place of birth for the foreign-born population - West Indies (%)
Place of birth for the foreign-born population - Other Caribbean (%)
Place of birth for the foreign-born population - Belize (%)
Place of birth for the foreign-born population - Costa Rica (%)
Place of birth for the foreign-born population - El Salvador (%)
Place of birth for the foreign-born population - Guatemala (%)
Place of birth for the foreign-born population - Honduras (%)
Place of birth for the foreign-born population - Mexico (%)
Place of birth for the foreign-born population - Nicaragua (%)
Place of birth for the foreign-born population - Panama (%)
Place of birth for the foreign-born population - Other Central America (%)
Place of birth for the foreign-born population - Argentina (%)
Place of birth for the foreign-born population - Bolivia (%)
Place of birth for the foreign-born population - Brazil (%)
Place of birth for the foreign-born population - Chile (%)
Place of birth for the foreign-born population - Colombia (%)
Place of birth for the foreign-born population - Ecuador (%)
Place of birth for the foreign-born population - Guyana (%)
Place of birth for the foreign-born population - Peru (%)
Place of birth for the foreign-born population - Uruguay (%)
Place of birth for the foreign-born population - Venezuela (%)
Place of birth for the foreign-born population - Other South America (%)
Place of birth for the foreign-born population - Canada (%)
Place of birth for the foreign-born population - Other Northern America (%)
Place of birth for the foreign-born population - Other (%)
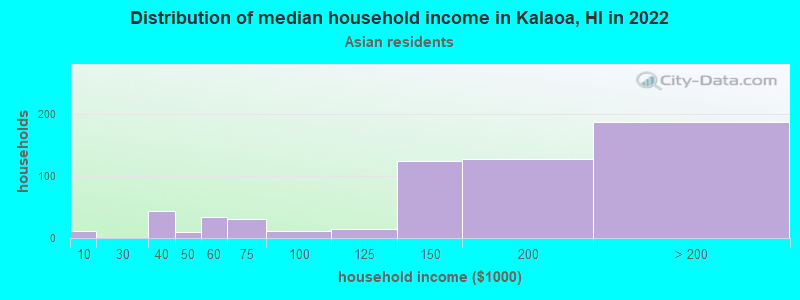
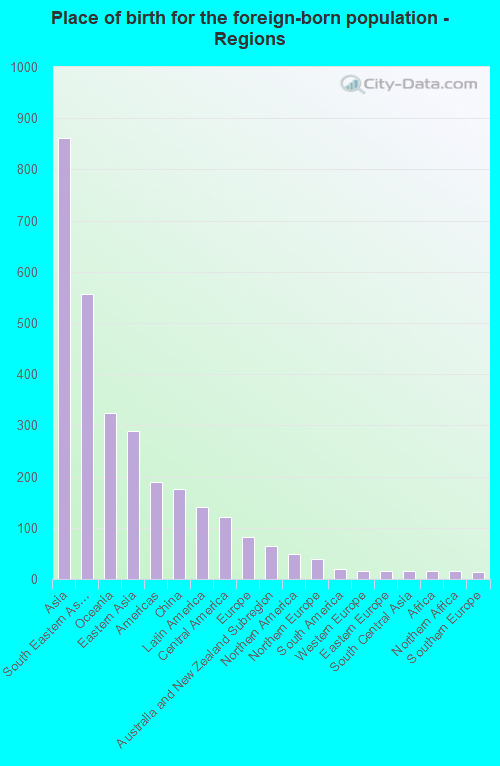
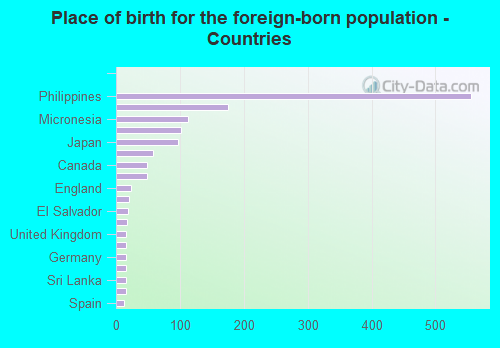
According to 2022 data, the most numerous races in Kalaoa, HI are Asian alone (1,896 residents), Two or more races (2,704 residents), and White alone (4,538 residents). 79.1% of Kalaoa residents speak English at home. 12.2% of Kalaoa, HI residents are foreign-born (7.1% born in Asia, 2.7% born in Oceania), which is 47.4% less than the foreign-born rate of 18.0% across the entire state of Hawaii.
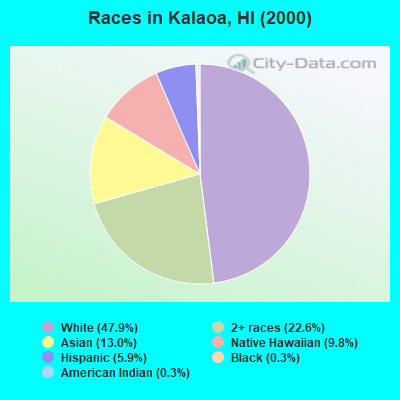
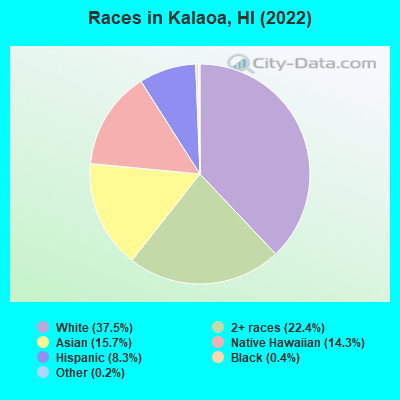
Race distribution in Kalaoa
2000 2022
494,149 40.8% Asian alone 277,091 22.9% White alone 218,700 18.1% Two or more races 108,441 9.0% Native Hawaiian and Other 87,699 7.2% Hispanic 20,829 1.7% Black alone 2,089 0.2% Other race alone 2,539 0.2% American Indian alone
498,125 34.6% Asian alone 318,574 22.1% Two or more races 297,937 20.7% White alone 160,103 11.1% Hispanic 134,567 9.3% Native Hawaiian and Other 23,682 1.6% Black alone 5,378 0.4% Other race alone 1,830 0.1% American Indian alone
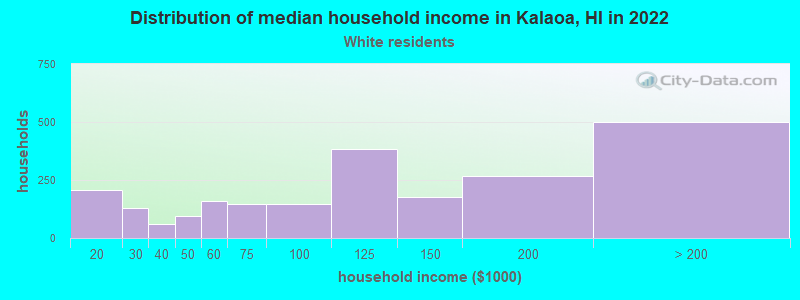
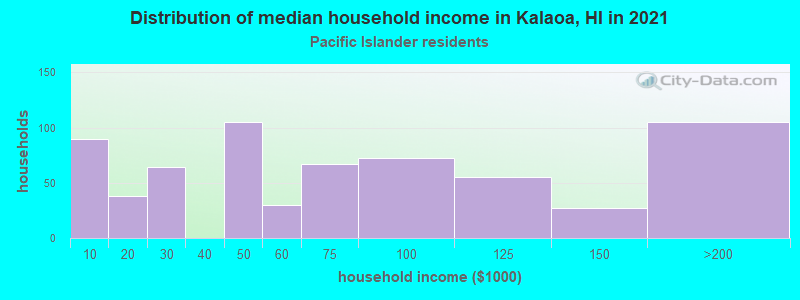
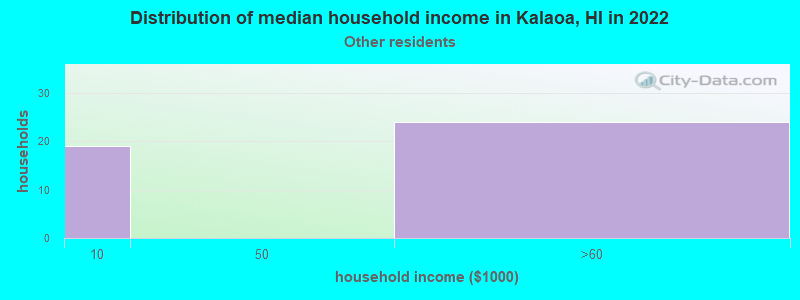
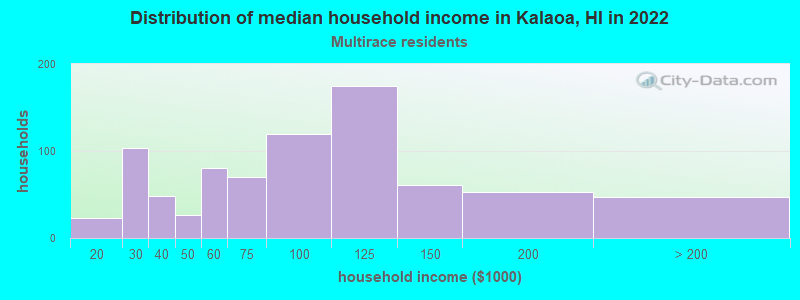
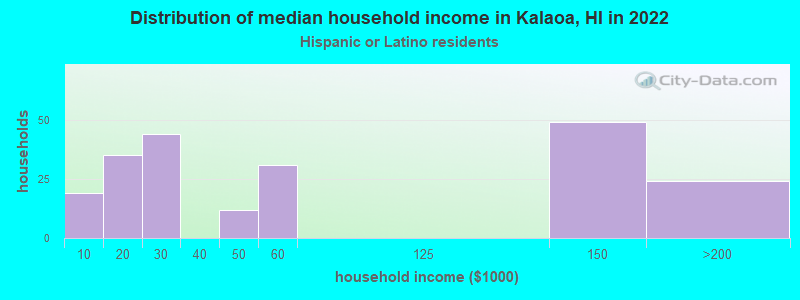
Income and house value in Kalaoa Median household income in 2022 $102,111 White non-Hispanic householders$192,775 Asian householders$64,982 Native Hawaiian and other Pacific Islander householders$123,901 Some other race householders$102,536 Two or more races householders$70,419 Hispanic or Latino race householdersMedian 2022 house value $804,089 White Non-Hispanic householders $848,550 Asian householders$640,720 Native Hawaiian and other Pacific Islander householders$775,482 Some other race householders$838,555 Two or more races householders$797,196 Hispanic or Latino householders
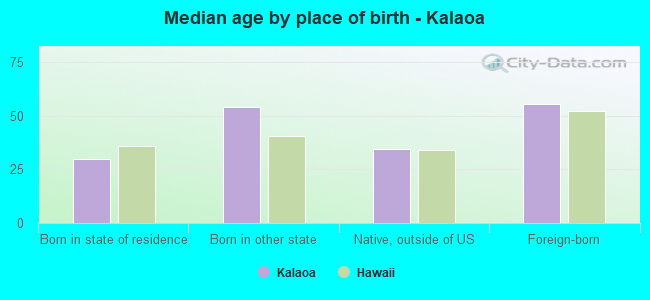
Median age by race in Kalaoa
56.2 Median age for White residents57.5 55.6 91.6 Median age for Black or African American residents44.2 Median age for American Indian / Alaska Native residents52.6 Median age for Asian residents50.3 53.9 36.4 Median age for Native Hawaiian / Pacific Islander residents33.6 37.1 58.8 Median age for Other race residents27.0 Median age for Two or more races residents30.4 21.9 57.0 Median age for White alone residents56.9 57.7 13.6 Median age for Hispanic or Latino residents23.6 8.1
Owner/renter occupied households by race in Kalaoa
House owners and renters - White residents 1,721 76.8% Owner occupied521 23.2% Renter occupiedHouse owners and renters - Black or African American residents 73 100.0% Owner occupiedHouse owners and renters - Asian residents 493 95.9% Owner occupied21 4.1% Renter occupiedHouse owners and renters - Native Hawaiian / Pacific Islander residents 306 49.1% Owner occupied318 50.9% Renter occupiedHouse owners and renters - Other race residents 52 100.0% Renter occupiedHouse owners and renters - Two or more races residents 618 63.6% Owner occupied354 36.4% Renter occupiedHouse owners and renters - White alone residents 1,674 78.2% Owner occupied467 21.8% Renter occupiedHouse owners and renters - Hispanic or Latino residents 72 29.2% Owner occupied175 70.8% Renter occupied
Language usage in Kalaoa
English speakers - Total 79.1% of residents of Kalaoa speak English at home.
3.2% of residents speak Spanish at home 294 82.8% Speak English very well61 17.2% Speak English less than very well18.1% of residents speak other language at home 1,436 70.5% Speak English very well601 29.5% Speak English less than very well
English speakers - Born in the United States 90.0% of residents of Kalaoa speak English at home.
5.0% of residents speak Spanish at home 222 93.7% Speak English very well15 6.3% Speak English less than very well5.1% of residents speak other language at home 223 93.3% Speak English very well16 6.7% Speak English less than very well
English speakers - Native, born elsewhere 95.4% of residents of Kalaoa speak English at home.
10.5% of residents speak other language at home 16 100.0% Speak English very well
English speakers - Foreign-born 31.9% of residents of Kalaoa speak English at home.
6.0% of residents speak Spanish at home 45 51.7% Speak English very well42 48.3% Speak English less than very well63.0% of residents speak other language at home 407 44.4% Speak English very well510 55.6% Speak English less than very well
White (Caucasian) - Speak only English Native:
87.7% (3,831)Foreign-born:
82.7% (204)
White (Caucasian) - Speak another language Native:
12.3% (536)Foreign-born:
23.6% (58)
Asian - Speak only English Native:
75.9% (657)Foreign-born:
9.1% (87)
Asian - Speak another language Native:
23.3% (201)Foreign-born:
89.1% (861)
Native Hawaiian / Pacific Islander - Speak only English Native:
79.0% (1,129)Foreign-born:
19.4% (54)
Native Hawaiian / Pacific Islander - Speak another language Native:
21.4% (305)Foreign-born:
81.1% (224)
Other race - Speak only English Native:
100.0% (89)Foreign-born:
63.5% (46)
Two or more races - Speak only English Native:
63.3% (1,789)Foreign-born:
29.4% (73)
Two or more races - Speak another language Native:
34.6% (977)Foreign-born:
68.4% (169)
White alone - Speak only English Native:
89.6% (3,749)Foreign-born:
89.8% (213)
White alone - Speak another language Native:
10.8% (451)Foreign-born:
9.5% (23)
Hispanic or Latino - Speak only English Native:
60.7% (387)Foreign-born:
23.4% (29)
Hispanic or Latino - Speak another language Native:
39.9% (255)Foreign-born:
84.6% (106)
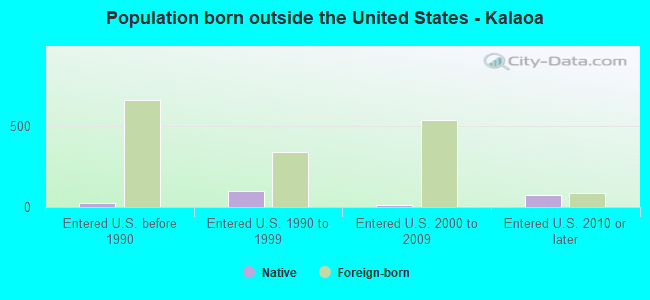
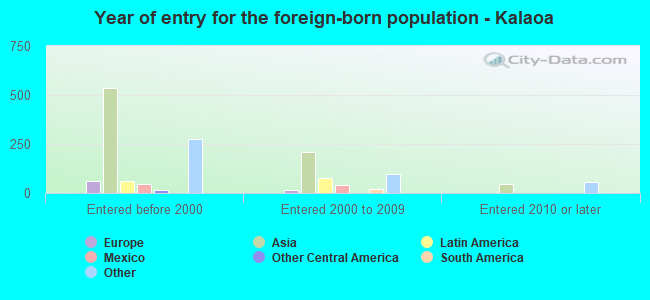
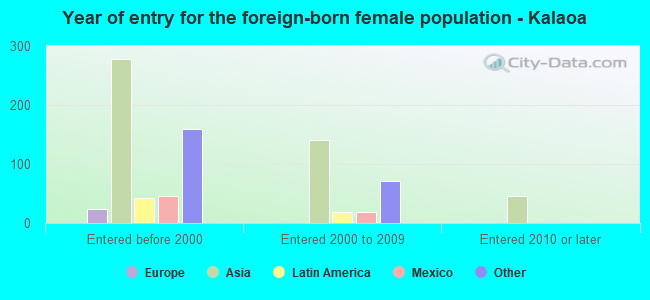
Foreign-born residents in Kalaoa 1,476 residents are foreign born (7.1% Asia , 2.7% Oceania ).
This city:
12.2%Hawaii:
100.0%
Marital status for residents in Kalaoa Marital status - White (Caucasian) population 15 years and over
Males 23.8% Never married61.0% Now married0.8% Separated3.4% Widowed11.0% DivorcedFemales 22.3% Never married55.9% Now married0.7% Separated7.4% Widowed13.7% DivorcedWomen who gave birth in the past 12 months Now married:
52.9% (16)Unmarried:
47.1% (14)
Women who did not give birth in the past 12 months Now married:
50.4% (414)Unmarried:
49.6% (407)
Marital status - Black or African American population 15 years and over
Males 100.0% Never married0.0% Now married0.0% Separated0.0% Widowed0.0% DivorcedFemales 16.7% Never married83.3% Now married0.0% Separated0.0% Widowed0.0% DivorcedWomen who did not give birth in the past 12 months Now married:
100.0% (25)Unmarried:
0.0% (0)
Marital status - Asian population 15 years and over
Males 21.0% Never married76.7% Now married0.0% Separated0.0% Widowed2.3% DivorcedFemales 24.0% Never married53.5% Now married8.6% Separated8.0% Widowed6.0% DivorcedWomen who did not give birth in the past 12 months Now married:
28.8% (123)Unmarried:
71.2% (304)
Marital status - Native Hawaiian / Pacific Islander population 15 years and over
Males 40.3% Never married48.5% Now married0.0% Separated0.0% Widowed11.2% DivorcedFemales 35.6% Never married55.1% Now married0.0% Separated3.9% Widowed5.4% DivorcedWomen who gave birth in the past 12 months Now married:
100.0% (48)Unmarried:
0.0% (0)
Women who did not give birth in the past 12 months Now married:
40.6% (182)Unmarried:
59.4% (266)
Marital status - Two or more races population 15 years and over
Males 59.4% Never married33.6% Now married1.8% Separated0.0% Widowed5.1% DivorcedFemales 35.3% Never married57.1% Now married0.0% Separated0.8% Widowed6.8% DivorcedWomen who gave birth in the past 12 months Now married:
100.0% (26)Unmarried:
0.0% (0)
Women who did not give birth in the past 12 months Now married:
47.3% (395)Unmarried:
52.7% (440)
Marital status - White alone, not Hispanic / Latino population 15 years and over
Males 22.4% Never married61.9% Now married0.8% Separated3.5% Widowed11.4% DivorcedFemales 21.7% Never married55.2% Now married0.8% Separated7.9% Widowed14.5% DivorcedWomen who gave birth in the past 12 months Now married:
52.9% (17)Unmarried:
47.1% (15)
Women who did not give birth in the past 12 months Now married:
48.9% (376)Unmarried:
51.1% (393)
Marital status - Hispanic or Latino population 15 years and over
Males 46.1% Never married46.8% Now married0.0% Separated0.0% Widowed7.2% DivorcedFemales 26.1% Never married73.9% Now married0.0% Separated0.0% Widowed0.0% DivorcedWomen who did not give birth in the past 12 months Now married:
70.8% (108)Unmarried:
29.2% (45)
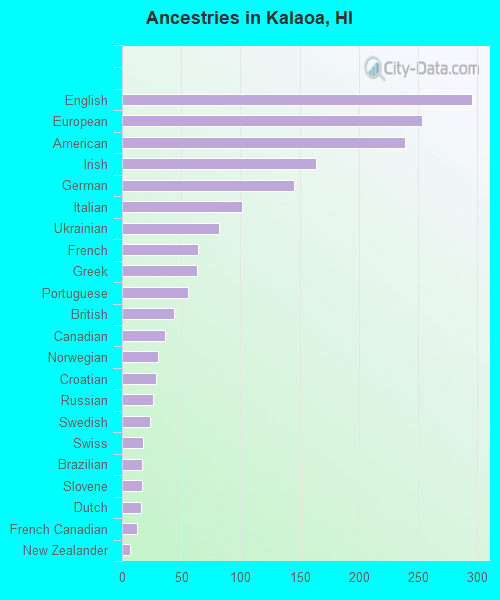
Ancestries in Kalaoa
295 5.4% English253 4.6% European239 4.4% American164 3.0% Irish145 2.6% German101 1.8% Italian82 1.5% Ukrainian64 1.2% French63 1.1% Greek56 1.0% Portuguese44 0.8% British36 0.7% Canadian30 0.5% Norwegian29 0.5% Croatian26 0.5% Russian24 0.4% Swedish18 0.3% Swiss17 0.3% Brazilian17 0.3% Slovene16 0.3% Dutch13 0.2% French Canadian7 0.1% New Zealander
Geographical mobility in Kalaoa Same house 1 year ago 3,903 86.1% White (Caucasian)71 97.5% Black or African American1,717 94.4% Asian1,420 86.9% Native Hawaiian / Pacific Islander176 100.0% Other race3,163 93.8% Two or more races3,816 84.2% White alone, not Hispanic / Latino992 100.0% Hispanic or LatinoMoved within same county 358 7.9% White / Caucasian5 6.9% Black or African American36 2.0% Asian144 8.8% Native Hawaiian / Pacific Islander139 4.1% Two or more races419 9.2% White alone, not Hispanic / Latino11 1.2% Hispanic or LatinoMoved within same state 22 0.5% White / Caucasian23 0.5% White alone, not Hispanic / LatinoMoved from different state 193 4.2% White / Caucasian110 6.1% Asian35 2.2% Native Hawaiian / Pacific Islander87 2.6% Two or more races218 4.8% White alone, not Hispanic / LatinoMoved from abroad 23 0.5% White11 0.7% Native Hawaiian / Pacific Islander18 0.4% White alone, not Hispanic / Latino
Children Nativity (place of birth) in Kalaoa
Children under 6 years - Living with two parents Both parents native 323 100.0% NativeOne native, one foreign-born parent 55 100.0% NativeChildren under 6 years - Living with one parent Native parent 327 100.0% NativeChildren 6 to 17 years - Living with two parents Both parents native 432 100.0% NativeBoth parents foreign-born 89 83.8% Native17 16.2% Foreign-bornOne native, one foreign-born parent 202 100.0% NativeChildren 6 to 17 years - Living with one parent Native parent 617 100.0% NativeForeign-born parent 31 50.6% Native30 49.4% Foreign-born
Grandparents responsible for own grandchildren in Kalaoa
Grandparents (30 to 59 years) Asian 9 100.0% Not responsible for grandchildrenNative Hawaiian / Pacific Islander 22 36.9% Responsible for grandchildren38 63.1% Not responsible for grandchildrenTwo or more races 6 39.5% Responsible for grandchildren9 60.5% Not responsible for grandchildrenGrandparents (60 years and over) Asian 65 54.7% Responsible for grandchildren54 45.3% Not responsible for grandchildrenNative Hawaiian / Pacific Islander 56 100.0% Not responsible for grandchildrenTwo or more races 6 37.3% Responsible for grandchildren10 62.7% Not responsible for grandchildren