Races in Kansas City, Kansas (KS) Detailed Stats
Data:
Races - White alone (%)
Races - White alone (% change since 2000)
Races - Black alone (%)
Races - Black alone (% change since 2000)
Races - American Indian alone (%)
Races - American Indian alone (% change since 2000)
Races - Asian alone (%)
Races - Asian alone (% change since 2000)
Races - Hispanic (%)
Races - Hispanic (% change since 2000)
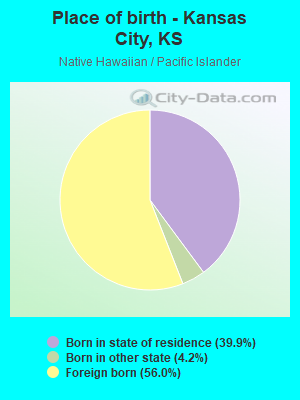
Races - Native Hawaiian and Other Pacific Islander alone (%)
Races - Native Hawaiian and Other Pacific Islander alone (% change since 2000)
Races - Two or more races(%)
Races - Two or more races(% change since 2000)
Races - Other race alone (%)
Races - Other race alone (% change since 2000)
Racial diversity
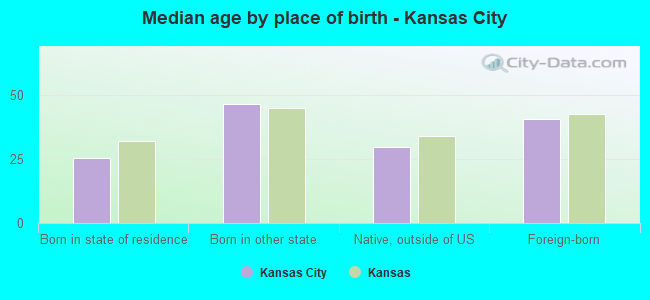
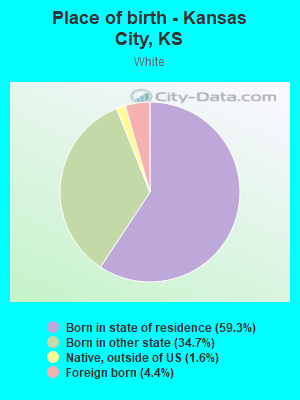
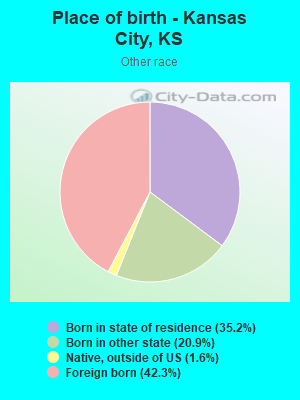
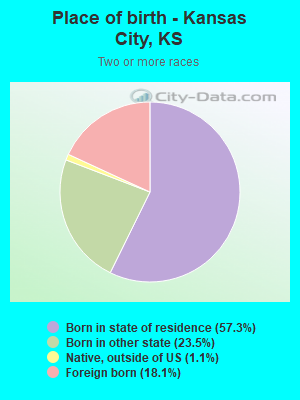
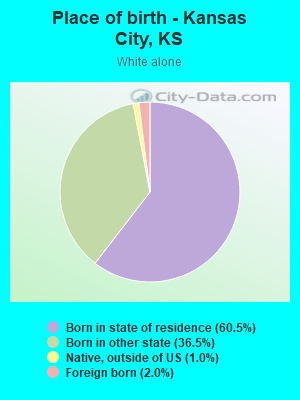
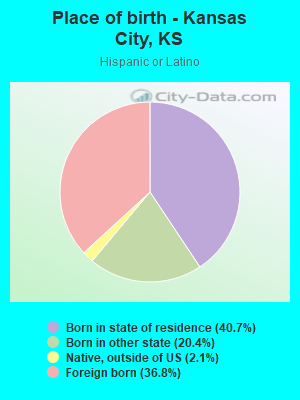
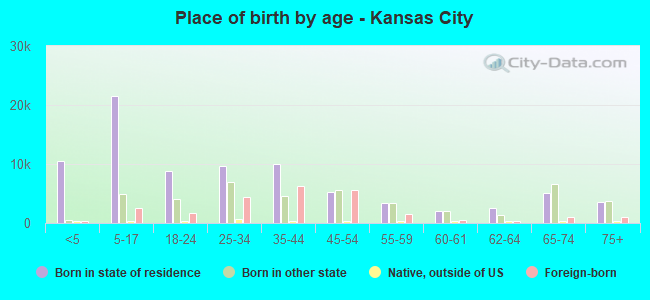
Place of birth - Born in state of residence (%)
Place of birth - Born in state of residence (%) - White
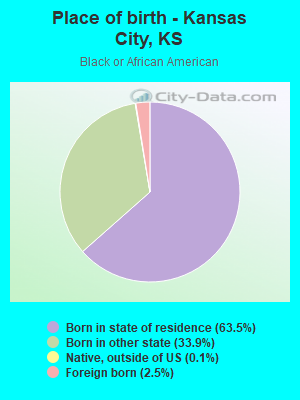
Place of birth - Born in state of residence (%) - Black or African American
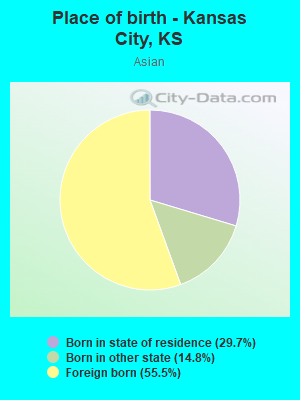
Place of birth - Born in state of residence (%) - Asian
Place of birth - Born in state of residence (%) - Hispanic or Latino
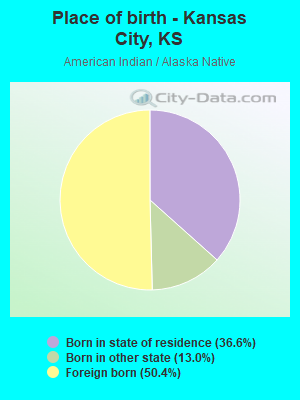
Place of birth - Born in state of residence (%) - American Indian and Alaska Native
Place of birth - Born in state of residence (%) - Multirace
Place of birth - Born in state of residence (%) - Other Race
Place of birth - Born in other state (%)
Place of birth - Born in other state (%) - White
Place of birth - Born in other state (%) - Black or African American
Place of birth - Born in other state (%) - Asian
Place of birth - Born in other state (%) - Hispanic or Latino
Place of birth - Born in other state (%) - American Indian and Alaska Native
Place of birth - Born in other state (%) - Multirace
Place of birth - Born in other state (%) - Other Race
Place of birth - Native, outside of US (%)
Place of birth - Native, outside of US (%) - White
Place of birth - Native, outside of US (%) - Black or African American
Place of birth - Native, outside of US (%) - Asian
Place of birth - Native, outside of US (%) - Hispanic or Latino
Place of birth - Native, outside of US (%) - American Indian and Alaska Native
Place of birth - Native, outside of US (%) - Multirace
Place of birth - Native, outside of US (%) - Other Race
Place of birth - Foreign born (%)
Place of birth - Foreign born (%) - White
Place of birth - Foreign born (%) - Black or African American
Place of birth - Foreign born (%) - Asian
Place of birth - Foreign born (%) - Hispanic or Latino
Place of birth - Foreign born (%) - American Indian and Alaska Native
Place of birth - Foreign born (%) - Multirace
Place of birth - Foreign born (%) - Other Race
Residents speaking English at home (%)
Residents speaking English at home - Born in the United States (%)
Residents speaking English at home - Native, born elsewhere (%)
Residents speaking English at home - Foreign born (%)
Residents speaking Spanish at home (%)
Residents speaking Spanish at home - Born in the United States (%)
Residents speaking Spanish at home - Native, born elsewhere (%)
Residents speaking Spanish at home - Foreign born (%)
Residents speaking other language at home (%)
Residents speaking other language at home - Born in the United States (%)
Residents speaking other language at home - Native, born elsewhere (%)
Residents speaking other language at home - Foreign born (%)
Marital status - Never married (%)
Marital status - Now married (%)
Marital status - Separated (%)
Marital status - Widowed (%)
Marital status - Divorced (%)
Ancestries Reported - Arab (%)
Ancestries Reported - Czech (%)
Ancestries Reported - Danish (%)
Ancestries Reported - Dutch (%)
Ancestries Reported - English (%)
Ancestries Reported - French (%)
Ancestries Reported - French Canadian (%)
Ancestries Reported - German (%)
Ancestries Reported - Greek (%)
Ancestries Reported - Hungarian (%)
Ancestries Reported - Irish (%)
Ancestries Reported - Italian (%)
Ancestries Reported - Lithuanian (%)
Ancestries Reported - Norwegian (%)
Ancestries Reported - Polish (%)
Ancestries Reported - Portuguese (%)
Ancestries Reported - Russian (%)
Ancestries Reported - Scotch-Irish (%)
Ancestries Reported - Scottish (%)
Ancestries Reported - Slovak (%)
Ancestries Reported - Subsaharan African (%)
Ancestries Reported - Swedish (%)
Ancestries Reported - Swiss (%)
Ancestries Reported - Ukrainian (%)
Ancestries Reported - United States (%)
Ancestries Reported - Welsh (%)
Ancestries Reported - West Indian (%)
Ancestries Reported - Other (%)
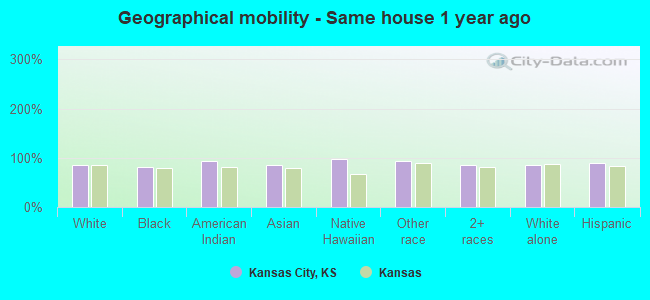
Geographical mobility - Same house 1 year ago (%)
Geographical mobility - Same house 1 year ago (%) - White
Geographical mobility - Same house 1 year ago (%) - Black or African American
Geographical mobility - Same house 1 year ago (%) - Asian
Geographical mobility - Same house 1 year ago (%) - Hispanic or Latino
Geographical mobility - Same house 1 year ago (%) - American Indian and Alaska Native
Geographical mobility - Same house 1 year ago (%) - Multirace
Geographical mobility - Same house 1 year ago (%) - Other Race
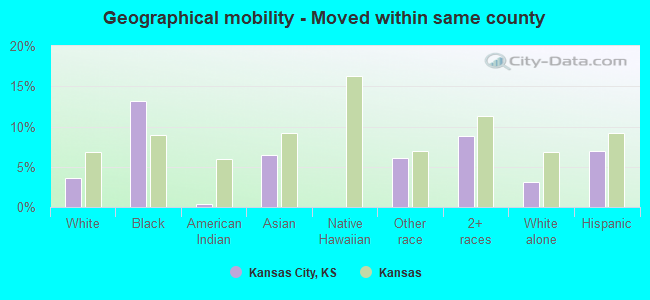
Geographical mobility - Moved within same county (%)
Geographical mobility - Moved within same county (%) - White
Geographical mobility - Moved within same county (%) - Black or African American
Geographical mobility - Moved within same county (%) - Asian
Geographical mobility - Moved within same county (%) - Hispanic or Latino
Geographical mobility - Moved within same county (%) - American Indian and Alaska Native
Geographical mobility - Moved within same county (%) - Multirace
Geographical mobility - Moved within same county (%) - Other Race
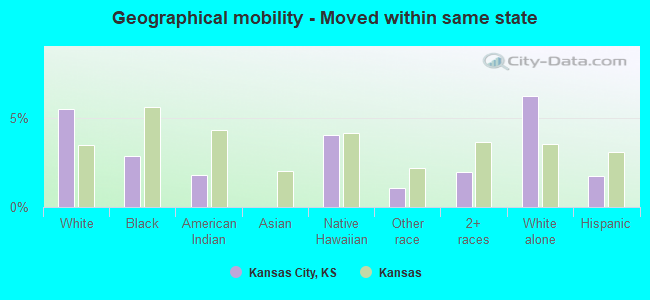
Geographical mobility - Moved from different county within same state (%)
Geographical mobility - Moved from different county within same state (%) - White
Geographical mobility - Moved from different county within same state (%) - Black or African American
Geographical mobility - Moved from different county within same state (%) - Asian
Geographical mobility - Moved from different county within same state (%) - Hispanic or Latino
Geographical mobility - Moved from different county within same state (%) - American Indian and Alaska Native
Geographical mobility - Moved from different county within same state (%) - Multirace
Geographical mobility - Moved from different county within same state (%) - Other Race
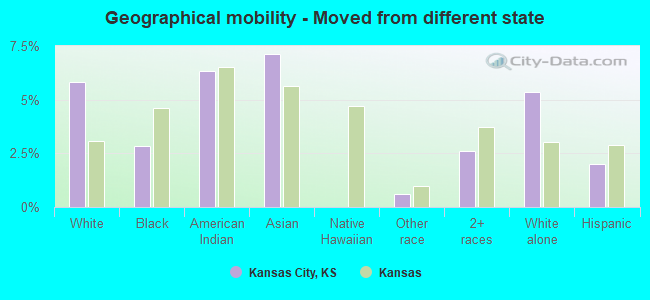
Geographical mobility - Moved from different state (%)
Geographical mobility - Moved from different state (%) - White
Geographical mobility - Moved from different state (%) - Black or African American
Geographical mobility - Moved from different state (%) - Asian
Geographical mobility - Moved from different state (%) - Hispanic or Latino
Geographical mobility - Moved from different state (%) - American Indian and Alaska Native
Geographical mobility - Moved from different state (%) - Multirace
Geographical mobility - Moved from different state (%) - Other Race
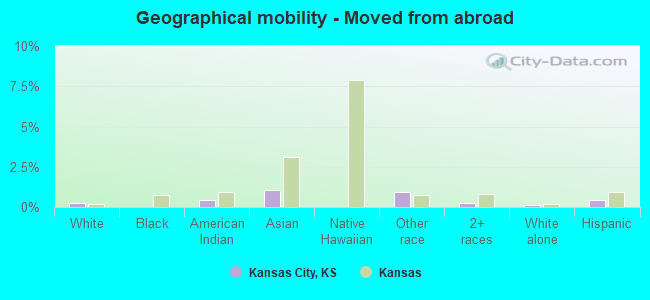
Geographical mobility - Moved from abroad (%)
Geographical mobility - Moved from abroad (%) - White
Geographical mobility - Moved from abroad (%) - Black or African American
Geographical mobility - Moved from abroad (%) - Asian
Geographical mobility - Moved from abroad (%) - Hispanic or Latino
Geographical mobility - Moved from abroad (%) - American Indian and Alaska Native
Geographical mobility - Moved from abroad (%) - Multirace
Geographical mobility - Moved from abroad (%) - Other Race
Place of birth for the foreign-born population - Ireland (%)
Place of birth for the foreign-born population - Denmark (%)
Place of birth for the foreign-born population - Norway (%)
Place of birth for the foreign-born population - Sweden (%)
Place of birth for the foreign-born population - United Kingdom (%)
Place of birth for the foreign-born population - England (%)
Place of birth for the foreign-born population - Scotland (%)
Place of birth for the foreign-born population - Other Northern Europe (%)
Place of birth for the foreign-born population - Austria (%)
Place of birth for the foreign-born population - Belgium (%)
Place of birth for the foreign-born population - France (%)
Place of birth for the foreign-born population - Germany (%)
Place of birth for the foreign-born population - Netherlands (%)
Place of birth for the foreign-born population - Switzerland (%)
Place of birth for the foreign-born population - Other Western Europe (%)
Place of birth for the foreign-born population - Greece (%)
Place of birth for the foreign-born population - Italy (%)
Place of birth for the foreign-born population - Portugal (%)
Place of birth for the foreign-born population - Spain (%)
Place of birth for the foreign-born population - Other Southern Europe (%)
Place of birth for the foreign-born population - Albania (%)
Place of birth for the foreign-born population - Belarus (%)
Place of birth for the foreign-born population - Bosnia and Herzegovina (%)
Place of birth for the foreign-born population - Bulgaria (%)
Place of birth for the foreign-born population - Croatia (%)
Place of birth for the foreign-born population - Czechoslovakia (%)
Place of birth for the foreign-born population - Hungary (%)
Place of birth for the foreign-born population - Latvia (%)
Place of birth for the foreign-born population - Lithuania (%)
Place of birth for the foreign-born population - North Macedonia (Macedonia) (%)
Place of birth for the foreign-born population - Moldova (%)
Place of birth for the foreign-born population - Poland (%)
Place of birth for the foreign-born population - Romania (%)
Place of birth for the foreign-born population - Russia (%)
Place of birth for the foreign-born population - Serbia (%)
Place of birth for the foreign-born population - Ukraine (%)
Place of birth for the foreign-born population - Other Eastern Europe (%)
Place of birth for the foreign-born population - China (%)
Place of birth for the foreign-born population - Hong Kong (%)
Place of birth for the foreign-born population - Taiwan (%)
Place of birth for the foreign-born population - Japan (%)
Place of birth for the foreign-born population - Korea (%)
Place of birth for the foreign-born population - Other Eastern Asia (%)
Place of birth for the foreign-born population - Afghanistan (%)
Place of birth for the foreign-born population - Bangladesh (%)
Place of birth for the foreign-born population - India (%)
Place of birth for the foreign-born population - Iran (%)
Place of birth for the foreign-born population - Kazakhstan (%)
Place of birth for the foreign-born population - Nepal (%)
Place of birth for the foreign-born population - Pakistan (%)
Place of birth for the foreign-born population - Sri Lanka (%)
Place of birth for the foreign-born population - Uzbekistan (%)
Place of birth for the foreign-born population - Other South Central Asia (%)
Place of birth for the foreign-born population - Burma (%)
Place of birth for the foreign-born population - Cambodia (%)
Place of birth for the foreign-born population - Indonesia (%)
Place of birth for the foreign-born population - Laos (%)
Place of birth for the foreign-born population - Malaysia (%)
Place of birth for the foreign-born population - Philippines (%)
Place of birth for the foreign-born population - Singapore (%)
Place of birth for the foreign-born population - Thailand (%)
Place of birth for the foreign-born population - Vietnam (%)
Place of birth for the foreign-born population - Other South Eastern Asia (%)
Place of birth for the foreign-born population - Armenia (%)
Place of birth for the foreign-born population - Iraq (%)
Place of birth for the foreign-born population - Israel (%)
Place of birth for the foreign-born population - Jordan (%)
Place of birth for the foreign-born population - Kuwait (%)
Place of birth for the foreign-born population - Lebanon (%)
Place of birth for the foreign-born population - Saudi Arabia (%)
Place of birth for the foreign-born population - Syria (%)
Place of birth for the foreign-born population - Turkey (%)
Place of birth for the foreign-born population - Yemen (%)
Place of birth for the foreign-born population - Other Western Asia (%)
Place of birth for the foreign-born population - Eritrea (%)
Place of birth for the foreign-born population - Ethiopia (%)
Place of birth for the foreign-born population - Kenya (%)
Place of birth for the foreign-born population - Somalia (%)
Place of birth for the foreign-born population - Uganda (%)
Place of birth for the foreign-born population - Zimbabwe (%)
Place of birth for the foreign-born population - Other Eastern Africa (%)
Place of birth for the foreign-born population - Cameroon (%)
Place of birth for the foreign-born population - Congo (%)
Place of birth for the foreign-born population - Democratic Republic of Congo (Zaire) (%)
Place of birth for the foreign-born population - Other Middle Africa (%)
Place of birth for the foreign-born population - Egypt (%)
Place of birth for the foreign-born population - Morocco (%)
Place of birth for the foreign-born population - Sudan (%)
Place of birth for the foreign-born population - Other Northern Africa (%)
Place of birth for the foreign-born population - South Africa (%)
Place of birth for the foreign-born population - Other Southern Africa (%)
Place of birth for the foreign-born population - Cabo Verde (%)
Place of birth for the foreign-born population - Ghana (%)
Place of birth for the foreign-born population - Liberia (%)
Place of birth for the foreign-born population - Nigeria (%)
Place of birth for the foreign-born population - Senegal (%)
Place of birth for the foreign-born population - Sierra Leone (%)
Place of birth for the foreign-born population - Other Western Africa (%)
Place of birth for the foreign-born population - Australia (%)
Place of birth for the foreign-born population - New Zealand (%)
Place of birth for the foreign-born population - Fiji (%)
Place of birth for the foreign-born population - Micronesia (%)
Place of birth for the foreign-born population - Bahamas (%)
Place of birth for the foreign-born population - Barbados (%)
Place of birth for the foreign-born population - Cuba (%)
Place of birth for the foreign-born population - Dominica (%)
Place of birth for the foreign-born population - Dominican Republic (%)
Place of birth for the foreign-born population - Grenada (%)
Place of birth for the foreign-born population - Haiti (%)
Place of birth for the foreign-born population - Jamaica (%)
Place of birth for the foreign-born population - St. Vincent and the Grenadines (%)
Place of birth for the foreign-born population - Trinidad and Tobago (%)
Place of birth for the foreign-born population - West Indies (%)
Place of birth for the foreign-born population - Other Caribbean (%)
Place of birth for the foreign-born population - Belize (%)
Place of birth for the foreign-born population - Costa Rica (%)
Place of birth for the foreign-born population - El Salvador (%)
Place of birth for the foreign-born population - Guatemala (%)
Place of birth for the foreign-born population - Honduras (%)
Place of birth for the foreign-born population - Mexico (%)
Place of birth for the foreign-born population - Nicaragua (%)
Place of birth for the foreign-born population - Panama (%)
Place of birth for the foreign-born population - Other Central America (%)
Place of birth for the foreign-born population - Argentina (%)
Place of birth for the foreign-born population - Bolivia (%)
Place of birth for the foreign-born population - Brazil (%)
Place of birth for the foreign-born population - Chile (%)
Place of birth for the foreign-born population - Colombia (%)
Place of birth for the foreign-born population - Ecuador (%)
Place of birth for the foreign-born population - Guyana (%)
Place of birth for the foreign-born population - Peru (%)
Place of birth for the foreign-born population - Uruguay (%)
Place of birth for the foreign-born population - Venezuela (%)
Place of birth for the foreign-born population - Other South America (%)
Place of birth for the foreign-born population - Canada (%)
Place of birth for the foreign-born population - Other Northern America (%)
Place of birth for the foreign-born population - Other (%)
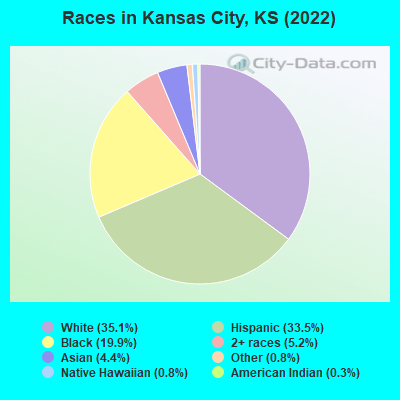
According to 2022 data, the most numerous races in Kansas City, KS are White alone (53,492 residents), Hispanic (51,090 residents), and Black alone (30,351 residents). 68.5% of Kansas City residents speak English at home. 18.3% of Kansas City, KS residents are foreign-born (12.9% born in Latin America, 3.3% born in Asia), which is 61.7% greater than the foreign-born rate of 7.0% across the entire state of Kansas.
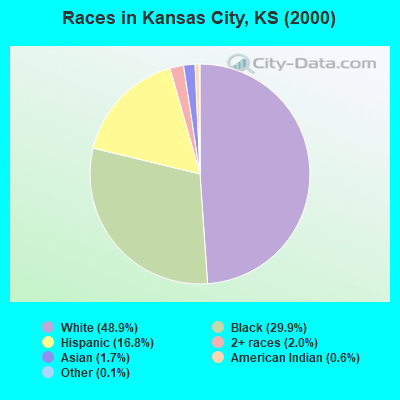
Race distribution in Kansas City
2000 2022
71,870 48.9% White alone 43,865 29.9% Black alone 24,639 16.8% Hispanic 2,934 2.0% Two or more races 2,477 1.7% Asian alone 830 0.6% American Indian alone 212 0.1% Other race alone 39 0.03% Native Hawaiian and Other
53,492 35.1% White alone 51,090 33.5% Hispanic 30,351 19.9% Black alone 7,935 5.2% Two or more races 6,679 4.4% Asian alone 1,262 0.8% Other race alone 1,256 0.8% Native Hawaiian and Other 496 0.3% American Indian alone
2000 2022
2,233,997 83.1% White alone 188,252 7.0% Hispanic 151,407 5.6% Black alone 46,301 1.7% Asian alone 42,508 1.6% Two or more races 22,322 0.8% American Indian alone 2,477 0.09% Other race alone 1,154 0.04% Native Hawaiian and Other
2,147,943 73.1% White alone 381,746 13.0% Hispanic 147,666 5.0% Black alone 145,362 4.9% Two or more races 85,085 2.9% Asian alone 13,263 0.5% Other race alone 12,065 0.4% American Indian alone 4,020 0.1% Native Hawaiian and Other
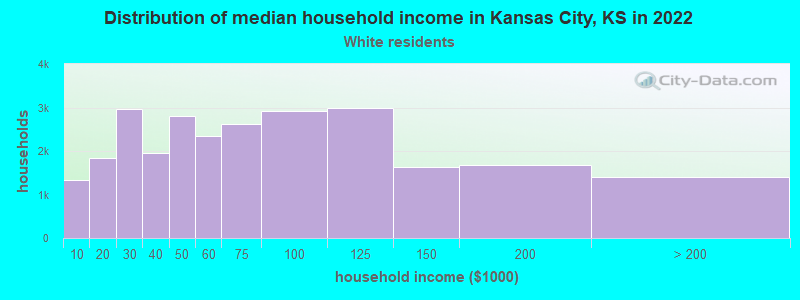
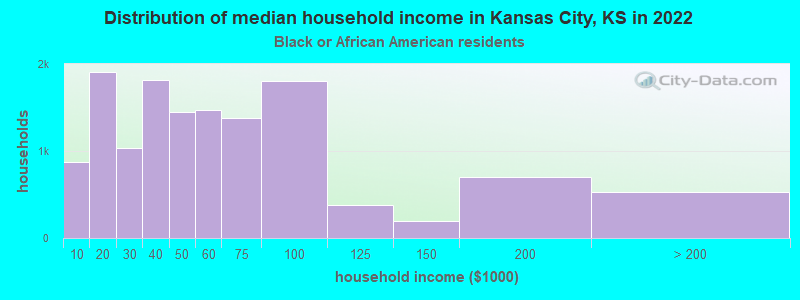
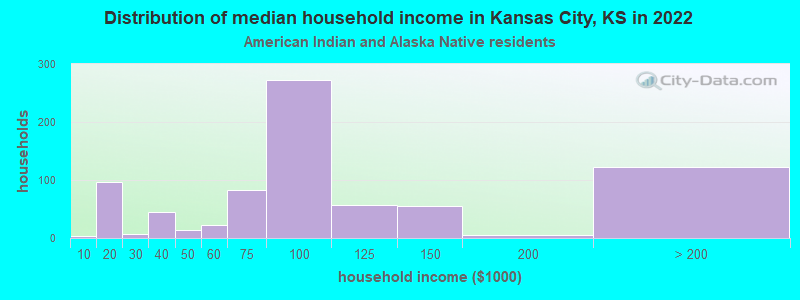
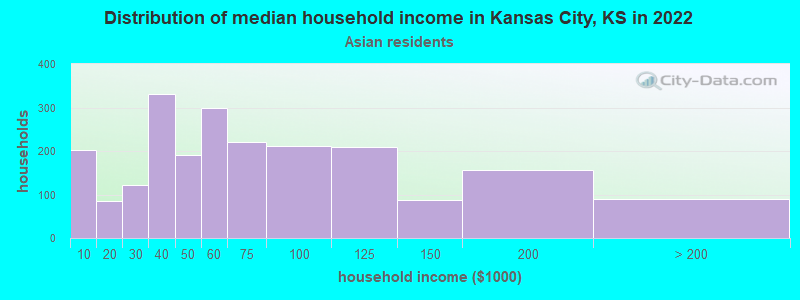
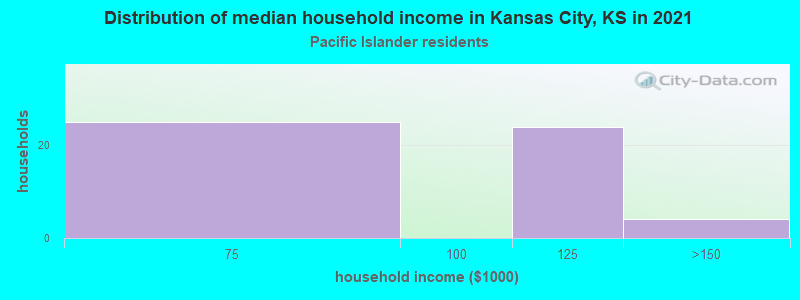
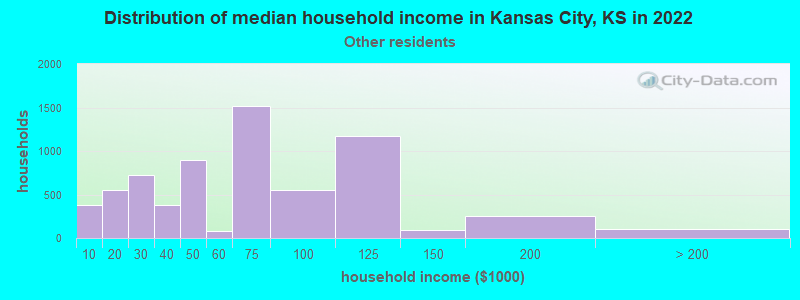
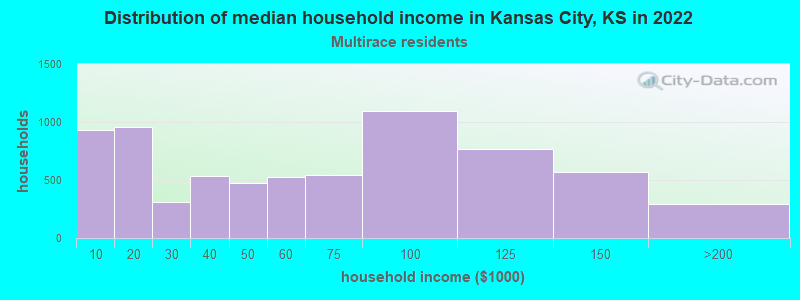
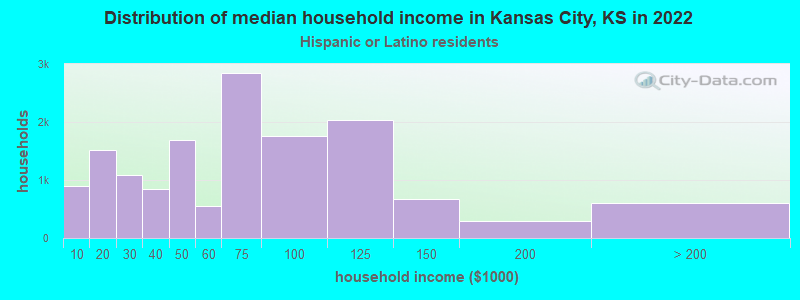
Income and house value in Kansas City Median household income in 2022 $60,168 White non-Hispanic householders$47,192 Black householders$102,568 American Indian and Alaska Native householders$67,690 Asian householders$66,243 Some other race householders$54,947 Two or more races householders$64,869 Hispanic or Latino race householdersMedian 2022 house value $183,757 White Non-Hispanic householders$151,329 Black or African American householders$131,676 American Indian or Alaska Native householders $163,776 Asian householders$311,175 Native Hawaiian and other Pacific Islander householders$129,710 Some other race householders$168,034 Two or more races householders$140,520 Hispanic or Latino householders
Median age by race in Kansas City
40.0 Median age for White residents40.2 39.8 35.9 Median age for Black or African American residents32.5 37.7 35.6 Median age for American Indian / Alaska Native residents35.7 31.8 32.2 Median age for Asian residents32.9 30.9 13.5 Median age for Native Hawaiian / Pacific Islander residents-666,666,666.0 11.6 27.2 Median age for Other race residents23.8 29.5 27.9 Median age for Two or more races residents29.6 27.5 43.4 Median age for White alone residents42.7 44.2 25.9 Median age for Hispanic or Latino residents26.9 25.1
Owner/renter occupied households by race in Kansas City
House owners and renters - White residents 17,885 67.6% Owner occupied8,561 32.4% Renter occupiedHouse owners and renters - Black or African American residents 5,890 43.5% Owner occupied7,655 56.5% Renter occupiedHouse owners and renters - American Indian / Alaska Native residents 799 51.7% Owner occupied747 48.3% Renter occupiedHouse owners and renters - Asian residents 1,589 71.4% Owner occupied638 28.6% Renter occupiedHouse owners and renters - Native Hawaiian / Pacific Islander residents 5 6.7% Owner occupied69 93.3% Renter occupiedHouse owners and renters - Other race residents 4,310 64.3% Owner occupied2,397 35.7% Renter occupiedHouse owners and renters - Two or more races residents 3,911 56.0% Owner occupied3,072 44.0% Renter occupiedHouse owners and renters - White alone residents 16,852 70.4% Owner occupied7,086 29.6% Renter occupiedHouse owners and renters - Hispanic or Latino residents 8,066 54.5% Owner occupied6,732 45.5% Renter occupied
Language usage in Kansas City
English speakers - Total 68.5% of residents of Kansas City speak English at home.
24.5% of residents speak Spanish at home 18,330 52.8% Speak English very well16,387 47.2% Speak English less than very well7.0% of residents speak other language at home 5,869 59.4% Speak English very well4,006 40.6% Speak English less than very well
English speakers - Born in the United States 83.0% of residents of Kansas City speak English at home.
13.3% of residents speak Spanish at home 4,825 83.8% Speak English very well935 16.2% Speak English less than very well3.7% of residents speak other language at home 1,601 99.8% Speak English very well3 0.2% Speak English less than very well
English speakers - Native, born elsewhere 42.8% of residents of Kansas City speak English at home.
51.7% of residents speak Spanish at home 143 16.6% Speak English very well717 83.4% Speak English less than very well5.4% of residents speak other language at home 90 100.0% Speak English very well
English speakers - Foreign-born 6.5% of residents of Kansas City speak English at home.
71.9% of residents speak Spanish at home 4,123 23.1% Speak English very well13,731 76.9% Speak English less than very well21.6% of residents speak other language at home 1,640 30.7% Speak English very well3,709 69.3% Speak English less than very well
White (Caucasian) - Speak only English Native:
94.1% (51,029)Foreign-born:
20.3% (546)
White (Caucasian) - Speak another language Native:
5.9% (3,184)Foreign-born:
79.7% (2,138)
Black or African American - Speak only English Native:
97.3% (27,349)Foreign-born:
19.5% (307)
Black or African American - Speak another language Native:
2.5% (710)Foreign-born:
80.5% (1,267)
American Indian / Alaska Native - Speak only English Native:
64.2% (574)Foreign-born:
1.5% (30)
American Indian / Alaska Native - Speak another language Native:
48.9% (437)Foreign-born:
100.0% (2,036)
Asian - Speak only English Native:
17.8% (488)Foreign-born:
0.9% (32)
Asian - Speak another language Native:
82.2% (2,248)Foreign-born:
99.1% (3,677)
Native Hawaiian / Pacific Islander - Speak only English Native:
12.3% (23)Foreign-born:
2.8% (12)
Native Hawaiian / Pacific Islander - Speak another language Native:
48.2% (90)Foreign-born:
80.3% (339)
Other race - Speak only English Native:
31.6% (4,210)Foreign-born:
5.5% (600)
Other race - Speak another language Native:
68.4% (9,119)Foreign-born:
94.5% (10,238)
Two or more races - Speak only English Native:
70.6% (10,673)Foreign-born:
6.9% (280)
Two or more races - Speak another language Native:
29.4% (4,443)Foreign-born:
93.1% (3,776)
White alone - Speak only English Native:
98.0% (48,455)Foreign-born:
38.2% (401)
White alone - Speak another language Native:
2.0% (976)Foreign-born:
61.8% (648)
Hispanic or Latino - Speak only English Native:
41.4% (11,380)Foreign-born:
5.5% (1,025)
Hispanic or Latino - Speak another language Native:
58.6% (16,132)Foreign-born:
94.5% (17,775)
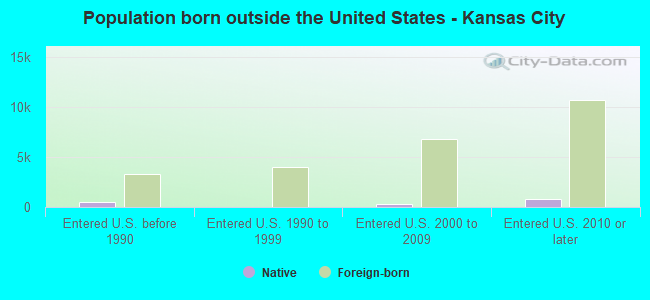
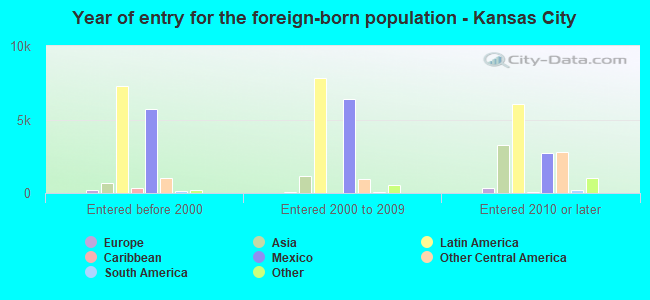
Foreign-born residents in Kansas City 28,065 residents are foreign born (12.9% Latin America , 3.3% Asia ).
This city:
18.3%Kansas:
7.1%
Marital status for residents in Kansas City Marital status - White (Caucasian) population 15 years and over
Males 37.2% Never married43.0% Now married1.3% Separated3.9% Widowed14.5% DivorcedFemales 31.3% Never married41.3% Now married1.9% Separated9.2% Widowed16.3% DivorcedWomen who gave birth in the past 12 months Now married:
66.4% (306)Unmarried:
33.6% (155)
Women who did not give birth in the past 12 months Now married:
39.6% (5,140)Unmarried:
60.4% (7,843)
Marital status - Black or African American population 15 years and over
Males 53.3% Never married25.3% Now married0.7% Separated1.5% Widowed19.3% DivorcedFemales 50.1% Never married16.7% Now married2.6% Separated13.0% Widowed17.6% DivorcedWomen who gave birth in the past 12 months Now married:
47.8% (215)Unmarried:
52.2% (235)
Women who did not give birth in the past 12 months Now married:
22.4% (1,705)Unmarried:
77.6% (5,908)
Marital status - American Indian / Alaska Native population 15 years and over
Males 56.3% Never married36.2% Now married0.6% Separated0.0% Widowed6.9% DivorcedFemales 28.0% Never married55.9% Now married1.7% Separated8.6% Widowed5.8% DivorcedWomen who gave birth in the past 12 months Now married:
37.7% (23)Unmarried:
62.3% (37)
Women who did not give birth in the past 12 months Now married:
68.1% (242)Unmarried:
31.9% (113)
Marital status - Asian population 15 years and over
Males 39.1% Never married58.4% Now married0.6% Separated0.5% Widowed1.4% DivorcedFemales 30.7% Never married60.6% Now married1.3% Separated3.6% Widowed3.8% DivorcedWomen who gave birth in the past 12 months Now married:
100.0% (290)Unmarried:
0.0% (0)
Women who did not give birth in the past 12 months Now married:
39.2% (714)Unmarried:
60.8% (1,108)
Marital status - Native Hawaiian / Pacific Islander population 15 years and over
Males 4.8% Never married95.2% Now married0.0% Separated0.0% Widowed0.0% DivorcedFemales 12.2% Never married81.6% Now married6.1% Separated0.0% Widowed0.0% DivorcedWomen who gave birth in the past 12 months Now married:
100.0% (25)Unmarried:
0.0% (0)
Women who did not give birth in the past 12 months Now married:
79.3% (48)Unmarried:
20.7% (13)
Marital status - Other race population 15 years and over
Males 51.0% Never married46.9% Now married0.3% Separated0.8% Widowed1.0% DivorcedFemales 39.3% Never married56.1% Now married0.6% Separated4.0% Widowed0.0% DivorcedWomen who gave birth in the past 12 months Now married:
70.0% (375)Unmarried:
30.0% (161)
Women who did not give birth in the past 12 months Now married:
46.2% (2,332)Unmarried:
53.8% (2,713)
Marital status - Two or more races population 15 years and over
Males 41.1% Never married42.1% Now married6.8% Separated3.9% Widowed6.2% DivorcedFemales 44.7% Never married32.8% Now married2.1% Separated9.2% Widowed11.2% DivorcedWomen who gave birth in the past 12 months Now married:
35.6% (149)Unmarried:
64.4% (270)
Women who did not give birth in the past 12 months Now married:
28.9% (1,500)Unmarried:
71.1% (3,685)
Marital status - White alone, not Hispanic / Latino population 15 years and over
Males 35.3% Never married44.4% Now married1.4% Separated3.5% Widowed15.5% DivorcedFemales 26.6% Never married44.0% Now married1.7% Separated10.1% Widowed17.6% DivorcedWomen who gave birth in the past 12 months Now married:
92.4% (306)Unmarried:
7.6% (25)
Women who did not give birth in the past 12 months Now married:
42.9% (4,736)Unmarried:
57.1% (6,312)
Marital status - Hispanic or Latino population 15 years and over
Males 49.3% Never married44.2% Now married2.2% Separated1.6% Widowed2.6% DivorcedFemales 46.8% Never married45.1% Now married2.3% Separated3.9% Widowed2.0% DivorcedWomen who gave birth in the past 12 months Now married:
53.1% (635)Unmarried:
46.9% (561)
Women who did not give birth in the past 12 months Now married:
38.1% (4,391)Unmarried:
61.9% (7,138)
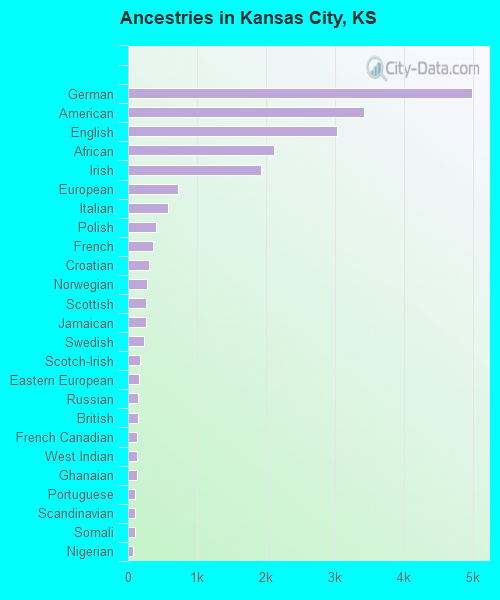
Ancestries in Kansas City
4,988 5.9% German3,421 4.0% American3,039 3.6% English2,117 2.5% African1,936 2.3% Irish732 0.9% European587 0.7% Italian401 0.5% Polish357 0.4% French305 0.4% Croatian279 0.3% Norwegian265 0.3% Scottish257 0.3% Jamaican228 0.3% Swedish175 0.2% Scotch-Irish160 0.2% Eastern European149 0.2% Russian138 0.2% British137 0.2% French Canadian131 0.2% West Indian130 0.2% Ghanaian107 0.1% Portuguese99 0.1% Scandinavian95 0.1% Somali66 0.08% Nigerian63 0.07% Slovene60 0.07% Armenian57 0.07% Moroccan56 0.07% Basque54 0.06% Dutch49 0.06% Haitian47 0.06% Serbian39 0.05% Liberian38 0.04% Ethiopian36 0.04% Danish35 0.04% Arab32 0.04% Israeli32 0.04% Greek31 0.04% Canadian31 0.04% Northern European30 0.04% Ukrainian29 0.03% Yugoslavian28 0.03% Austrian25 0.03% Belgian25 0.03% Kenyan24 0.03% Australian24 0.03% Welsh22 0.03% Czech20 0.02% Brazilian16 0.02% Iraqi16 0.02% Sudanese11 0.01% Czechoslovakian11 0.01% Barbadian9 0.01% Slavic9 0.01% Romanian9 0.01% Egyptian9 0.01% Swiss8 0.01% German Russian7 0.01% Palestinian6 0.01% Slovak
Geographical mobility in Kansas City Same house 1 year ago 50,868 84.8% White (Caucasian)25,299 81.1% Black or African American1,974 92.7% American Indian / Alaska Native5,613 85.3% Asian323 97.2% Native Hawaiian / Pacific Islander24,227 93.1% Other race18,675 86.4% Two or more races45,202 85.2% White alone, not Hispanic / Latino44,671 88.8% Hispanic or LatinoMoved within same county 2,185 3.6% White / Caucasian4,125 13.2% Black or African American8 0.4% American Indian / Alaska Native427 6.5% Asian1,590 6.1% Other race1,911 8.8% Two or more races1,665 3.1% White alone, not Hispanic / Latino3,519 7.0% Hispanic or LatinoMoved within same state 3,277 5.5% White / Caucasian885 2.8% Black or African American38 1.8% American Indian / Alaska Native13 4.0% Native Hawaiian / Pacific Islander273 1.1% Other race419 1.9% Two or more races3,277 6.2% White alone, not Hispanic / Latino883 1.8% Hispanic or LatinoMoved from different state 3,506 5.8% White / Caucasian888 2.8% Black or African American135 6.3% American Indian / Alaska Native469 7.1% Asian155 0.6% Other race564 2.6% Two or more races2,829 5.3% White alone, not Hispanic / Latino999 2.0% Hispanic or LatinoMoved from abroad 153 0.3% White9 0.4% American Indian / Alaska Native69 1.0% Asian249 1.0% Other race51 0.2% Two or more races60 0.1% White alone, not Hispanic / Latino224 0.4% Hispanic or Latino
Children Nativity (place of birth) in Kansas City
Children under 6 years - Living with two parents Both parents native 2,945 100.0% NativeBoth parents foreign-born 2,360 100.0% NativeOne native, one foreign-born parent 960 100.0% NativeChildren under 6 years - Living with one parent Native parent 4,559 100.0% NativeForeign-born parent 1,053 100.0% NativeChildren 6 to 17 years - Living with two parents Both parents native 4,832 100.0% NativeBoth parents foreign-born 4,825 78.9% Native1,291 21.1% Foreign-bornOne native, one foreign-born parent 1,101 100.0% NativeChildren 6 to 17 years - Living with one parent Native parent 11,036 100.0% NativeForeign-born parent 2,407 58.0% Native1,746 42.0% Foreign-born
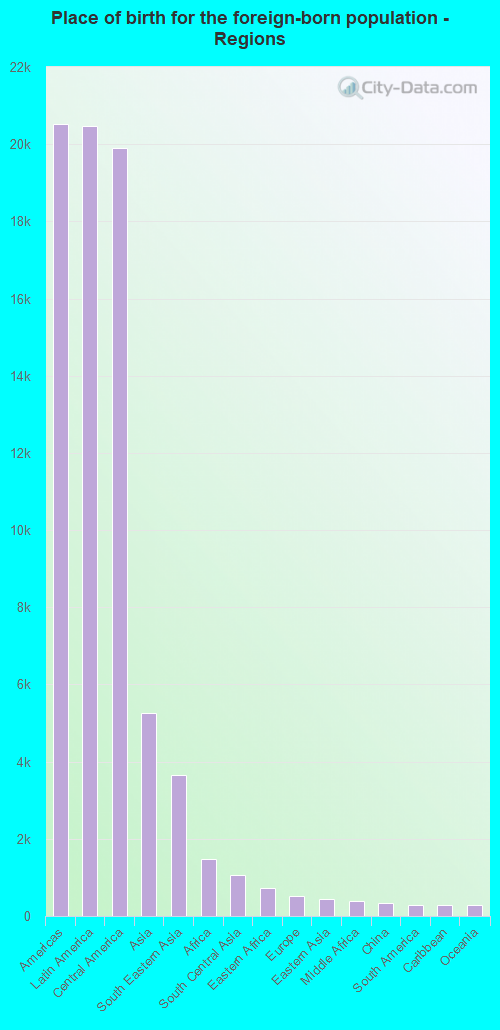
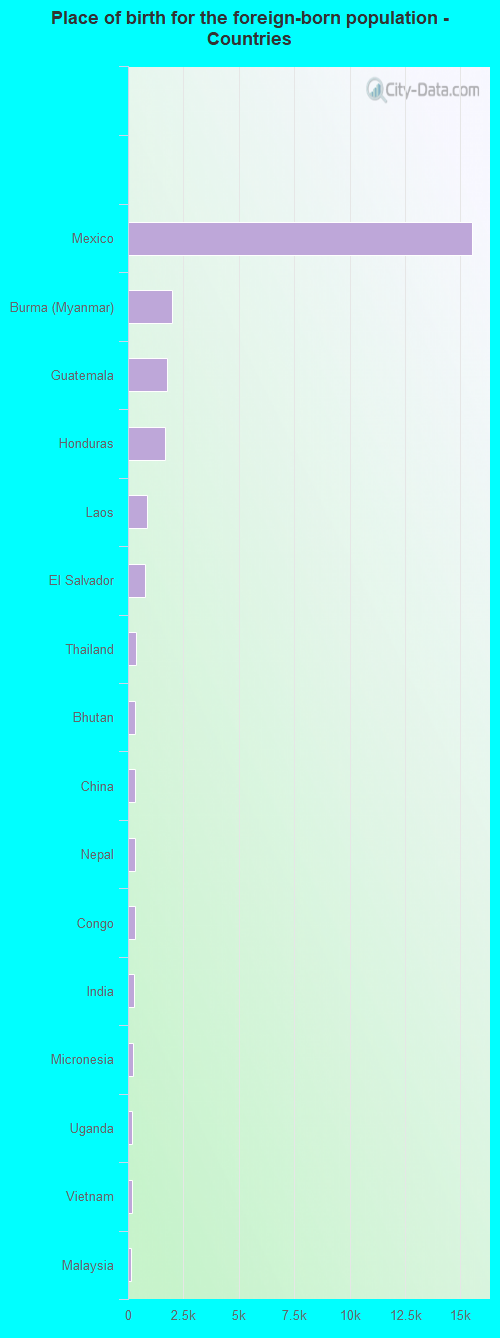
Place of birth for residents in Kansas City 20,530 Americas20,467 Latin America19,899 Central America5,260 Asia3,656 South Eastern Asia1,475 Africa1,065 South Central Asia725 Eastern Africa524 Europe440 Eastern Asia397 Middle Africa342 China284 South America283 Caribbean274 Oceania161 Eastern Europe138 Northern Africa129 Southern Europe129 Western Africa127 Western Europe106 Northern Europe97 Western Asia63 Northern America44 Australia and New Zealand Subregion9 Southern Africa15,514 Mexico1,993 Burma (Myanmar)1,761 Guatemala1,648 Honduras837 Laos786 El Salvador365 Thailand337 Bhutan336 China325 Nepal321 Congo268 India227 Micronesia186 Uganda183 Vietnam147 Malaysia138 Sudan129 Spain122 Philippines104 Kenya104 Cuba103 Jamaica83 France82 Iraq78 Ecuador76 Democratic Republic of Congo (Zaire)72 United Kingdom67 Korea67 Brazil63 Somalia63 Canada58 Bosnia and Herzegovina52 Nigeria48 Sri Lanka48 Bolivia46 Colombia45 Ethiopia45 Russia44 Australia44 Eritrea43 Germany43 Pakistan41 Liberia34 Bangladesh30 Japan28 England25 Serbia25 Panama25 Haiti24 Uruguay22 Costa Rica21 Romania20 Ghana15 Jordan14 Peru13 Dominican Republic11 Barbados10 Poland9 South Africa7 Iran6 Cambodia6 Hong Kong5 Sweden4 Argentina
Grandparents responsible for own grandchildren in Kansas City
Grandparents (30 to 59 years) White / Caucasian 449 66.1% Responsible for grandchildren230 33.9% Not responsible for grandchildrenBlack or African American 325 77.7% Responsible for grandchildren93 22.3% Not responsible for grandchildrenAmerican Indian / Alaska Native 47 46.3% Responsible for grandchildren55 53.7% Not responsible for grandchildrenAsian 44 38.2% Responsible for grandchildren71 61.8% Not responsible for grandchildrenOther race 35 10.1% Responsible for grandchildren311 89.9% Not responsible for grandchildrenTwo or more races 27 10.1% Responsible for grandchildren236 89.9% Not responsible for grandchildrenWhite alone, not Hispanic / Latino 131 33.8% Responsible for grandchildren257 66.2% Not responsible for grandchildrenHispanic or Latino 143 21.2% Responsible for grandchildren534 78.8% Not responsible for grandchildrenGrandparents (60 years and over) White / Caucasian 351 25.5% Responsible for grandchildren1,027 74.5% Not responsible for grandchildrenBlack or African American 91 35.3% Responsible for grandchildren166 64.7% Not responsible for grandchildrenAmerican Indian / Alaska Native 17 68.5% Responsible for grandchildren8 31.5% Not responsible for grandchildrenAsian 23 11.3% Responsible for grandchildren183 88.7% Not responsible for grandchildrenOther race 40 9.9% Responsible for grandchildren369 90.1% Not responsible for grandchildrenTwo or more races 16 13.9% Responsible for grandchildren97 86.1% Not responsible for grandchildrenWhite alone, not Hispanic / Latino 252 25.5% Responsible for grandchildren737 74.5% Not responsible for grandchildrenHispanic or Latino 67 13.3% Responsible for grandchildren440 86.7% Not responsible for grandchildren
Zip codes: 66101 , 66102 , 66103 , 66104 , 66105 , 66106 , 66109 , 66112 , 66115, 66118, 66217 .