Races in Key Biscayne, Florida (FL) Detailed Stats
Data:
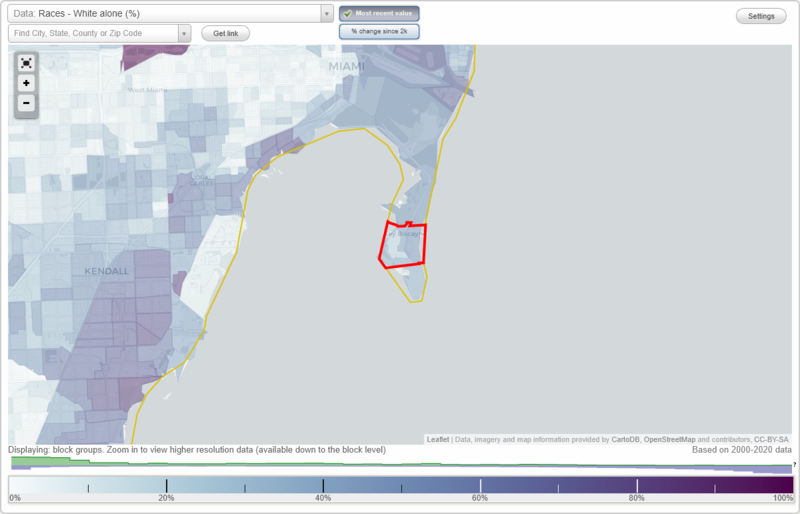
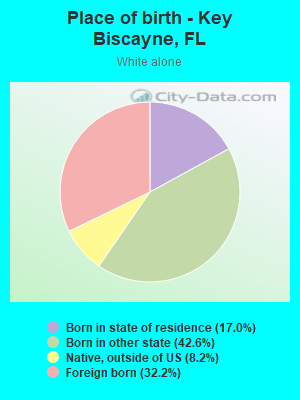
Races - White alone (%)
Races - White alone (% change since 2000)
Races - Black alone (%)
Races - Black alone (% change since 2000)
Races - American Indian alone (%)
Races - American Indian alone (% change since 2000)
Races - Asian alone (%)
Races - Asian alone (% change since 2000)
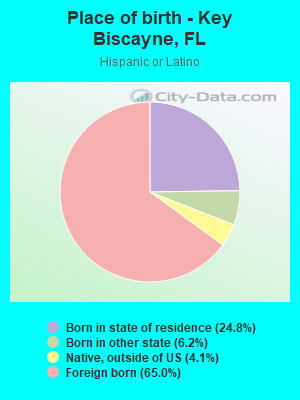
Races - Hispanic (%)
Races - Hispanic (% change since 2000)
Races - Native Hawaiian and Other Pacific Islander alone (%)
Races - Native Hawaiian and Other Pacific Islander alone (% change since 2000)
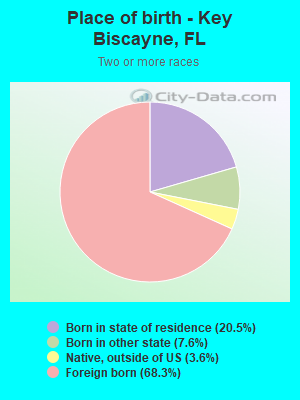
Races - Two or more races(%)
Races - Two or more races(% change since 2000)
Races - Other race alone (%)
Races - Other race alone (% change since 2000)
Racial diversity
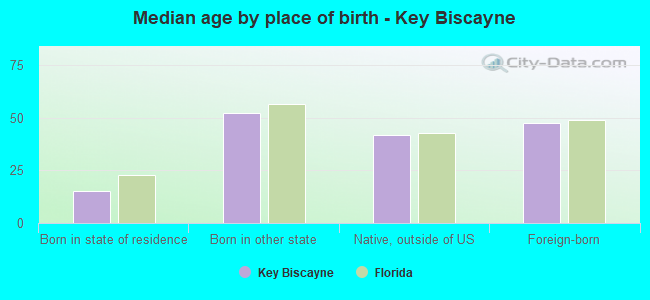
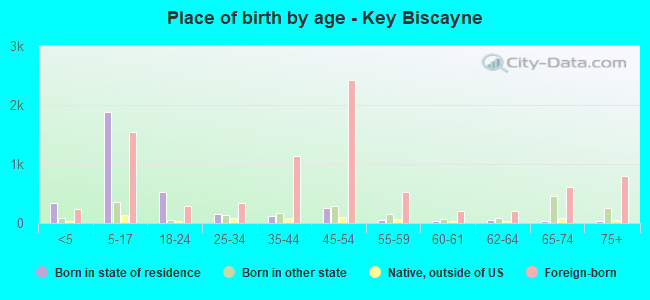
Place of birth - Born in state of residence (%)
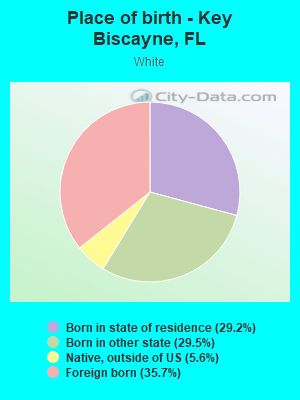
Place of birth - Born in state of residence (%) - White
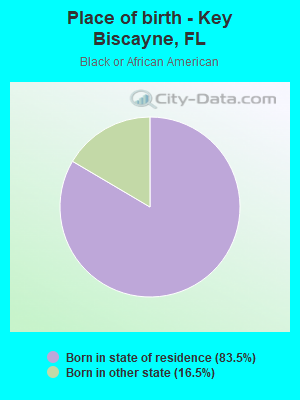
Place of birth - Born in state of residence (%) - Black or African American
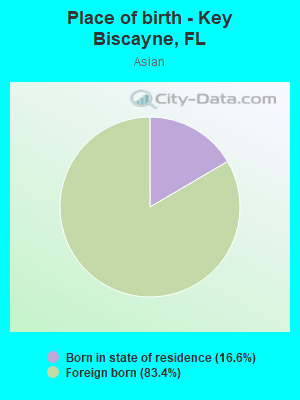
Place of birth - Born in state of residence (%) - Asian
Place of birth - Born in state of residence (%) - Hispanic or Latino
Place of birth - Born in state of residence (%) - American Indian and Alaska Native
Place of birth - Born in state of residence (%) - Multirace
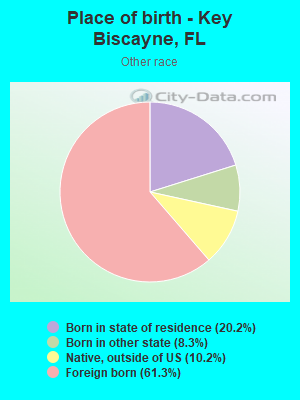
Place of birth - Born in state of residence (%) - Other Race
Place of birth - Born in other state (%)
Place of birth - Born in other state (%) - White
Place of birth - Born in other state (%) - Black or African American
Place of birth - Born in other state (%) - Asian
Place of birth - Born in other state (%) - Hispanic or Latino
Place of birth - Born in other state (%) - American Indian and Alaska Native
Place of birth - Born in other state (%) - Multirace
Place of birth - Born in other state (%) - Other Race
Place of birth - Native, outside of US (%)
Place of birth - Native, outside of US (%) - White
Place of birth - Native, outside of US (%) - Black or African American
Place of birth - Native, outside of US (%) - Asian
Place of birth - Native, outside of US (%) - Hispanic or Latino
Place of birth - Native, outside of US (%) - American Indian and Alaska Native
Place of birth - Native, outside of US (%) - Multirace
Place of birth - Native, outside of US (%) - Other Race
Place of birth - Foreign born (%)
Place of birth - Foreign born (%) - White
Place of birth - Foreign born (%) - Black or African American
Place of birth - Foreign born (%) - Asian
Place of birth - Foreign born (%) - Hispanic or Latino
Place of birth - Foreign born (%) - American Indian and Alaska Native
Place of birth - Foreign born (%) - Multirace
Place of birth - Foreign born (%) - Other Race
Residents speaking English at home (%)
Residents speaking English at home - Born in the United States (%)
Residents speaking English at home - Native, born elsewhere (%)
Residents speaking English at home - Foreign born (%)
Residents speaking Spanish at home (%)
Residents speaking Spanish at home - Born in the United States (%)
Residents speaking Spanish at home - Native, born elsewhere (%)
Residents speaking Spanish at home - Foreign born (%)
Residents speaking other language at home (%)
Residents speaking other language at home - Born in the United States (%)
Residents speaking other language at home - Native, born elsewhere (%)
Residents speaking other language at home - Foreign born (%)
Marital status - Never married (%)
Marital status - Now married (%)
Marital status - Separated (%)
Marital status - Widowed (%)
Marital status - Divorced (%)
Ancestries Reported - Arab (%)
Ancestries Reported - Czech (%)
Ancestries Reported - Danish (%)
Ancestries Reported - Dutch (%)
Ancestries Reported - English (%)
Ancestries Reported - French (%)
Ancestries Reported - French Canadian (%)
Ancestries Reported - German (%)
Ancestries Reported - Greek (%)
Ancestries Reported - Hungarian (%)
Ancestries Reported - Irish (%)
Ancestries Reported - Italian (%)
Ancestries Reported - Lithuanian (%)
Ancestries Reported - Norwegian (%)
Ancestries Reported - Polish (%)
Ancestries Reported - Portuguese (%)
Ancestries Reported - Russian (%)
Ancestries Reported - Scotch-Irish (%)
Ancestries Reported - Scottish (%)
Ancestries Reported - Slovak (%)
Ancestries Reported - Subsaharan African (%)
Ancestries Reported - Swedish (%)
Ancestries Reported - Swiss (%)
Ancestries Reported - Ukrainian (%)
Ancestries Reported - United States (%)
Ancestries Reported - Welsh (%)
Ancestries Reported - West Indian (%)
Ancestries Reported - Other (%)
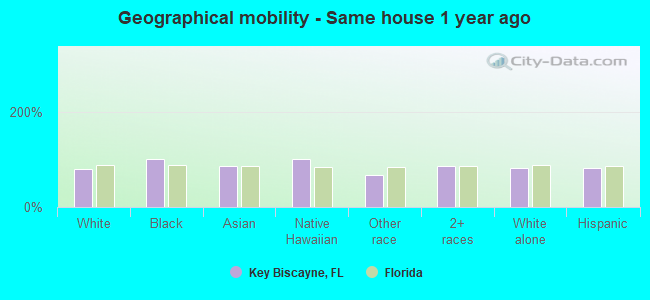
Geographical mobility - Same house 1 year ago (%)
Geographical mobility - Same house 1 year ago (%) - White
Geographical mobility - Same house 1 year ago (%) - Black or African American
Geographical mobility - Same house 1 year ago (%) - Asian
Geographical mobility - Same house 1 year ago (%) - Hispanic or Latino
Geographical mobility - Same house 1 year ago (%) - American Indian and Alaska Native
Geographical mobility - Same house 1 year ago (%) - Multirace
Geographical mobility - Same house 1 year ago (%) - Other Race
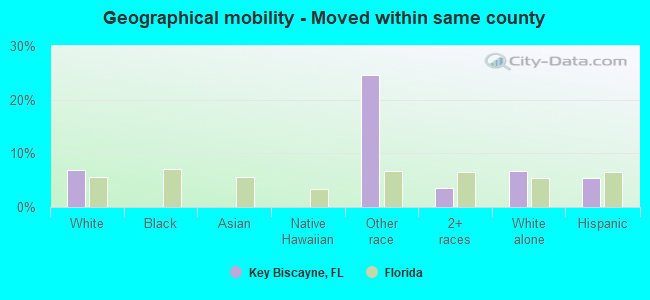
Geographical mobility - Moved within same county (%)
Geographical mobility - Moved within same county (%) - White
Geographical mobility - Moved within same county (%) - Black or African American
Geographical mobility - Moved within same county (%) - Asian
Geographical mobility - Moved within same county (%) - Hispanic or Latino
Geographical mobility - Moved within same county (%) - American Indian and Alaska Native
Geographical mobility - Moved within same county (%) - Multirace
Geographical mobility - Moved within same county (%) - Other Race
Geographical mobility - Moved from different county within same state (%)
Geographical mobility - Moved from different county within same state (%) - White
Geographical mobility - Moved from different county within same state (%) - Black or African American
Geographical mobility - Moved from different county within same state (%) - Asian
Geographical mobility - Moved from different county within same state (%) - Hispanic or Latino
Geographical mobility - Moved from different county within same state (%) - American Indian and Alaska Native
Geographical mobility - Moved from different county within same state (%) - Multirace
Geographical mobility - Moved from different county within same state (%) - Other Race
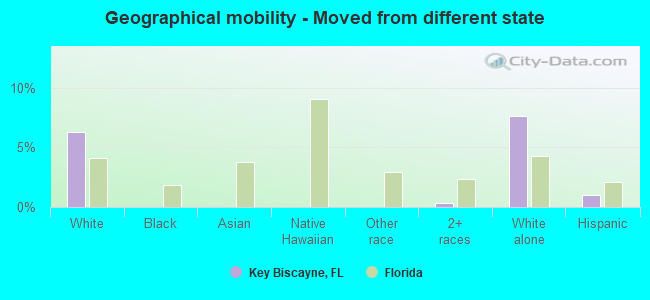
Geographical mobility - Moved from different state (%)
Geographical mobility - Moved from different state (%) - White
Geographical mobility - Moved from different state (%) - Black or African American
Geographical mobility - Moved from different state (%) - Asian
Geographical mobility - Moved from different state (%) - Hispanic or Latino
Geographical mobility - Moved from different state (%) - American Indian and Alaska Native
Geographical mobility - Moved from different state (%) - Multirace
Geographical mobility - Moved from different state (%) - Other Race
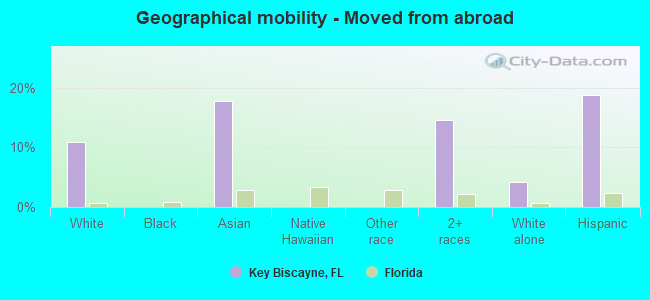
Geographical mobility - Moved from abroad (%)
Geographical mobility - Moved from abroad (%) - White
Geographical mobility - Moved from abroad (%) - Black or African American
Geographical mobility - Moved from abroad (%) - Asian
Geographical mobility - Moved from abroad (%) - Hispanic or Latino
Geographical mobility - Moved from abroad (%) - American Indian and Alaska Native
Geographical mobility - Moved from abroad (%) - Multirace
Geographical mobility - Moved from abroad (%) - Other Race
Place of birth for the foreign-born population - Ireland (%)
Place of birth for the foreign-born population - Denmark (%)
Place of birth for the foreign-born population - Norway (%)
Place of birth for the foreign-born population - Sweden (%)
Place of birth for the foreign-born population - United Kingdom (%)
Place of birth for the foreign-born population - England (%)
Place of birth for the foreign-born population - Scotland (%)
Place of birth for the foreign-born population - Other Northern Europe (%)
Place of birth for the foreign-born population - Austria (%)
Place of birth for the foreign-born population - Belgium (%)
Place of birth for the foreign-born population - France (%)
Place of birth for the foreign-born population - Germany (%)
Place of birth for the foreign-born population - Netherlands (%)
Place of birth for the foreign-born population - Switzerland (%)
Place of birth for the foreign-born population - Other Western Europe (%)
Place of birth for the foreign-born population - Greece (%)
Place of birth for the foreign-born population - Italy (%)
Place of birth for the foreign-born population - Portugal (%)
Place of birth for the foreign-born population - Spain (%)
Place of birth for the foreign-born population - Other Southern Europe (%)
Place of birth for the foreign-born population - Albania (%)
Place of birth for the foreign-born population - Belarus (%)
Place of birth for the foreign-born population - Bosnia and Herzegovina (%)
Place of birth for the foreign-born population - Bulgaria (%)
Place of birth for the foreign-born population - Croatia (%)
Place of birth for the foreign-born population - Czechoslovakia (%)
Place of birth for the foreign-born population - Hungary (%)
Place of birth for the foreign-born population - Latvia (%)
Place of birth for the foreign-born population - Lithuania (%)
Place of birth for the foreign-born population - North Macedonia (Macedonia) (%)
Place of birth for the foreign-born population - Moldova (%)
Place of birth for the foreign-born population - Poland (%)
Place of birth for the foreign-born population - Romania (%)
Place of birth for the foreign-born population - Russia (%)
Place of birth for the foreign-born population - Serbia (%)
Place of birth for the foreign-born population - Ukraine (%)
Place of birth for the foreign-born population - Other Eastern Europe (%)
Place of birth for the foreign-born population - China (%)
Place of birth for the foreign-born population - Hong Kong (%)
Place of birth for the foreign-born population - Taiwan (%)
Place of birth for the foreign-born population - Japan (%)
Place of birth for the foreign-born population - Korea (%)
Place of birth for the foreign-born population - Other Eastern Asia (%)
Place of birth for the foreign-born population - Afghanistan (%)
Place of birth for the foreign-born population - Bangladesh (%)
Place of birth for the foreign-born population - India (%)
Place of birth for the foreign-born population - Iran (%)
Place of birth for the foreign-born population - Kazakhstan (%)
Place of birth for the foreign-born population - Nepal (%)
Place of birth for the foreign-born population - Pakistan (%)
Place of birth for the foreign-born population - Sri Lanka (%)
Place of birth for the foreign-born population - Uzbekistan (%)
Place of birth for the foreign-born population - Other South Central Asia (%)
Place of birth for the foreign-born population - Burma (%)
Place of birth for the foreign-born population - Cambodia (%)
Place of birth for the foreign-born population - Indonesia (%)
Place of birth for the foreign-born population - Laos (%)
Place of birth for the foreign-born population - Malaysia (%)
Place of birth for the foreign-born population - Philippines (%)
Place of birth for the foreign-born population - Singapore (%)
Place of birth for the foreign-born population - Thailand (%)
Place of birth for the foreign-born population - Vietnam (%)
Place of birth for the foreign-born population - Other South Eastern Asia (%)
Place of birth for the foreign-born population - Armenia (%)
Place of birth for the foreign-born population - Iraq (%)
Place of birth for the foreign-born population - Israel (%)
Place of birth for the foreign-born population - Jordan (%)
Place of birth for the foreign-born population - Kuwait (%)
Place of birth for the foreign-born population - Lebanon (%)
Place of birth for the foreign-born population - Saudi Arabia (%)
Place of birth for the foreign-born population - Syria (%)
Place of birth for the foreign-born population - Turkey (%)
Place of birth for the foreign-born population - Yemen (%)
Place of birth for the foreign-born population - Other Western Asia (%)
Place of birth for the foreign-born population - Eritrea (%)
Place of birth for the foreign-born population - Ethiopia (%)
Place of birth for the foreign-born population - Kenya (%)
Place of birth for the foreign-born population - Somalia (%)
Place of birth for the foreign-born population - Uganda (%)
Place of birth for the foreign-born population - Zimbabwe (%)
Place of birth for the foreign-born population - Other Eastern Africa (%)
Place of birth for the foreign-born population - Cameroon (%)
Place of birth for the foreign-born population - Congo (%)
Place of birth for the foreign-born population - Democratic Republic of Congo (Zaire) (%)
Place of birth for the foreign-born population - Other Middle Africa (%)
Place of birth for the foreign-born population - Egypt (%)
Place of birth for the foreign-born population - Morocco (%)
Place of birth for the foreign-born population - Sudan (%)
Place of birth for the foreign-born population - Other Northern Africa (%)
Place of birth for the foreign-born population - South Africa (%)
Place of birth for the foreign-born population - Other Southern Africa (%)
Place of birth for the foreign-born population - Cabo Verde (%)
Place of birth for the foreign-born population - Ghana (%)
Place of birth for the foreign-born population - Liberia (%)
Place of birth for the foreign-born population - Nigeria (%)
Place of birth for the foreign-born population - Senegal (%)
Place of birth for the foreign-born population - Sierra Leone (%)
Place of birth for the foreign-born population - Other Western Africa (%)
Place of birth for the foreign-born population - Australia (%)
Place of birth for the foreign-born population - New Zealand (%)
Place of birth for the foreign-born population - Fiji (%)
Place of birth for the foreign-born population - Micronesia (%)
Place of birth for the foreign-born population - Bahamas (%)
Place of birth for the foreign-born population - Barbados (%)
Place of birth for the foreign-born population - Cuba (%)
Place of birth for the foreign-born population - Dominica (%)
Place of birth for the foreign-born population - Dominican Republic (%)
Place of birth for the foreign-born population - Grenada (%)
Place of birth for the foreign-born population - Haiti (%)
Place of birth for the foreign-born population - Jamaica (%)
Place of birth for the foreign-born population - St. Vincent and the Grenadines (%)
Place of birth for the foreign-born population - Trinidad and Tobago (%)
Place of birth for the foreign-born population - West Indies (%)
Place of birth for the foreign-born population - Other Caribbean (%)
Place of birth for the foreign-born population - Belize (%)
Place of birth for the foreign-born population - Costa Rica (%)
Place of birth for the foreign-born population - El Salvador (%)
Place of birth for the foreign-born population - Guatemala (%)
Place of birth for the foreign-born population - Honduras (%)
Place of birth for the foreign-born population - Mexico (%)
Place of birth for the foreign-born population - Nicaragua (%)
Place of birth for the foreign-born population - Panama (%)
Place of birth for the foreign-born population - Other Central America (%)
Place of birth for the foreign-born population - Argentina (%)
Place of birth for the foreign-born population - Bolivia (%)
Place of birth for the foreign-born population - Brazil (%)
Place of birth for the foreign-born population - Chile (%)
Place of birth for the foreign-born population - Colombia (%)
Place of birth for the foreign-born population - Ecuador (%)
Place of birth for the foreign-born population - Guyana (%)
Place of birth for the foreign-born population - Peru (%)
Place of birth for the foreign-born population - Uruguay (%)
Place of birth for the foreign-born population - Venezuela (%)
Place of birth for the foreign-born population - Other South America (%)
Place of birth for the foreign-born population - Canada (%)
Place of birth for the foreign-born population - Other Northern America (%)
Place of birth for the foreign-born population - Other (%)
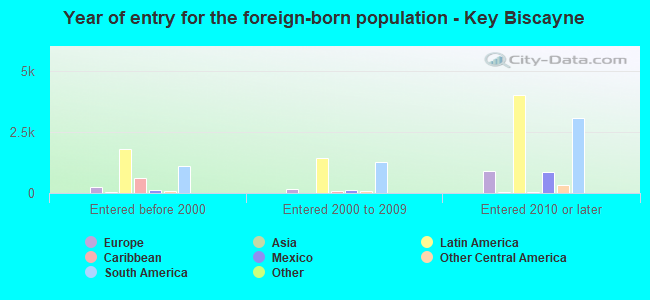
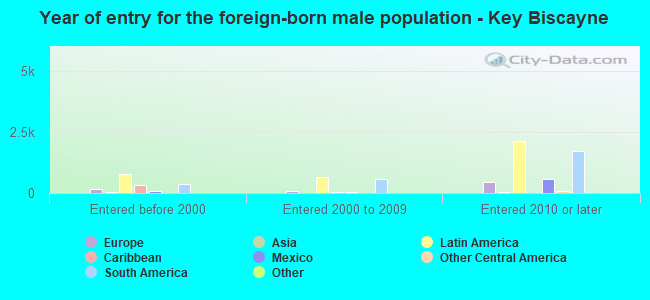
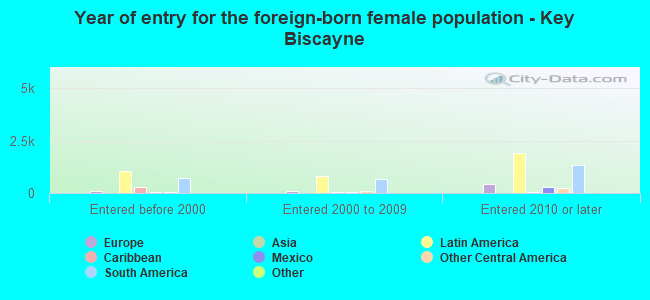
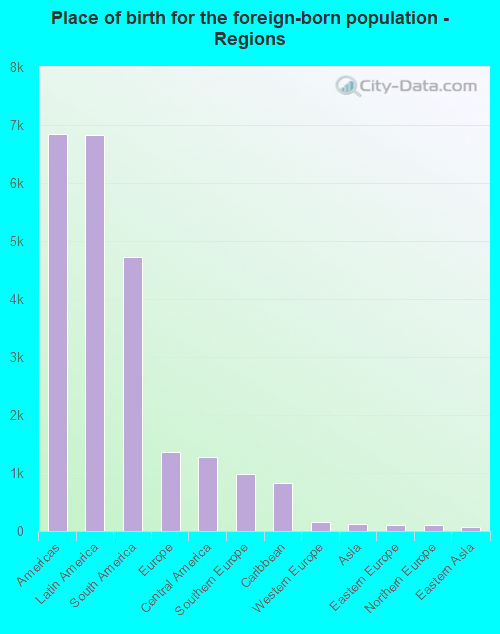
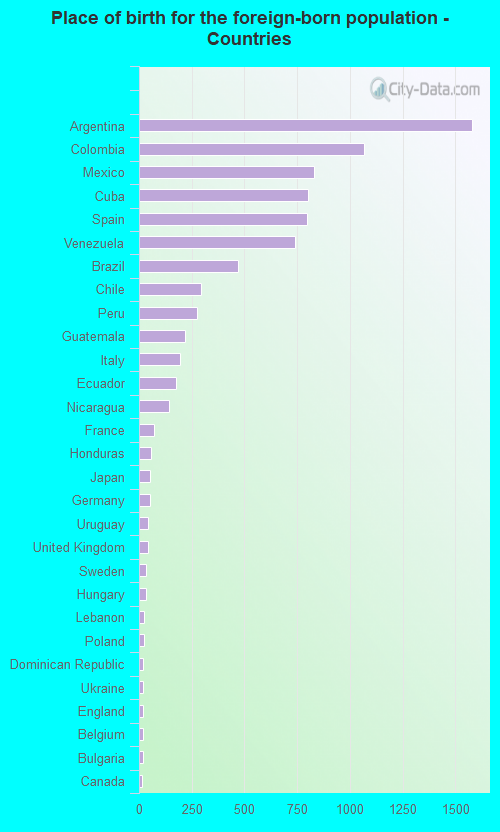
According to 2022 data, the most numerous races in Key Biscayne, FL are White alone (3,072 residents), Hispanic (10,928 residents), and Black alone (87 residents). 17.1% of Key Biscayne residents speak English at home. 57.5% of Key Biscayne, FL residents are foreign-born (46.9% born in Latin America, 9.3% born in Europe), which is 63.4% greater than the foreign-born rate of 21.0% across the entire state of Florida.
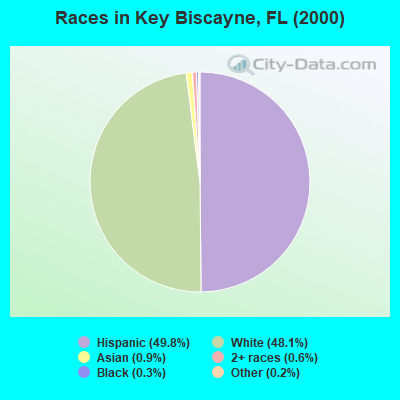
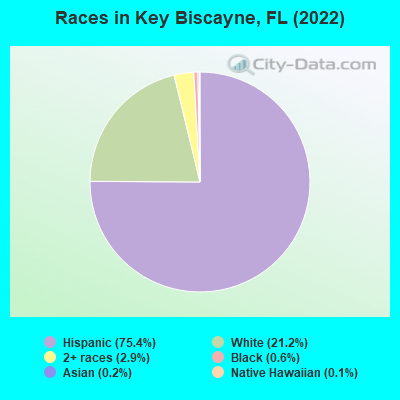
Race distribution in Key Biscayne
2000 2022
10,458,509 65.4% White alone 2,682,715 16.8% Hispanic 2,264,268 14.2% Black alone 261,693 1.6% Asian alone 236,954 1.5% Two or more races 42,358 0.3% American Indian alone 28,994 0.2% Other race alone 6,887 0.04% Native Hawaiian and Other
11,309,403 50.8% White alone 6,025,039 27.1% Hispanic 3,241,015 14.6% Black alone 861,630 3.9% Two or more races 623,692 2.8% Asian alone 152,054 0.7% Other race alone 22,504 0.1% American Indian alone 9,486 0.04% Native Hawaiian and Other
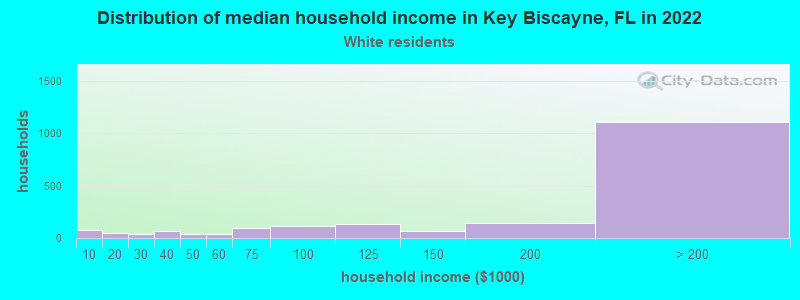
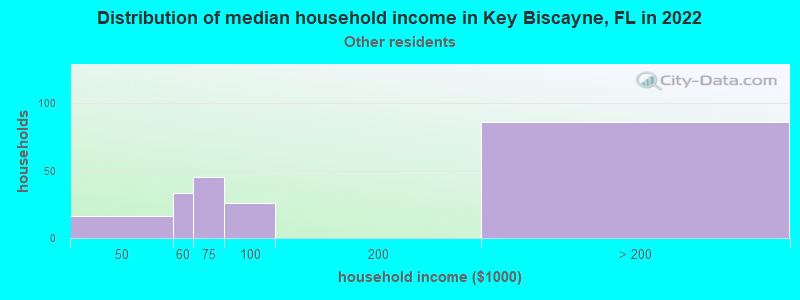
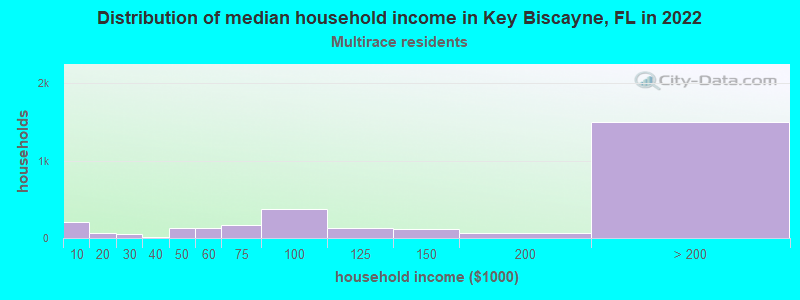
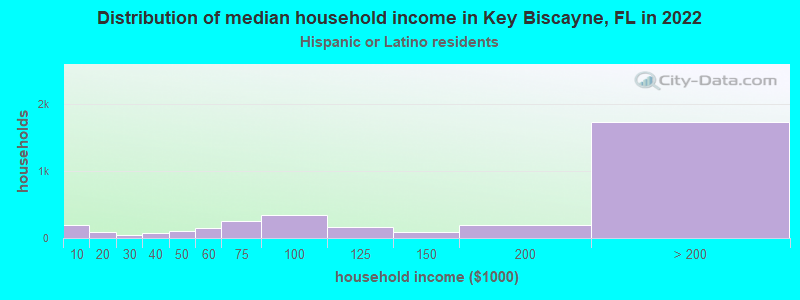
Income and house value in Key Biscayne Median household income in 2022 $144,925 White non-Hispanic householdersover $200,000 Two or more races householders$187,727 Hispanic or Latino race householdersMedian 2022 house value over $1,000,000 White Non-Hispanic householdersover $1,000,000 Some other race householdersover $1,000,000 Two or more races householdersover $1,000,000 Hispanic or Latino householders
Median age by race in Key Biscayne
42.7 Median age for White residents40.8 42.9 54.9 Median age for Black or African American residents-674,509,803.2 -679,211,468.9 -653,446,647.1 Median age for American Indian / Alaska Native residents-543,352,600.6 -762,696,213.5 59.1 Median age for Asian residents-697,674,417.9 57.4 -679,849,340.2 Median age for Native Hawaiian / Pacific Islander residents-858,307,848.3 -443,298,968.6 37.6 Median age for Other race residents35.2 44.2 36.6 Median age for Two or more races residents23.6 43.8 50.3 Median age for White alone residents49.9 51.0 39.9 Median age for Hispanic or Latino residents30.7 45.2
Owner/renter occupied households by race in Key Biscayne
House owners and renters - White residents 1,215 71.9% Owner occupied474 28.1% Renter occupiedHouse owners and renters - Black or African American residents 15 100.0% Renter occupiedHouse owners and renters - Asian residents 6 100.0% Owner occupiedHouse owners and renters - Other race residents 51 27.0% Owner occupied137 73.0% Renter occupiedHouse owners and renters - Two or more races residents 1,748 60.8% Owner occupied1,128 39.2% Renter occupiedHouse owners and renters - White alone residents 942 69.9% Owner occupied405 30.1% Renter occupiedHouse owners and renters - Hispanic or Latino residents 2,102 63.4% Owner occupied1,215 36.6% Renter occupied
Language usage in Key Biscayne
English speakers - Total 17.1% of residents of Key Biscayne speak English at home.
73.1% of residents speak Spanish at home 8,079 79.7% Speak English very well2,059 20.3% Speak English less than very well9.1% of residents speak other language at home 1,068 84.6% Speak English very well195 15.4% Speak English less than very well
English speakers - Born in the United States 55.4% of residents of Key Biscayne speak English at home.
40.5% of residents speak Spanish at home 792 96.0% Speak English very well33 4.0% Speak English less than very well3.6% of residents speak other language at home 68 93.2% Speak English very well5 6.8% Speak English less than very well
English speakers - Native, born elsewhere 27.4% of residents of Key Biscayne speak English at home.
61.3% of residents speak Spanish at home 330 79.7% Speak English very well84 20.3% Speak English less than very well10.8% of residents speak other language at home 73 100.0% Speak English very well
English speakers - Foreign-born 3.9% of residents of Key Biscayne speak English at home.
82.6% of residents speak Spanish at home 4,802 71.5% Speak English very well1,912 28.5% Speak English less than very well12.1% of residents speak other language at home 807 82.2% Speak English very well175 17.8% Speak English less than very well
White (Caucasian) - Speak only English Native:
48.1% (1,337)Foreign-born:
4.4% (73)
White (Caucasian) - Speak another language Native:
49.5% (1,375)Foreign-born:
93.7% (1,544)
Asian - Speak only English Native:
100.0% (7)Foreign-born:
35.9% (10)
Other race - Speak only English Native:
22.1% (36)Foreign-born:
8.0% (24)
Other race - Speak another language Native:
77.9% (128)Foreign-born:
92.0% (279)
Two or more races - Speak only English Native:
26.9% (765)Foreign-born:
4.7% (305)
Two or more races - Speak another language Native:
72.8% (2,069)Foreign-born:
95.4% (6,254)
White alone - Speak only English Native:
66.1% (1,268)Foreign-born:
4.5% (45)
White alone - Speak another language Native:
33.3% (640)Foreign-born:
90.1% (896)
Hispanic or Latino - Speak only English Native:
15.9% (557)Foreign-born:
3.3% (233)
Hispanic or Latino - Speak another language Native:
84.1% (2,946)Foreign-born:
96.6% (6,716)
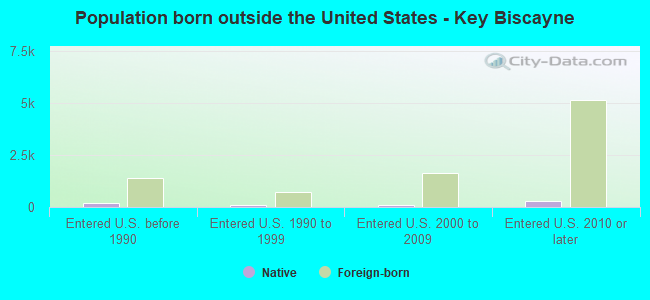
Foreign-born residents in Key Biscayne 8,327 residents are foreign born (46.9% Latin America , 9.3% Europe ).
This city:
57.5%Florida:
21.1%
Marital status for residents in Key Biscayne Marital status - White (Caucasian) population 15 years and over
Males 26.3% Never married66.4% Now married0.3% Separated1.5% Widowed5.6% DivorcedFemales 27.0% Never married54.6% Now married0.5% Separated7.7% Widowed10.3% DivorcedWomen who gave birth in the past 12 months Now married:
100.0% (26)Unmarried:
0.0% (0)
Women who did not give birth in the past 12 months Now married:
48.6% (450)Unmarried:
51.4% (476)
Marital status - Black or African American population 15 years and over
Males 100.0% Never married0.0% Now married0.0% Separated0.0% Widowed0.0% DivorcedFemales 100.0% Never married0.0% Now married0.0% Separated0.0% Widowed0.0% DivorcedMarital status - Other race population 15 years and over
Males 39.3% Never married60.7% Now married0.0% Separated0.0% Widowed0.0% DivorcedFemales 12.2% Never married87.8% Now married0.0% Separated0.0% Widowed0.0% DivorcedWomen who gave birth in the past 12 months Now married:
100.0% (10)Unmarried:
0.0% (0)
Women who did not give birth in the past 12 months Now married:
78.9% (78)Unmarried:
21.1% (21)
Marital status - Two or more races population 15 years and over
Males 32.4% Never married62.4% Now married0.0% Separated2.9% Widowed2.3% DivorcedFemales 32.2% Never married48.6% Now married1.3% Separated2.6% Widowed15.3% DivorcedWomen who gave birth in the past 12 months Now married:
68.1% (51)Unmarried:
31.9% (24)
Women who did not give birth in the past 12 months Now married:
50.8% (1,293)Unmarried:
49.2% (1,253)
Marital status - White alone, not Hispanic / Latino population 15 years and over
Males 18.8% Never married70.1% Now married0.8% Separated3.0% Widowed7.3% DivorcedFemales 27.8% Never married49.8% Now married0.8% Separated7.2% Widowed14.4% DivorcedWomen who gave birth in the past 12 months Now married:
100.0% (45)Unmarried:
0.0% (0)
Women who did not give birth in the past 12 months Now married:
35.0% (172)Unmarried:
65.0% (321)
Marital status - Hispanic or Latino population 15 years and over
Males 32.6% Never married62.6% Now married0.0% Separated1.8% Widowed3.0% DivorcedFemales 29.0% Never married53.7% Now married0.8% Separated5.0% Widowed11.5% DivorcedWomen who gave birth in the past 12 months Now married:
72.2% (38)Unmarried:
27.8% (15)
Women who did not give birth in the past 12 months Now married:
52.8% (1,449)Unmarried:
47.2% (1,297)
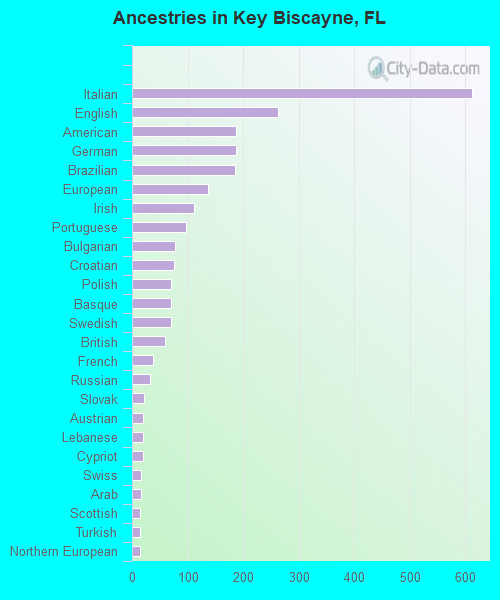
Ancestries in Key Biscayne
612 6.3% Italian263 2.7% English188 1.9% American187 1.9% German185 1.9% Brazilian136 1.4% European111 1.1% Irish97 1.0% Portuguese77 0.8% Bulgarian75 0.8% Croatian71 0.7% Polish70 0.7% Basque70 0.7% Swedish59 0.6% British38 0.4% French33 0.3% Russian21 0.2% Slovak20 0.2% Austrian19 0.2% Lebanese19 0.2% Cypriot17 0.2% Swiss16 0.2% Arab15 0.2% Scottish15 0.2% Turkish14 0.1% Northern European11 0.1% Ukrainian11 0.1% Jamaican10 0.1% Greek8 0.08% Armenian8 0.08% Canadian8 0.08% French Canadian7 0.07% Lithuanian6 0.06% Hungarian5 0.05% Eastern European4 0.04% Scotch-Irish
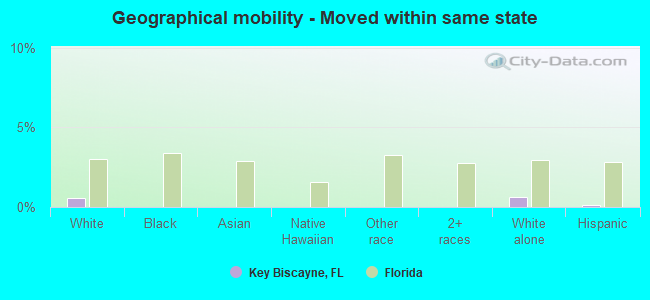
Geographical mobility in Key Biscayne Same house 1 year ago 3,607 80.0% White (Caucasian)86 100.0% Black or African American31 85.9% Asian14 100.0% Native Hawaiian / Pacific Islander341 68.2% Other race8,364 84.9% Two or more races2,497 81.6% White alone, not Hispanic / Latino8,926 82.3% Hispanic or LatinoMoved within same county 312 6.9% White / Caucasian123 24.7% Other race343 3.5% Two or more races206 6.7% White alone, not Hispanic / Latino580 5.3% Hispanic or LatinoMoved within same state 26 0.6% White / Caucasian19 0.6% White alone, not Hispanic / Latino17 0.2% Hispanic or LatinoMoved from different state 282 6.3% White / Caucasian36 0.4% Two or more races232 7.6% White alone, not Hispanic / Latino107 1.0% Hispanic or LatinoMoved from abroad 490 10.9% White6 17.9% Asian1,437 14.6% Two or more races130 4.2% White alone, not Hispanic / Latino2,031 18.7% Hispanic or Latino
Children Nativity (place of birth) in Key Biscayne
Children under 6 years - Living with two parents Both parents native 32 100.0% NativeBoth parents foreign-born 223 51.3% Native212 48.7% Foreign-bornOne native, one foreign-born parent 208 100.0% NativeChildren under 6 years - Living with one parent Foreign-born parent 46 100.0% NativeChildren 6 to 17 years - Living with two parents Both parents native 344 96.9% Native11 3.1% Foreign-bornBoth parents foreign-born 816 39.5% Native1,248 60.5% Foreign-bornOne native, one foreign-born parent 653 92.7% Native51 7.3% Foreign-bornChildren 6 to 17 years - Living with one parent Native parent 122 100.0% NativeForeign-born parent 319 60.8% Native205 39.2% Foreign-born