Races in Key West, Florida (FL) Detailed Stats
Data:
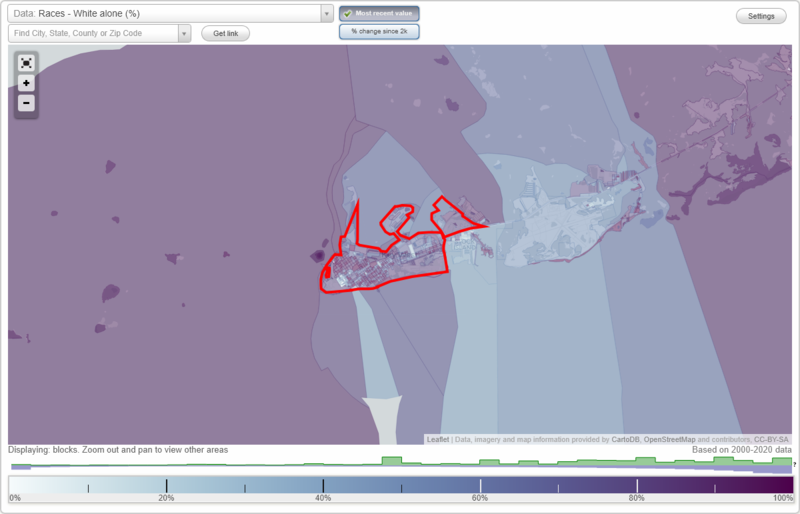
Races - White alone (%)
Races - White alone (% change since 2000)
Races - Black alone (%)
Races - Black alone (% change since 2000)
Races - American Indian alone (%)
Races - American Indian alone (% change since 2000)
Races - Asian alone (%)
Races - Asian alone (% change since 2000)
Races - Hispanic (%)
Races - Hispanic (% change since 2000)
Races - Native Hawaiian and Other Pacific Islander alone (%)
Races - Native Hawaiian and Other Pacific Islander alone (% change since 2000)
Races - Two or more races(%)
Races - Two or more races(% change since 2000)
Races - Other race alone (%)
Races - Other race alone (% change since 2000)
Racial diversity
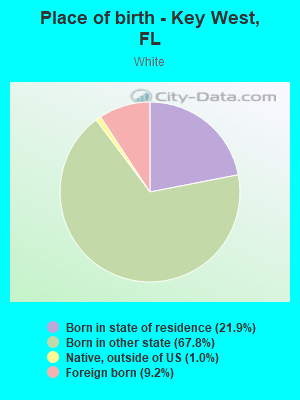
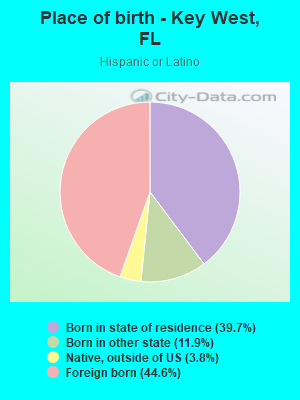
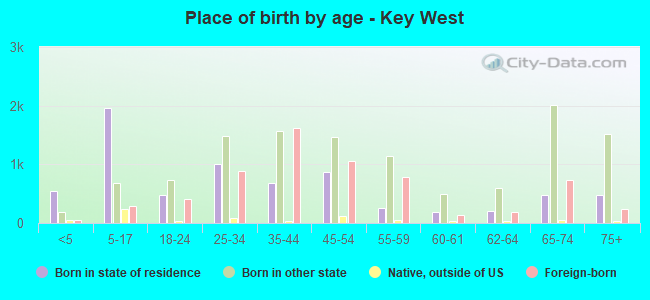
Place of birth - Born in state of residence (%)
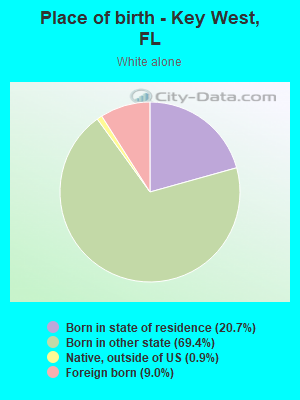
Place of birth - Born in state of residence (%) - White
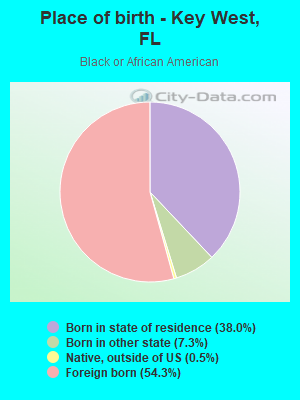
Place of birth - Born in state of residence (%) - Black or African American
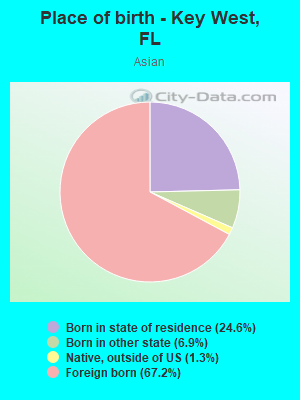
Place of birth - Born in state of residence (%) - Asian
Place of birth - Born in state of residence (%) - Hispanic or Latino
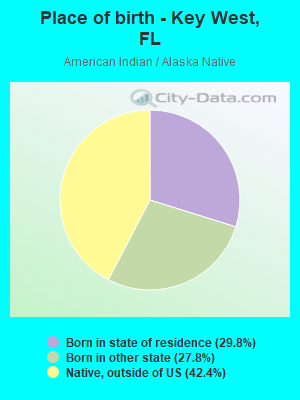
Place of birth - Born in state of residence (%) - American Indian and Alaska Native
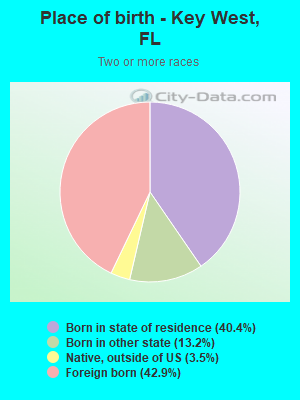
Place of birth - Born in state of residence (%) - Multirace
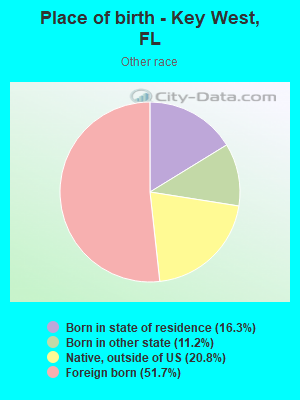
Place of birth - Born in state of residence (%) - Other Race
Place of birth - Born in other state (%)
Place of birth - Born in other state (%) - White
Place of birth - Born in other state (%) - Black or African American
Place of birth - Born in other state (%) - Asian
Place of birth - Born in other state (%) - Hispanic or Latino
Place of birth - Born in other state (%) - American Indian and Alaska Native
Place of birth - Born in other state (%) - Multirace
Place of birth - Born in other state (%) - Other Race
Place of birth - Native, outside of US (%)
Place of birth - Native, outside of US (%) - White
Place of birth - Native, outside of US (%) - Black or African American
Place of birth - Native, outside of US (%) - Asian
Place of birth - Native, outside of US (%) - Hispanic or Latino
Place of birth - Native, outside of US (%) - American Indian and Alaska Native
Place of birth - Native, outside of US (%) - Multirace
Place of birth - Native, outside of US (%) - Other Race
Place of birth - Foreign born (%)
Place of birth - Foreign born (%) - White
Place of birth - Foreign born (%) - Black or African American
Place of birth - Foreign born (%) - Asian
Place of birth - Foreign born (%) - Hispanic or Latino
Place of birth - Foreign born (%) - American Indian and Alaska Native
Place of birth - Foreign born (%) - Multirace
Place of birth - Foreign born (%) - Other Race
Residents speaking English at home (%)
Residents speaking English at home - Born in the United States (%)
Residents speaking English at home - Native, born elsewhere (%)
Residents speaking English at home - Foreign born (%)
Residents speaking Spanish at home (%)
Residents speaking Spanish at home - Born in the United States (%)
Residents speaking Spanish at home - Native, born elsewhere (%)
Residents speaking Spanish at home - Foreign born (%)
Residents speaking other language at home (%)
Residents speaking other language at home - Born in the United States (%)
Residents speaking other language at home - Native, born elsewhere (%)
Residents speaking other language at home - Foreign born (%)
Marital status - Never married (%)
Marital status - Now married (%)
Marital status - Separated (%)
Marital status - Widowed (%)
Marital status - Divorced (%)
Ancestries Reported - Arab (%)
Ancestries Reported - Czech (%)
Ancestries Reported - Danish (%)
Ancestries Reported - Dutch (%)
Ancestries Reported - English (%)
Ancestries Reported - French (%)
Ancestries Reported - French Canadian (%)
Ancestries Reported - German (%)
Ancestries Reported - Greek (%)
Ancestries Reported - Hungarian (%)
Ancestries Reported - Irish (%)
Ancestries Reported - Italian (%)
Ancestries Reported - Lithuanian (%)
Ancestries Reported - Norwegian (%)
Ancestries Reported - Polish (%)
Ancestries Reported - Portuguese (%)
Ancestries Reported - Russian (%)
Ancestries Reported - Scotch-Irish (%)
Ancestries Reported - Scottish (%)
Ancestries Reported - Slovak (%)
Ancestries Reported - Subsaharan African (%)
Ancestries Reported - Swedish (%)
Ancestries Reported - Swiss (%)
Ancestries Reported - Ukrainian (%)
Ancestries Reported - United States (%)
Ancestries Reported - Welsh (%)
Ancestries Reported - West Indian (%)
Ancestries Reported - Other (%)
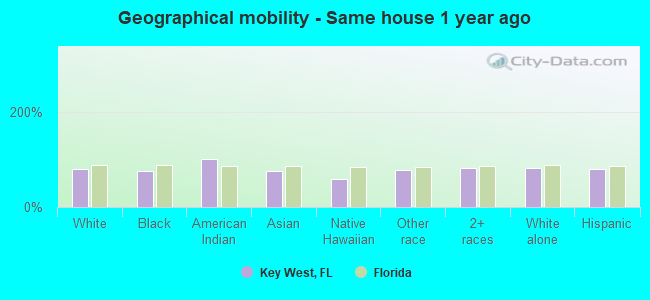
Geographical mobility - Same house 1 year ago (%)
Geographical mobility - Same house 1 year ago (%) - White
Geographical mobility - Same house 1 year ago (%) - Black or African American
Geographical mobility - Same house 1 year ago (%) - Asian
Geographical mobility - Same house 1 year ago (%) - Hispanic or Latino
Geographical mobility - Same house 1 year ago (%) - American Indian and Alaska Native
Geographical mobility - Same house 1 year ago (%) - Multirace
Geographical mobility - Same house 1 year ago (%) - Other Race
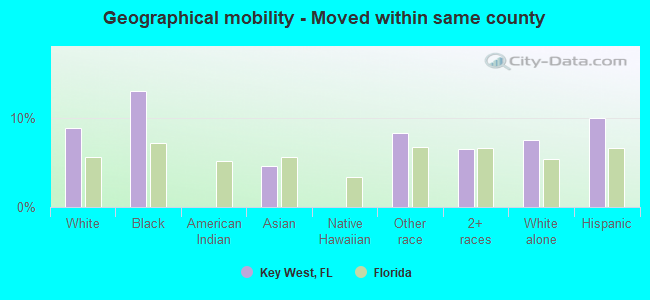
Geographical mobility - Moved within same county (%)
Geographical mobility - Moved within same county (%) - White
Geographical mobility - Moved within same county (%) - Black or African American
Geographical mobility - Moved within same county (%) - Asian
Geographical mobility - Moved within same county (%) - Hispanic or Latino
Geographical mobility - Moved within same county (%) - American Indian and Alaska Native
Geographical mobility - Moved within same county (%) - Multirace
Geographical mobility - Moved within same county (%) - Other Race
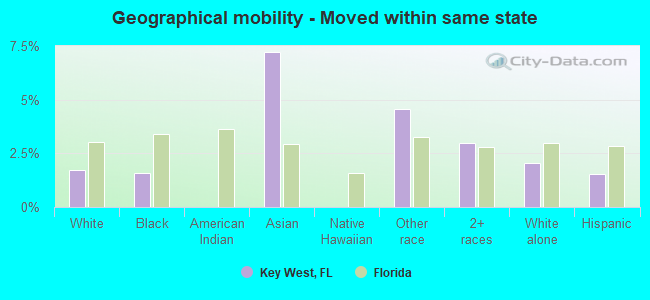
Geographical mobility - Moved from different county within same state (%)
Geographical mobility - Moved from different county within same state (%) - White
Geographical mobility - Moved from different county within same state (%) - Black or African American
Geographical mobility - Moved from different county within same state (%) - Asian
Geographical mobility - Moved from different county within same state (%) - Hispanic or Latino
Geographical mobility - Moved from different county within same state (%) - American Indian and Alaska Native
Geographical mobility - Moved from different county within same state (%) - Multirace
Geographical mobility - Moved from different county within same state (%) - Other Race
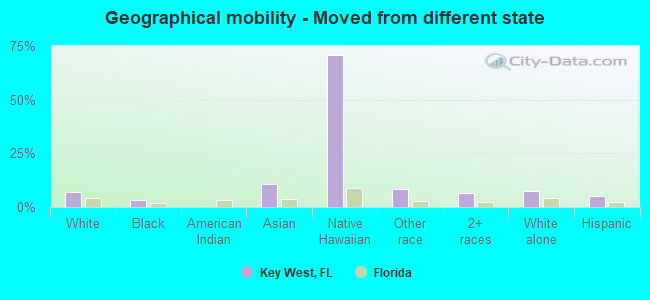
Geographical mobility - Moved from different state (%)
Geographical mobility - Moved from different state (%) - White
Geographical mobility - Moved from different state (%) - Black or African American
Geographical mobility - Moved from different state (%) - Asian
Geographical mobility - Moved from different state (%) - Hispanic or Latino
Geographical mobility - Moved from different state (%) - American Indian and Alaska Native
Geographical mobility - Moved from different state (%) - Multirace
Geographical mobility - Moved from different state (%) - Other Race
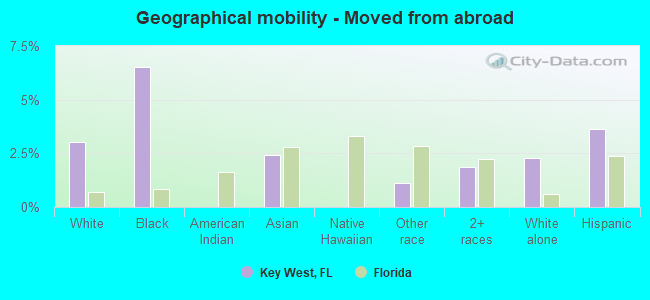
Geographical mobility - Moved from abroad (%)
Geographical mobility - Moved from abroad (%) - White
Geographical mobility - Moved from abroad (%) - Black or African American
Geographical mobility - Moved from abroad (%) - Asian
Geographical mobility - Moved from abroad (%) - Hispanic or Latino
Geographical mobility - Moved from abroad (%) - American Indian and Alaska Native
Geographical mobility - Moved from abroad (%) - Multirace
Geographical mobility - Moved from abroad (%) - Other Race
Place of birth for the foreign-born population - Ireland (%)
Place of birth for the foreign-born population - Denmark (%)
Place of birth for the foreign-born population - Norway (%)
Place of birth for the foreign-born population - Sweden (%)
Place of birth for the foreign-born population - United Kingdom (%)
Place of birth for the foreign-born population - England (%)
Place of birth for the foreign-born population - Scotland (%)
Place of birth for the foreign-born population - Other Northern Europe (%)
Place of birth for the foreign-born population - Austria (%)
Place of birth for the foreign-born population - Belgium (%)
Place of birth for the foreign-born population - France (%)
Place of birth for the foreign-born population - Germany (%)
Place of birth for the foreign-born population - Netherlands (%)
Place of birth for the foreign-born population - Switzerland (%)
Place of birth for the foreign-born population - Other Western Europe (%)
Place of birth for the foreign-born population - Greece (%)
Place of birth for the foreign-born population - Italy (%)
Place of birth for the foreign-born population - Portugal (%)
Place of birth for the foreign-born population - Spain (%)
Place of birth for the foreign-born population - Other Southern Europe (%)
Place of birth for the foreign-born population - Albania (%)
Place of birth for the foreign-born population - Belarus (%)
Place of birth for the foreign-born population - Bosnia and Herzegovina (%)
Place of birth for the foreign-born population - Bulgaria (%)
Place of birth for the foreign-born population - Croatia (%)
Place of birth for the foreign-born population - Czechoslovakia (%)
Place of birth for the foreign-born population - Hungary (%)
Place of birth for the foreign-born population - Latvia (%)
Place of birth for the foreign-born population - Lithuania (%)
Place of birth for the foreign-born population - North Macedonia (Macedonia) (%)
Place of birth for the foreign-born population - Moldova (%)
Place of birth for the foreign-born population - Poland (%)
Place of birth for the foreign-born population - Romania (%)
Place of birth for the foreign-born population - Russia (%)
Place of birth for the foreign-born population - Serbia (%)
Place of birth for the foreign-born population - Ukraine (%)
Place of birth for the foreign-born population - Other Eastern Europe (%)
Place of birth for the foreign-born population - China (%)
Place of birth for the foreign-born population - Hong Kong (%)
Place of birth for the foreign-born population - Taiwan (%)
Place of birth for the foreign-born population - Japan (%)
Place of birth for the foreign-born population - Korea (%)
Place of birth for the foreign-born population - Other Eastern Asia (%)
Place of birth for the foreign-born population - Afghanistan (%)
Place of birth for the foreign-born population - Bangladesh (%)
Place of birth for the foreign-born population - India (%)
Place of birth for the foreign-born population - Iran (%)
Place of birth for the foreign-born population - Kazakhstan (%)
Place of birth for the foreign-born population - Nepal (%)
Place of birth for the foreign-born population - Pakistan (%)
Place of birth for the foreign-born population - Sri Lanka (%)
Place of birth for the foreign-born population - Uzbekistan (%)
Place of birth for the foreign-born population - Other South Central Asia (%)
Place of birth for the foreign-born population - Burma (%)
Place of birth for the foreign-born population - Cambodia (%)
Place of birth for the foreign-born population - Indonesia (%)
Place of birth for the foreign-born population - Laos (%)
Place of birth for the foreign-born population - Malaysia (%)
Place of birth for the foreign-born population - Philippines (%)
Place of birth for the foreign-born population - Singapore (%)
Place of birth for the foreign-born population - Thailand (%)
Place of birth for the foreign-born population - Vietnam (%)
Place of birth for the foreign-born population - Other South Eastern Asia (%)
Place of birth for the foreign-born population - Armenia (%)
Place of birth for the foreign-born population - Iraq (%)
Place of birth for the foreign-born population - Israel (%)
Place of birth for the foreign-born population - Jordan (%)
Place of birth for the foreign-born population - Kuwait (%)
Place of birth for the foreign-born population - Lebanon (%)
Place of birth for the foreign-born population - Saudi Arabia (%)
Place of birth for the foreign-born population - Syria (%)
Place of birth for the foreign-born population - Turkey (%)
Place of birth for the foreign-born population - Yemen (%)
Place of birth for the foreign-born population - Other Western Asia (%)
Place of birth for the foreign-born population - Eritrea (%)
Place of birth for the foreign-born population - Ethiopia (%)
Place of birth for the foreign-born population - Kenya (%)
Place of birth for the foreign-born population - Somalia (%)
Place of birth for the foreign-born population - Uganda (%)
Place of birth for the foreign-born population - Zimbabwe (%)
Place of birth for the foreign-born population - Other Eastern Africa (%)
Place of birth for the foreign-born population - Cameroon (%)
Place of birth for the foreign-born population - Congo (%)
Place of birth for the foreign-born population - Democratic Republic of Congo (Zaire) (%)
Place of birth for the foreign-born population - Other Middle Africa (%)
Place of birth for the foreign-born population - Egypt (%)
Place of birth for the foreign-born population - Morocco (%)
Place of birth for the foreign-born population - Sudan (%)
Place of birth for the foreign-born population - Other Northern Africa (%)
Place of birth for the foreign-born population - South Africa (%)
Place of birth for the foreign-born population - Other Southern Africa (%)
Place of birth for the foreign-born population - Cabo Verde (%)
Place of birth for the foreign-born population - Ghana (%)
Place of birth for the foreign-born population - Liberia (%)
Place of birth for the foreign-born population - Nigeria (%)
Place of birth for the foreign-born population - Senegal (%)
Place of birth for the foreign-born population - Sierra Leone (%)
Place of birth for the foreign-born population - Other Western Africa (%)
Place of birth for the foreign-born population - Australia (%)
Place of birth for the foreign-born population - New Zealand (%)
Place of birth for the foreign-born population - Fiji (%)
Place of birth for the foreign-born population - Micronesia (%)
Place of birth for the foreign-born population - Bahamas (%)
Place of birth for the foreign-born population - Barbados (%)
Place of birth for the foreign-born population - Cuba (%)
Place of birth for the foreign-born population - Dominica (%)
Place of birth for the foreign-born population - Dominican Republic (%)
Place of birth for the foreign-born population - Grenada (%)
Place of birth for the foreign-born population - Haiti (%)
Place of birth for the foreign-born population - Jamaica (%)
Place of birth for the foreign-born population - St. Vincent and the Grenadines (%)
Place of birth for the foreign-born population - Trinidad and Tobago (%)
Place of birth for the foreign-born population - West Indies (%)
Place of birth for the foreign-born population - Other Caribbean (%)
Place of birth for the foreign-born population - Belize (%)
Place of birth for the foreign-born population - Costa Rica (%)
Place of birth for the foreign-born population - El Salvador (%)
Place of birth for the foreign-born population - Guatemala (%)
Place of birth for the foreign-born population - Honduras (%)
Place of birth for the foreign-born population - Mexico (%)
Place of birth for the foreign-born population - Nicaragua (%)
Place of birth for the foreign-born population - Panama (%)
Place of birth for the foreign-born population - Other Central America (%)
Place of birth for the foreign-born population - Argentina (%)
Place of birth for the foreign-born population - Bolivia (%)
Place of birth for the foreign-born population - Brazil (%)
Place of birth for the foreign-born population - Chile (%)
Place of birth for the foreign-born population - Colombia (%)
Place of birth for the foreign-born population - Ecuador (%)
Place of birth for the foreign-born population - Guyana (%)
Place of birth for the foreign-born population - Peru (%)
Place of birth for the foreign-born population - Uruguay (%)
Place of birth for the foreign-born population - Venezuela (%)
Place of birth for the foreign-born population - Other South America (%)
Place of birth for the foreign-born population - Canada (%)
Place of birth for the foreign-born population - Other Northern America (%)
Place of birth for the foreign-born population - Other (%)
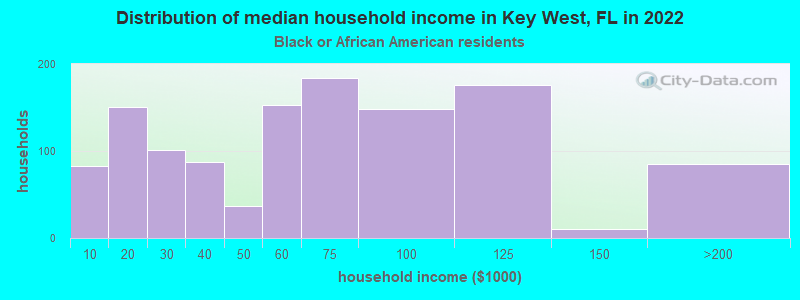
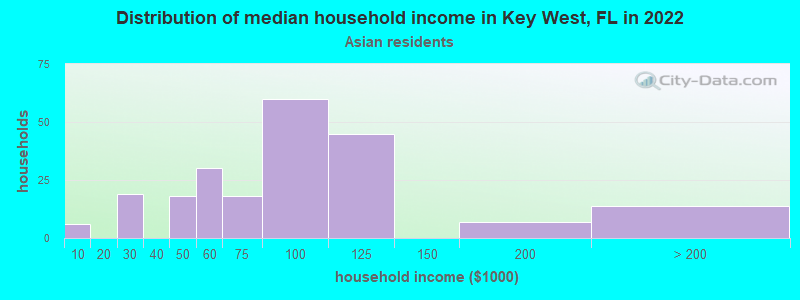
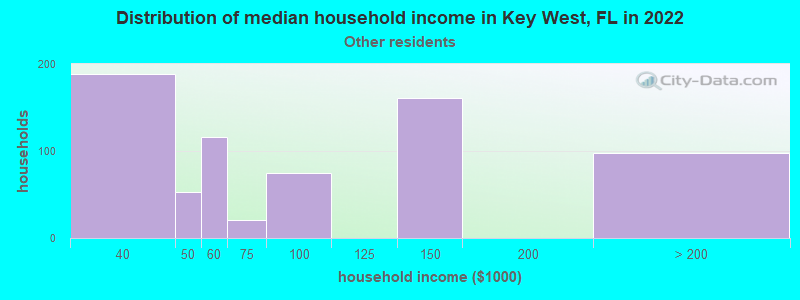
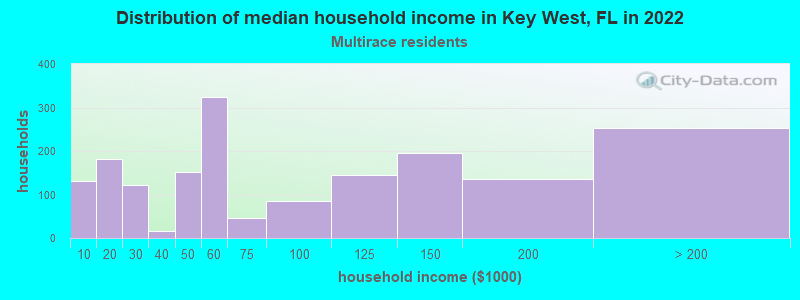
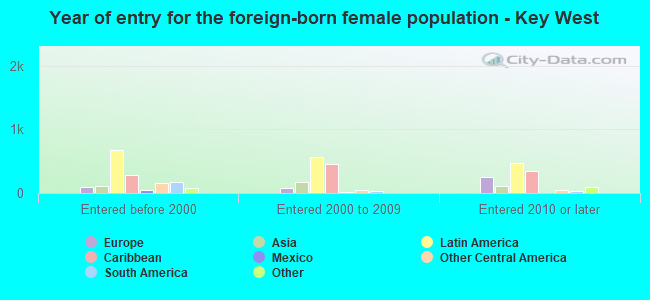
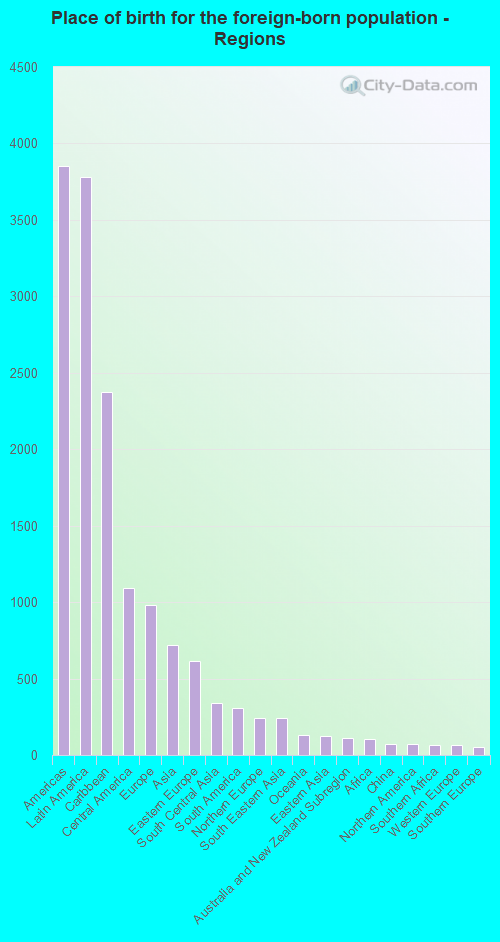
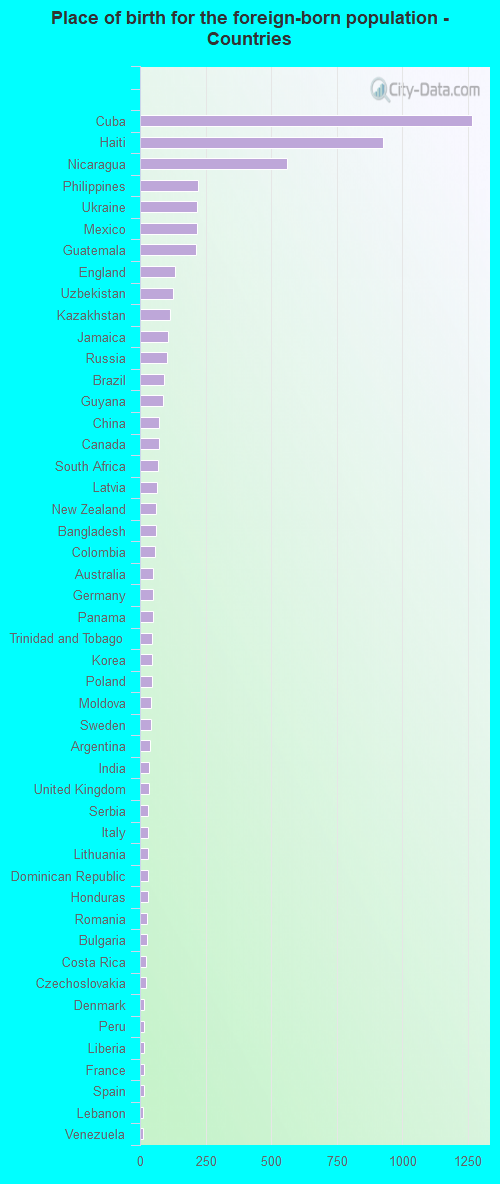
According to 2022 data, the most numerous races in Key West, FL are White alone (15,014 residents), Hispanic (6,113 residents), and Black alone (3,278 residents). 78.8% of Key West residents speak English at home. 22.3% of Key West, FL residents are foreign-born (13.8% born in Latin America, 3.6% born in Europe, 2.6% born in Asia), which is 5.9% greater than the foreign-born rate of 21.0% across the entire state of Florida.
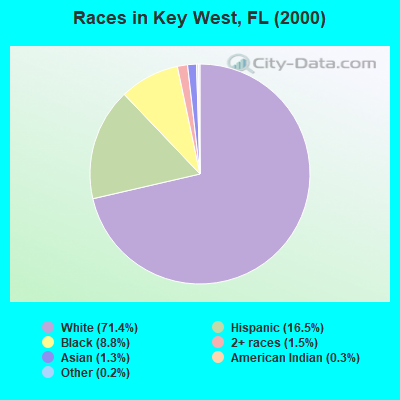
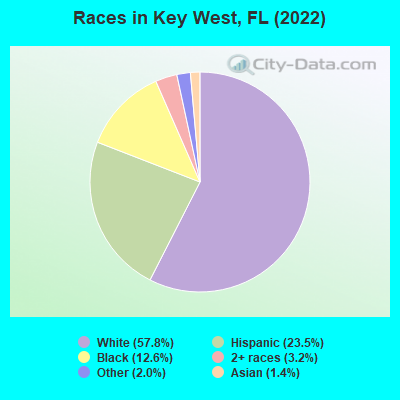
Race distribution in Key West
2000 2022
10,458,509 65.4% White alone 2,682,715 16.8% Hispanic 2,264,268 14.2% Black alone 261,693 1.6% Asian alone 236,954 1.5% Two or more races 42,358 0.3% American Indian alone 28,994 0.2% Other race alone 6,887 0.04% Native Hawaiian and Other
11,309,403 50.8% White alone 6,025,039 27.1% Hispanic 3,241,015 14.6% Black alone 861,630 3.9% Two or more races 623,692 2.8% Asian alone 152,054 0.7% Other race alone 22,504 0.1% American Indian alone 9,486 0.04% Native Hawaiian and Other
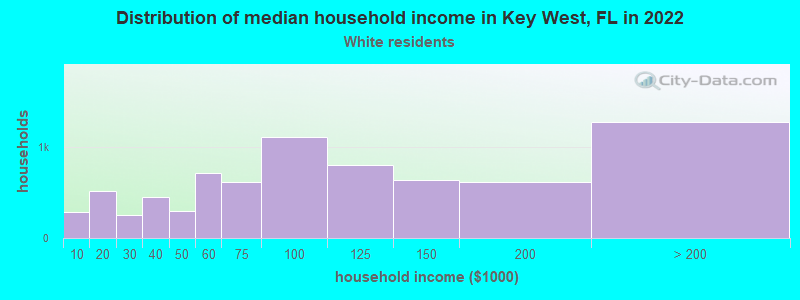
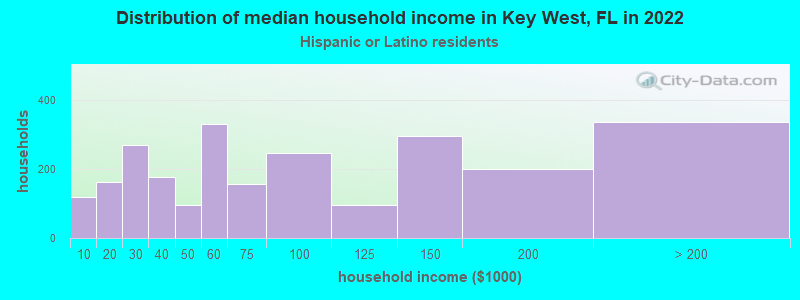
Income and house value in Key West Median household income in 2022 $85,225 White non-Hispanic householders$60,926 Black householders$81,104 Asian householders$59,204 Two or more races householders$65,566 Hispanic or Latino race householdersMedian 2022 house value $900,683 White Non-Hispanic householders$859,818 Black or African American householders$747,523 American Indian or Alaska Native householders $493,033 Asian householders$747,523 Some other race householders$646,525 Two or more races householders$847,526 Hispanic or Latino householders
Median age by race in Key West
52.2 Median age for White residents52.6 51.4 37.6 Median age for Black or African American residents40.7 31.3 21.1 Median age for American Indian / Alaska Native residents-611,418,047.3 16.9 33.0 Median age for Asian residents36.0 36.0 -679,849,340.2 Median age for Native Hawaiian / Pacific Islander residents-858,307,848.3 -666,666,666.0 36.4 Median age for Other race residents35.2 47.9 43.0 Median age for Two or more races residents45.0 42.1 51.8 Median age for White alone residents52.0 51.5 42.6 Median age for Hispanic or Latino residents43.0 43.4
Owner/renter occupied households by race in Key West
House owners and renters - White residents 4,179 56.5% Owner occupied3,212 43.5% Renter occupiedHouse owners and renters - Black or African American residents 181 15.0% Owner occupied1,027 85.0% Renter occupiedHouse owners and renters - American Indian / Alaska Native residents 8 41.8% Owner occupied11 58.2% Renter occupiedHouse owners and renters - Asian residents 88 39.8% Owner occupied133 60.2% Renter occupiedHouse owners and renters - Other race residents 155 30.4% Owner occupied355 69.6% Renter occupiedHouse owners and renters - Two or more races residents 726 36.7% Owner occupied1,250 63.3% Renter occupiedHouse owners and renters - White alone residents 3,989 55.9% Owner occupied3,152 44.1% Renter occupiedHouse owners and renters - Hispanic or Latino residents 765 30.4% Owner occupied1,751 69.6% Renter occupied
Language usage in Key West
English speakers - Total 78.8% of residents of Key West speak English at home.
13.5% of residents speak Spanish at home 1,759 51.8% Speak English very well1,637 48.2% Speak English less than very well8.2% of residents speak other language at home 1,084 52.3% Speak English very well989 47.7% Speak English less than very well
English speakers - Born in the United States 96.5% of residents of Key West speak English at home.
4.3% of residents speak Spanish at home 383 75.5% Speak English very well124 24.5% Speak English less than very well1.7% of residents speak other language at home 203 100.0% Speak English very well
English speakers - Native, born elsewhere 60.7% of residents of Key West speak English at home.
44.4% of residents speak Spanish at home 206 90.0% Speak English very well23 10.0% Speak English less than very well
English speakers - Foreign-born 43.2% of residents of Key West speak English at home.
31.2% of residents speak Spanish at home 634 32.4% Speak English very well1,324 67.6% Speak English less than very well28.2% of residents speak other language at home 787 44.5% Speak English very well981 55.5% Speak English less than very well
White (Caucasian) - Speak only English Native:
95.1% (13,059)Foreign-born:
57.3% (829)
White (Caucasian) - Speak another language Native:
4.2% (583)Foreign-born:
48.9% (708)
Black or African American - Speak only English Native:
90.8% (2,047)Foreign-born:
49.3% (584)
Black or African American - Speak another language Native:
9.2% (209)Foreign-born:
50.3% (596)
Asian - Speak only English Native:
63.5% (90)Foreign-born:
39.2% (125)
Asian - Speak another language Native:
36.6% (52)Foreign-born:
60.3% (192)
Other race - Speak only English Native:
58.7% (426)Foreign-born:
28.7% (243)
Other race - Speak another language Native:
40.6% (295)Foreign-born:
71.7% (607)
Two or more races - Speak only English Native:
81.1% (2,030)Foreign-born:
47.0% (992)
Two or more races - Speak another language Native:
17.1% (427)Foreign-born:
52.5% (1,110)
White alone - Speak only English Native:
98.0% (12,880)Foreign-born:
56.5% (761)
White alone - Speak another language Native:
2.0% (263)Foreign-born:
43.1% (582)
Hispanic or Latino - Speak only English Native:
60.8% (1,982)Foreign-born:
33.2% (881)
Hispanic or Latino - Speak another language Native:
37.3% (1,216)Foreign-born:
68.1% (1,804)
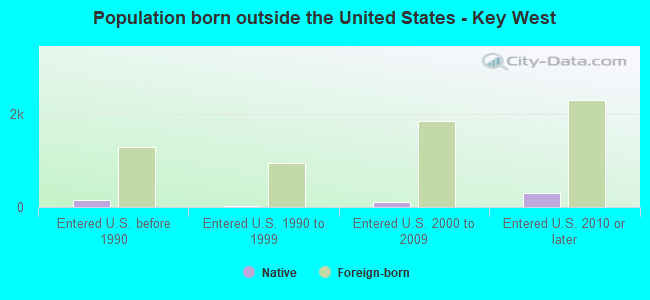
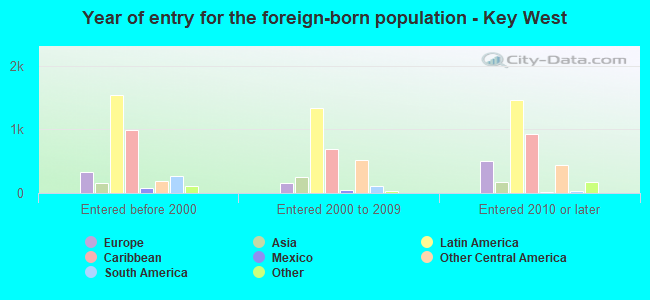
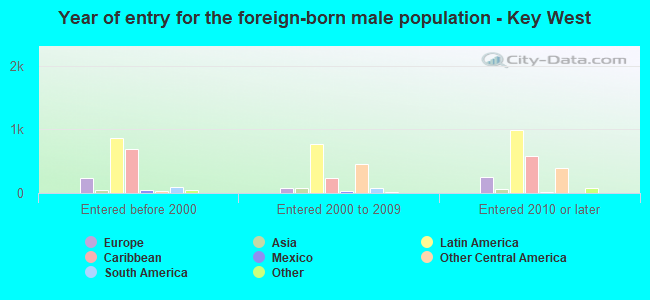
Foreign-born residents in Key West 5,797 residents are foreign born (13.8% Latin America , 3.6% Europe , 2.6% Asia ).
This city:
22.3%Florida:
21.1%
Marital status for residents in Key West Marital status - White (Caucasian) population 15 years and over
Males 34.1% Never married44.7% Now married0.9% Separated3.9% Widowed16.4% DivorcedFemales 27.1% Never married46.9% Now married2.7% Separated6.4% Widowed16.9% DivorcedWomen who gave birth in the past 12 months Now married:
63.4% (85)Unmarried:
36.6% (49)
Women who did not give birth in the past 12 months Now married:
45.9% (1,289)Unmarried:
54.1% (1,519)
Marital status - Black or African American population 15 years and over
Males 48.5% Never married27.9% Now married4.5% Separated1.6% Widowed17.5% DivorcedFemales 43.1% Never married24.8% Now married2.6% Separated15.0% Widowed14.5% DivorcedWomen who gave birth in the past 12 months Now married:
100.0% (55)Unmarried:
0.0% (0)
Women who did not give birth in the past 12 months Now married:
35.0% (199)Unmarried:
65.0% (370)
Marital status - American Indian / Alaska Native population 15 years and over
Males 100.0% Never married0.0% Now married0.0% Separated0.0% Widowed0.0% DivorcedFemales 84.0% Never married16.0% Now married0.0% Separated0.0% Widowed0.0% DivorcedWomen who did not give birth in the past 12 months Now married:
0.0% (0)Unmarried:
100.0% (25)
Marital status - Asian population 15 years and over
Males 37.4% Never married45.6% Now married0.0% Separated0.0% Widowed17.0% DivorcedFemales 30.3% Never married56.7% Now married0.0% Separated0.0% Widowed13.0% DivorcedWomen who did not give birth in the past 12 months Now married:
47.5% (97)Unmarried:
52.5% (108)
Marital status - Other race population 15 years and over
Males 21.0% Never married55.8% Now married0.0% Separated0.0% Widowed23.2% DivorcedFemales 16.1% Never married43.7% Now married3.0% Separated0.0% Widowed37.2% DivorcedWomen who gave birth in the past 12 months Now married:
100.0% (42)Unmarried:
0.0% (0)
Women who did not give birth in the past 12 months Now married:
65.1% (201)Unmarried:
34.9% (107)
Marital status - Two or more races population 15 years and over
Males 30.7% Never married52.4% Now married2.3% Separated4.5% Widowed10.1% DivorcedFemales 23.8% Never married49.3% Now married0.3% Separated8.6% Widowed18.1% DivorcedWomen who gave birth in the past 12 months Now married:
100.0% (30)Unmarried:
0.0% (0)
Women who did not give birth in the past 12 months Now married:
50.2% (538)Unmarried:
49.8% (533)
Marital status - White alone, not Hispanic / Latino population 15 years and over
Males 34.6% Never married43.9% Now married0.9% Separated4.0% Widowed16.5% DivorcedFemales 26.8% Never married46.2% Now married2.1% Separated6.8% Widowed18.1% DivorcedWomen who gave birth in the past 12 months Now married:
85.2% (99)Unmarried:
14.8% (17)
Women who did not give birth in the past 12 months Now married:
43.3% (1,173)Unmarried:
56.7% (1,535)
Marital status - Hispanic or Latino population 15 years and over
Males 32.8% Never married46.2% Now married2.3% Separated3.4% Widowed15.4% DivorcedFemales 24.6% Never married44.4% Now married3.1% Separated9.8% Widowed18.0% DivorcedWomen who gave birth in the past 12 months Now married:
40.8% (26)Unmarried:
59.2% (38)
Women who did not give birth in the past 12 months Now married:
56.0% (712)Unmarried:
44.0% (558)
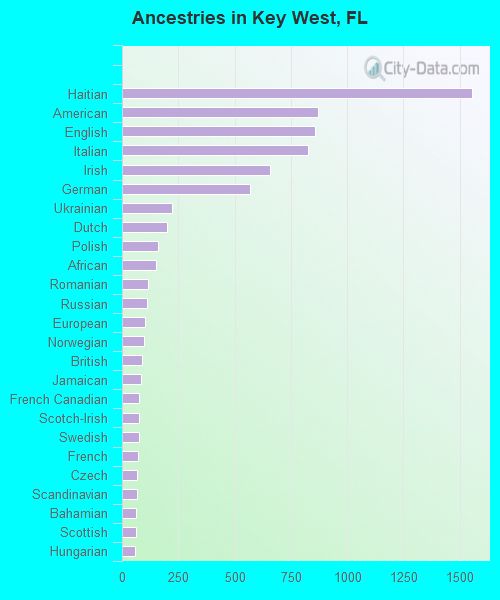
Ancestries in Key West
1,553 11.4% Haitian872 6.4% American858 6.3% English827 6.1% Italian656 4.8% Irish570 4.2% German224 1.6% Ukrainian201 1.5% Dutch159 1.2% Polish153 1.1% African114 0.8% Romanian112 0.8% Russian102 0.8% European99 0.7% Norwegian88 0.6% British83 0.6% Jamaican75 0.6% French Canadian74 0.5% Scotch-Irish74 0.5% Swedish73 0.5% French68 0.5% Czech68 0.5% Scandinavian61 0.4% Bahamian60 0.4% Scottish59 0.4% Hungarian42 0.3% Guyanese39 0.3% Eastern European39 0.3% Greek37 0.3% Latvian35 0.3% Portuguese31 0.2% Australian28 0.2% Bulgarian27 0.2% Alsatian25 0.2% Lithuanian19 0.1% Austrian19 0.1% Serbian18 0.1% Czechoslovakian15 0.1% Lebanese12 0.09% Macedonian11 0.08% New Zealander9 0.07% Danish9 0.07% Welsh8 0.06% Celtic7 0.05% Armenian7 0.05% Croatian6 0.04% Canadian6 0.04% Finnish5 0.04% Icelander5 0.04% Sierra Leonean
Geographical mobility in Key West Same house 1 year ago 12,424 80.0% White (Caucasian)2,602 75.0% Black or African American60 100.0% American Indian / Alaska Native349 74.8% Asian12 59.5% Native Hawaiian / Pacific Islander1,242 77.6% Other race4,080 81.4% Two or more races12,105 81.2% White alone, not Hispanic / Latino4,875 79.4% Hispanic or LatinoMoved within same county 1,377 8.9% White / Caucasian449 12.9% Black or African American21 4.6% Asian133 8.3% Other race322 6.4% Two or more races1,114 7.5% White alone, not Hispanic / Latino610 9.9% Hispanic or LatinoMoved within same state 268 1.7% White / Caucasian56 1.6% Black or African American34 7.2% Asian73 4.6% Other race148 3.0% Two or more races304 2.0% White alone, not Hispanic / Latino95 1.6% Hispanic or LatinoMoved from different state 1,079 7.0% White / Caucasian112 3.2% Black or African American50 10.8% Asian14 70.7% Native Hawaiian / Pacific Islander136 8.5% Other race330 6.6% Two or more races1,085 7.3% White alone, not Hispanic / Latino328 5.3% Hispanic or LatinoMoved from abroad 467 3.0% White226 6.5% Black or African American11 2.4% Asian18 1.1% Other race94 1.9% Two or more races342 2.3% White alone, not Hispanic / Latino222 3.6% Hispanic or Latino
Children Nativity (place of birth) in Key West
Children under 6 years - Living with two parents Both parents native 541 100.0% NativeBoth parents foreign-born 155 68.9% Native70 31.1% Foreign-bornOne native, one foreign-born parent 132 100.0% NativeChildren under 6 years - Living with one parent Native parent 216 99.8% Native0 0.2% Foreign-bornForeign-born parent 144 88.6% Native18 11.4% Foreign-bornChildren 6 to 17 years - Living with two parents Both parents native 750 100.0% NativeBoth parents foreign-born 387 79.0% Native103 21.0% Foreign-bornOne native, one foreign-born parent 275 100.0% NativeChildren 6 to 17 years - Living with one parent Native parent 193 100.0% NativeForeign-born parent 581 57.3% Native434 42.7% Foreign-born
Grandparents responsible for own grandchildren in Key West
Grandparents (30 to 59 years) White / Caucasian 5 16.5% Responsible for grandchildren27 83.5% Not responsible for grandchildrenBlack or African American 13 100.0% Not responsible for grandchildrenOther race 17 100.0% Not responsible for grandchildrenWhite alone, not Hispanic / Latino 6 17.7% Responsible for grandchildren30 82.3% Not responsible for grandchildrenHispanic or Latino 20 100.0% Not responsible for grandchildren
Grandparents (60 years and over) White / Caucasian 133 100.0% Not responsible for grandchildrenBlack or African American 13 100.0% Responsible for grandchildrenWhite alone, not Hispanic / Latino 168 100.0% Not responsible for grandchildren