Races in Killington, Vermont (VT) Detailed Stats
Ancestries, Foreign-born residents, place of birth

Recent posts about races in Killington, Vermont on our local forum with over 2,400,000 registered users:
 | What I love about living in Vermont (52 replies) |
| NPR Brave Little State Why Do People Leave Vermont (83 replies) |
| What the HELL is up with Vermont's insane property taxes???? (59 replies) |
| Mountain Family considering moving from CO to VT (52 replies) |
| vacation itinerary recommendations (12 replies) |
| Are Social Conservatives Welcome in Vermont? (96 replies) |
Latest news about races in Killington, VT collected exclusively by city-data.com from local newspapers, TV, and radio stations
5.1% of Killington, VT residents are foreign-born (2.9% born in Europe, 1.0% born in Asia, 0.8% born in North America), which is 21.8% greater than the foreign-born rate of 4.0% across the entire state of Vermont.
Race distribution in Killington

- 1,06397.1%White alone
- 100.9%Two or more races
- 100.9%Hispanic
- 70.6%Asian alone
- 40.4%Black alone
- 10.09%American Indian alone
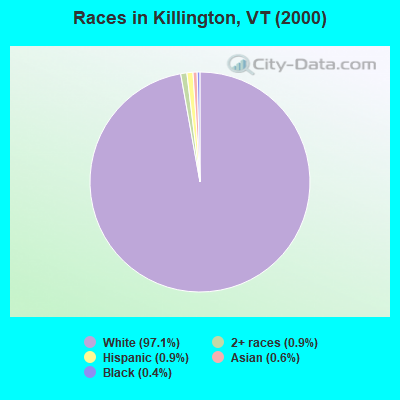
2000
2022
-
- 585,43196.2%White alone
- 6,8091.1%Two or more races
- 5,5040.9%Hispanic
- 5,1600.8%Asian alone
- 2,9210.5%Black alone
- 2,3250.4%American Indian alone
- 5570.09%Other race alone
- 1200.02%Native Hawaiian and Other
Pacific Islander alone

-
- 583,54690.2%White alone
- 27,3404.2%Two or more races
- 14,7702.3%Hispanic
- 11,5121.8%Asian alone
- 6,2641.0%Black alone
- 2,5210.4%Other race alone
- 1,0520.2%American Indian alone
- 590.01%Native Hawaiian and Other
Pacific Islander alone

Income and house value in Killington
- Median household income in 2022
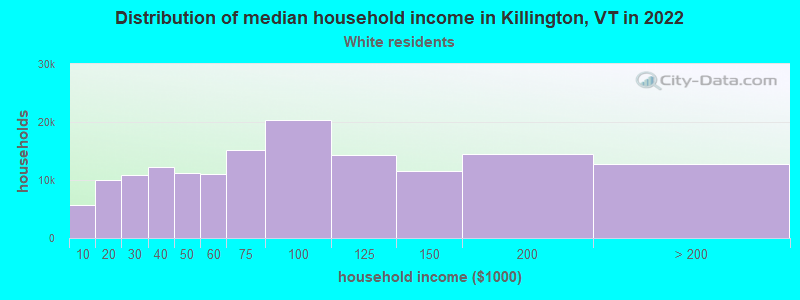
- $85,613White non-Hispanic householders
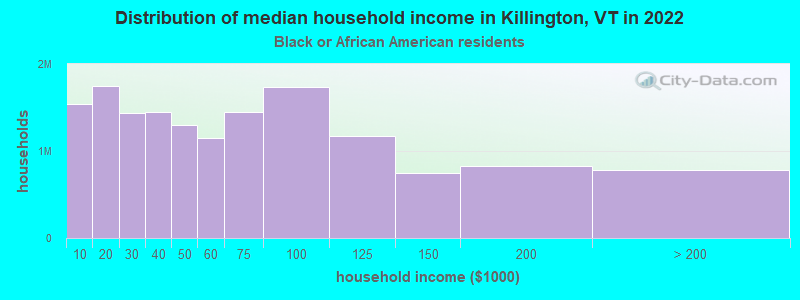
- $71,555Black householders
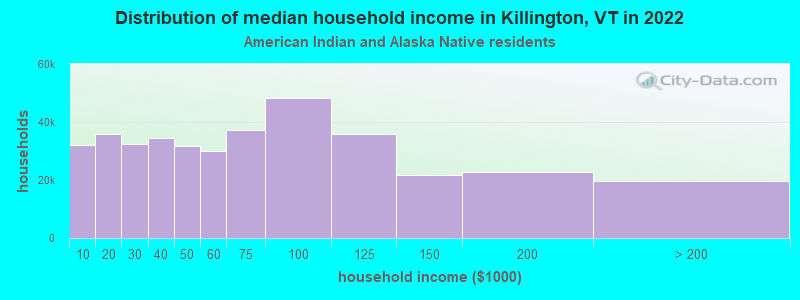
- $33,431American Indian and Alaska Native householders
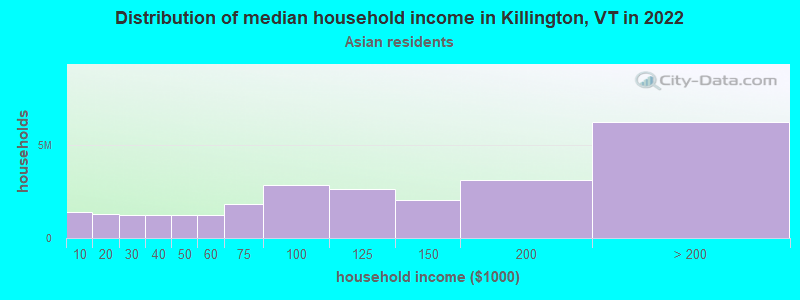
- over $200,000Asian householders
- Median 2022 house value
- $435,354White Non-Hispanic householders
- $819,655Asian householders
Household income for White non-Hispanic householders
Household income for Black householders
Household income for American Indian and Alaska Native householders
Household income for Asian householders
Foreign-born residents in Killington
56 residents are foreign born (2.9% Europe, 1.0% Asia, 0.8% North America).
| This city: | 5.1% |
| Vermont: | 3.8% |
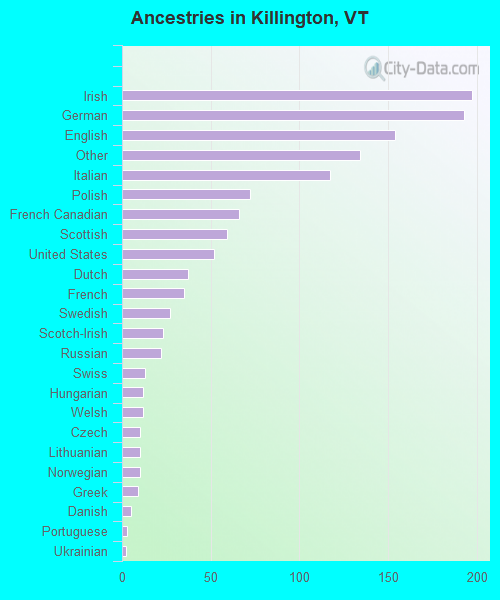
Ancestries in Killington

- 19715.5%Irish
- 19315.1%German
- 15412.1%English
- 13410.5%Other
- 1179.2%Italian
- 725.7%Polish
- 665.2%French Canadian
- 594.6%Scottish
- 524.1%United States
- 372.9%Dutch
- 352.7%French
- 272.1%Swedish
- 231.8%Scotch-Irish
- 221.7%Russian
- 131.0%Swiss
- 120.9%Hungarian
- 120.9%Welsh
- 100.8%Czech
- 100.8%Lithuanian
- 100.8%Norwegian
- 90.7%Greek
- 50.4%Danish
- 30.2%Portuguese
- 20.2%Ukrainian
Zip codes: 05751.