Races in Kings Grant, North Carolina (NC) Detailed Stats
Data:
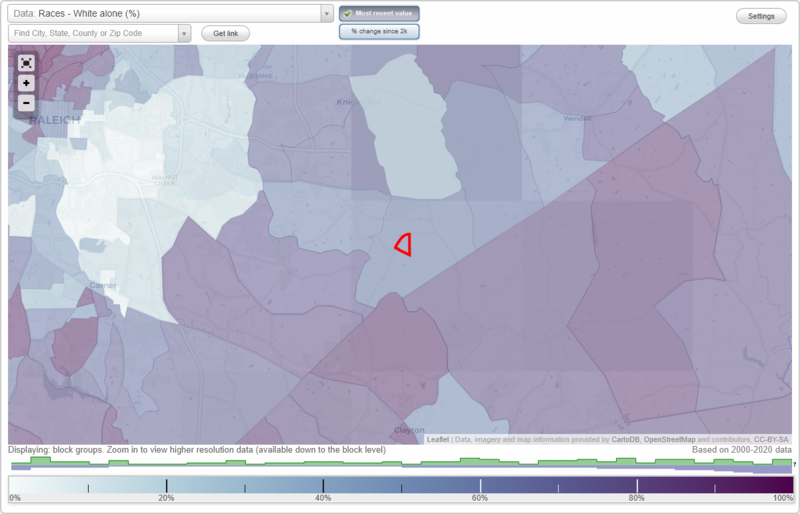
Races - White alone (%)
Races - White alone (% change since 2000)
Races - Black alone (%)
Races - Black alone (% change since 2000)
Races - American Indian alone (%)
Races - American Indian alone (% change since 2000)
Races - Asian alone (%)
Races - Asian alone (% change since 2000)
Races - Hispanic (%)
Races - Hispanic (% change since 2000)
Races - Native Hawaiian and Other Pacific Islander alone (%)
Races - Native Hawaiian and Other Pacific Islander alone (% change since 2000)
Races - Two or more races(%)
Races - Two or more races(% change since 2000)
Races - Other race alone (%)
Races - Other race alone (% change since 2000)
Racial diversity
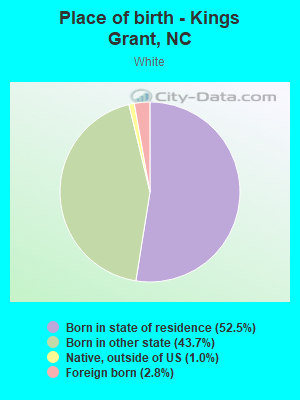
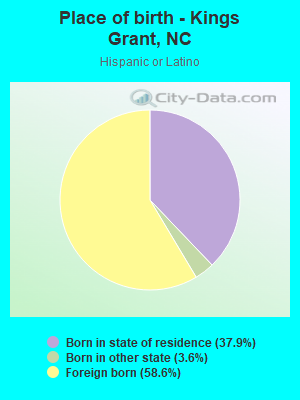
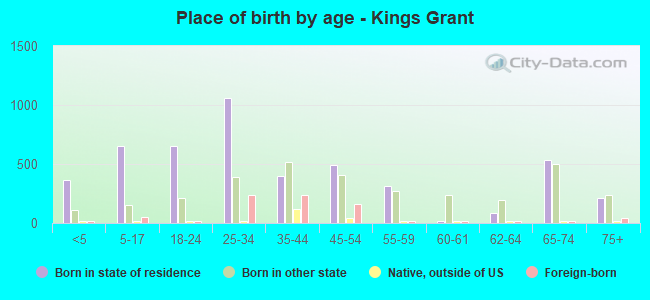
Place of birth - Born in state of residence (%)
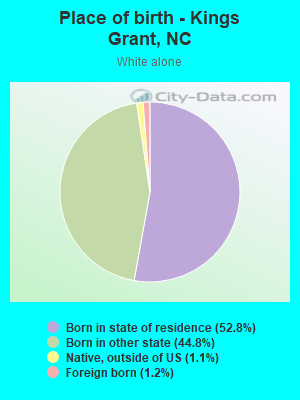
Place of birth - Born in state of residence (%) - White
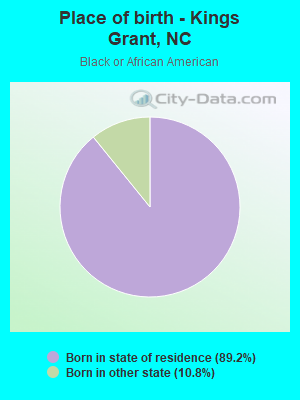
Place of birth - Born in state of residence (%) - Black or African American
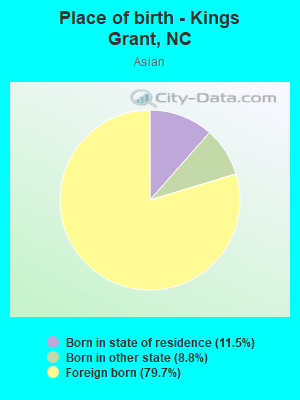
Place of birth - Born in state of residence (%) - Asian
Place of birth - Born in state of residence (%) - Hispanic or Latino
Place of birth - Born in state of residence (%) - American Indian and Alaska Native
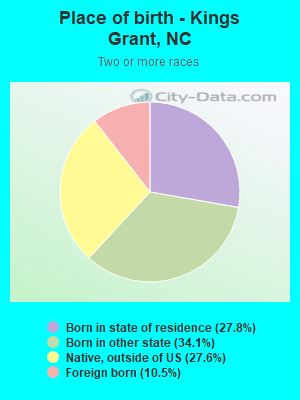
Place of birth - Born in state of residence (%) - Multirace
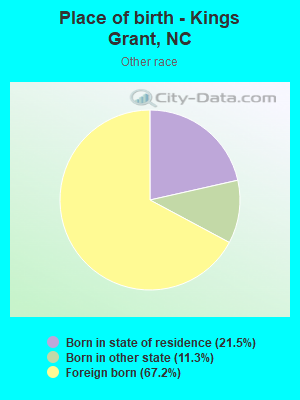
Place of birth - Born in state of residence (%) - Other Race
Place of birth - Born in other state (%)
Place of birth - Born in other state (%) - White
Place of birth - Born in other state (%) - Black or African American
Place of birth - Born in other state (%) - Asian
Place of birth - Born in other state (%) - Hispanic or Latino
Place of birth - Born in other state (%) - American Indian and Alaska Native
Place of birth - Born in other state (%) - Multirace
Place of birth - Born in other state (%) - Other Race
Place of birth - Native, outside of US (%)
Place of birth - Native, outside of US (%) - White
Place of birth - Native, outside of US (%) - Black or African American
Place of birth - Native, outside of US (%) - Asian
Place of birth - Native, outside of US (%) - Hispanic or Latino
Place of birth - Native, outside of US (%) - American Indian and Alaska Native
Place of birth - Native, outside of US (%) - Multirace
Place of birth - Native, outside of US (%) - Other Race
Place of birth - Foreign born (%)
Place of birth - Foreign born (%) - White
Place of birth - Foreign born (%) - Black or African American
Place of birth - Foreign born (%) - Asian
Place of birth - Foreign born (%) - Hispanic or Latino
Place of birth - Foreign born (%) - American Indian and Alaska Native
Place of birth - Foreign born (%) - Multirace
Place of birth - Foreign born (%) - Other Race
Residents speaking English at home (%)
Residents speaking English at home - Born in the United States (%)
Residents speaking English at home - Native, born elsewhere (%)
Residents speaking English at home - Foreign born (%)
Residents speaking Spanish at home (%)
Residents speaking Spanish at home - Born in the United States (%)
Residents speaking Spanish at home - Native, born elsewhere (%)
Residents speaking Spanish at home - Foreign born (%)
Residents speaking other language at home (%)
Residents speaking other language at home - Born in the United States (%)
Residents speaking other language at home - Native, born elsewhere (%)
Residents speaking other language at home - Foreign born (%)
Marital status - Never married (%)
Marital status - Now married (%)
Marital status - Separated (%)
Marital status - Widowed (%)
Marital status - Divorced (%)
Ancestries Reported - Arab (%)
Ancestries Reported - Czech (%)
Ancestries Reported - Danish (%)
Ancestries Reported - Dutch (%)
Ancestries Reported - English (%)
Ancestries Reported - French (%)
Ancestries Reported - French Canadian (%)
Ancestries Reported - German (%)
Ancestries Reported - Greek (%)
Ancestries Reported - Hungarian (%)
Ancestries Reported - Irish (%)
Ancestries Reported - Italian (%)
Ancestries Reported - Lithuanian (%)
Ancestries Reported - Norwegian (%)
Ancestries Reported - Polish (%)
Ancestries Reported - Portuguese (%)
Ancestries Reported - Russian (%)
Ancestries Reported - Scotch-Irish (%)
Ancestries Reported - Scottish (%)
Ancestries Reported - Slovak (%)
Ancestries Reported - Subsaharan African (%)
Ancestries Reported - Swedish (%)
Ancestries Reported - Swiss (%)
Ancestries Reported - Ukrainian (%)
Ancestries Reported - United States (%)
Ancestries Reported - Welsh (%)
Ancestries Reported - West Indian (%)
Ancestries Reported - Other (%)
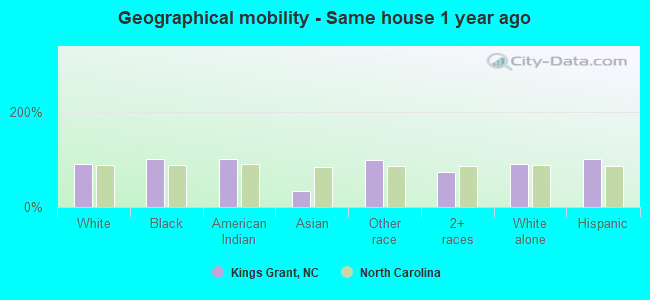
Geographical mobility - Same house 1 year ago (%)
Geographical mobility - Same house 1 year ago (%) - White
Geographical mobility - Same house 1 year ago (%) - Black or African American
Geographical mobility - Same house 1 year ago (%) - Asian
Geographical mobility - Same house 1 year ago (%) - Hispanic or Latino
Geographical mobility - Same house 1 year ago (%) - American Indian and Alaska Native
Geographical mobility - Same house 1 year ago (%) - Multirace
Geographical mobility - Same house 1 year ago (%) - Other Race
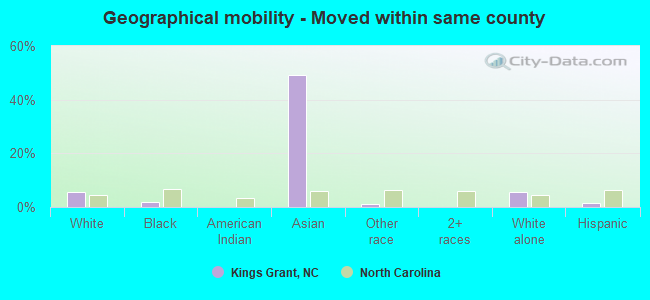
Geographical mobility - Moved within same county (%)
Geographical mobility - Moved within same county (%) - White
Geographical mobility - Moved within same county (%) - Black or African American
Geographical mobility - Moved within same county (%) - Asian
Geographical mobility - Moved within same county (%) - Hispanic or Latino
Geographical mobility - Moved within same county (%) - American Indian and Alaska Native
Geographical mobility - Moved within same county (%) - Multirace
Geographical mobility - Moved within same county (%) - Other Race
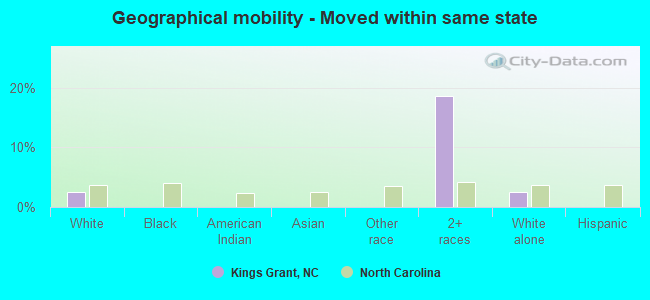
Geographical mobility - Moved from different county within same state (%)
Geographical mobility - Moved from different county within same state (%) - White
Geographical mobility - Moved from different county within same state (%) - Black or African American
Geographical mobility - Moved from different county within same state (%) - Asian
Geographical mobility - Moved from different county within same state (%) - Hispanic or Latino
Geographical mobility - Moved from different county within same state (%) - American Indian and Alaska Native
Geographical mobility - Moved from different county within same state (%) - Multirace
Geographical mobility - Moved from different county within same state (%) - Other Race
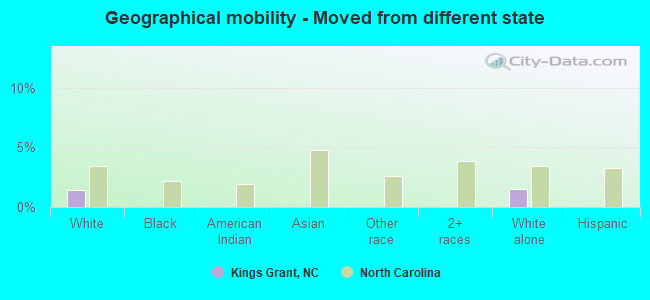
Geographical mobility - Moved from different state (%)
Geographical mobility - Moved from different state (%) - White
Geographical mobility - Moved from different state (%) - Black or African American
Geographical mobility - Moved from different state (%) - Asian
Geographical mobility - Moved from different state (%) - Hispanic or Latino
Geographical mobility - Moved from different state (%) - American Indian and Alaska Native
Geographical mobility - Moved from different state (%) - Multirace
Geographical mobility - Moved from different state (%) - Other Race
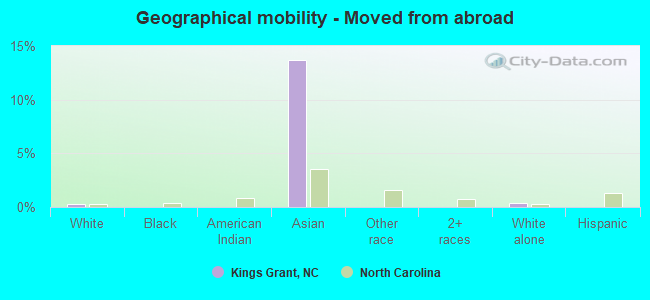
Geographical mobility - Moved from abroad (%)
Geographical mobility - Moved from abroad (%) - White
Geographical mobility - Moved from abroad (%) - Black or African American
Geographical mobility - Moved from abroad (%) - Asian
Geographical mobility - Moved from abroad (%) - Hispanic or Latino
Geographical mobility - Moved from abroad (%) - American Indian and Alaska Native
Geographical mobility - Moved from abroad (%) - Multirace
Geographical mobility - Moved from abroad (%) - Other Race
Place of birth for the foreign-born population - Ireland (%)
Place of birth for the foreign-born population - Denmark (%)
Place of birth for the foreign-born population - Norway (%)
Place of birth for the foreign-born population - Sweden (%)
Place of birth for the foreign-born population - United Kingdom (%)
Place of birth for the foreign-born population - England (%)
Place of birth for the foreign-born population - Scotland (%)
Place of birth for the foreign-born population - Other Northern Europe (%)
Place of birth for the foreign-born population - Austria (%)
Place of birth for the foreign-born population - Belgium (%)
Place of birth for the foreign-born population - France (%)
Place of birth for the foreign-born population - Germany (%)
Place of birth for the foreign-born population - Netherlands (%)
Place of birth for the foreign-born population - Switzerland (%)
Place of birth for the foreign-born population - Other Western Europe (%)
Place of birth for the foreign-born population - Greece (%)
Place of birth for the foreign-born population - Italy (%)
Place of birth for the foreign-born population - Portugal (%)
Place of birth for the foreign-born population - Spain (%)
Place of birth for the foreign-born population - Other Southern Europe (%)
Place of birth for the foreign-born population - Albania (%)
Place of birth for the foreign-born population - Belarus (%)
Place of birth for the foreign-born population - Bosnia and Herzegovina (%)
Place of birth for the foreign-born population - Bulgaria (%)
Place of birth for the foreign-born population - Croatia (%)
Place of birth for the foreign-born population - Czechoslovakia (%)
Place of birth for the foreign-born population - Hungary (%)
Place of birth for the foreign-born population - Latvia (%)
Place of birth for the foreign-born population - Lithuania (%)
Place of birth for the foreign-born population - North Macedonia (Macedonia) (%)
Place of birth for the foreign-born population - Moldova (%)
Place of birth for the foreign-born population - Poland (%)
Place of birth for the foreign-born population - Romania (%)
Place of birth for the foreign-born population - Russia (%)
Place of birth for the foreign-born population - Serbia (%)
Place of birth for the foreign-born population - Ukraine (%)
Place of birth for the foreign-born population - Other Eastern Europe (%)
Place of birth for the foreign-born population - China (%)
Place of birth for the foreign-born population - Hong Kong (%)
Place of birth for the foreign-born population - Taiwan (%)
Place of birth for the foreign-born population - Japan (%)
Place of birth for the foreign-born population - Korea (%)
Place of birth for the foreign-born population - Other Eastern Asia (%)
Place of birth for the foreign-born population - Afghanistan (%)
Place of birth for the foreign-born population - Bangladesh (%)
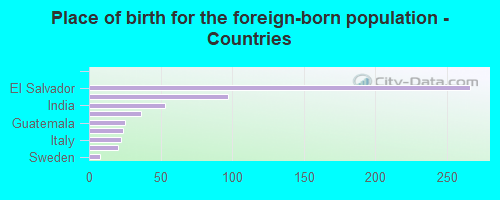
Place of birth for the foreign-born population - India (%)
Place of birth for the foreign-born population - Iran (%)
Place of birth for the foreign-born population - Kazakhstan (%)
Place of birth for the foreign-born population - Nepal (%)
Place of birth for the foreign-born population - Pakistan (%)
Place of birth for the foreign-born population - Sri Lanka (%)
Place of birth for the foreign-born population - Uzbekistan (%)
Place of birth for the foreign-born population - Other South Central Asia (%)
Place of birth for the foreign-born population - Burma (%)
Place of birth for the foreign-born population - Cambodia (%)
Place of birth for the foreign-born population - Indonesia (%)
Place of birth for the foreign-born population - Laos (%)
Place of birth for the foreign-born population - Malaysia (%)
Place of birth for the foreign-born population - Philippines (%)
Place of birth for the foreign-born population - Singapore (%)
Place of birth for the foreign-born population - Thailand (%)
Place of birth for the foreign-born population - Vietnam (%)
Place of birth for the foreign-born population - Other South Eastern Asia (%)
Place of birth for the foreign-born population - Armenia (%)
Place of birth for the foreign-born population - Iraq (%)
Place of birth for the foreign-born population - Israel (%)
Place of birth for the foreign-born population - Jordan (%)
Place of birth for the foreign-born population - Kuwait (%)
Place of birth for the foreign-born population - Lebanon (%)
Place of birth for the foreign-born population - Saudi Arabia (%)
Place of birth for the foreign-born population - Syria (%)
Place of birth for the foreign-born population - Turkey (%)
Place of birth for the foreign-born population - Yemen (%)
Place of birth for the foreign-born population - Other Western Asia (%)
Place of birth for the foreign-born population - Eritrea (%)
Place of birth for the foreign-born population - Ethiopia (%)
Place of birth for the foreign-born population - Kenya (%)
Place of birth for the foreign-born population - Somalia (%)
Place of birth for the foreign-born population - Uganda (%)
Place of birth for the foreign-born population - Zimbabwe (%)
Place of birth for the foreign-born population - Other Eastern Africa (%)
Place of birth for the foreign-born population - Cameroon (%)
Place of birth for the foreign-born population - Congo (%)
Place of birth for the foreign-born population - Democratic Republic of Congo (Zaire) (%)
Place of birth for the foreign-born population - Other Middle Africa (%)
Place of birth for the foreign-born population - Egypt (%)
Place of birth for the foreign-born population - Morocco (%)
Place of birth for the foreign-born population - Sudan (%)
Place of birth for the foreign-born population - Other Northern Africa (%)
Place of birth for the foreign-born population - South Africa (%)
Place of birth for the foreign-born population - Other Southern Africa (%)
Place of birth for the foreign-born population - Cabo Verde (%)
Place of birth for the foreign-born population - Ghana (%)
Place of birth for the foreign-born population - Liberia (%)
Place of birth for the foreign-born population - Nigeria (%)
Place of birth for the foreign-born population - Senegal (%)
Place of birth for the foreign-born population - Sierra Leone (%)
Place of birth for the foreign-born population - Other Western Africa (%)
Place of birth for the foreign-born population - Australia (%)
Place of birth for the foreign-born population - New Zealand (%)
Place of birth for the foreign-born population - Fiji (%)
Place of birth for the foreign-born population - Micronesia (%)
Place of birth for the foreign-born population - Bahamas (%)
Place of birth for the foreign-born population - Barbados (%)
Place of birth for the foreign-born population - Cuba (%)
Place of birth for the foreign-born population - Dominica (%)
Place of birth for the foreign-born population - Dominican Republic (%)
Place of birth for the foreign-born population - Grenada (%)
Place of birth for the foreign-born population - Haiti (%)
Place of birth for the foreign-born population - Jamaica (%)
Place of birth for the foreign-born population - St. Vincent and the Grenadines (%)
Place of birth for the foreign-born population - Trinidad and Tobago (%)
Place of birth for the foreign-born population - West Indies (%)
Place of birth for the foreign-born population - Other Caribbean (%)
Place of birth for the foreign-born population - Belize (%)
Place of birth for the foreign-born population - Costa Rica (%)
Place of birth for the foreign-born population - El Salvador (%)
Place of birth for the foreign-born population - Guatemala (%)
Place of birth for the foreign-born population - Honduras (%)
Place of birth for the foreign-born population - Mexico (%)
Place of birth for the foreign-born population - Nicaragua (%)
Place of birth for the foreign-born population - Panama (%)
Place of birth for the foreign-born population - Other Central America (%)
Place of birth for the foreign-born population - Argentina (%)
Place of birth for the foreign-born population - Bolivia (%)
Place of birth for the foreign-born population - Brazil (%)
Place of birth for the foreign-born population - Chile (%)
Place of birth for the foreign-born population - Colombia (%)
Place of birth for the foreign-born population - Ecuador (%)
Place of birth for the foreign-born population - Guyana (%)
Place of birth for the foreign-born population - Peru (%)
Place of birth for the foreign-born population - Uruguay (%)
Place of birth for the foreign-born population - Venezuela (%)
Place of birth for the foreign-born population - Other South America (%)
Place of birth for the foreign-born population - Canada (%)
Place of birth for the foreign-born population - Other Northern America (%)
Place of birth for the foreign-born population - Other (%)
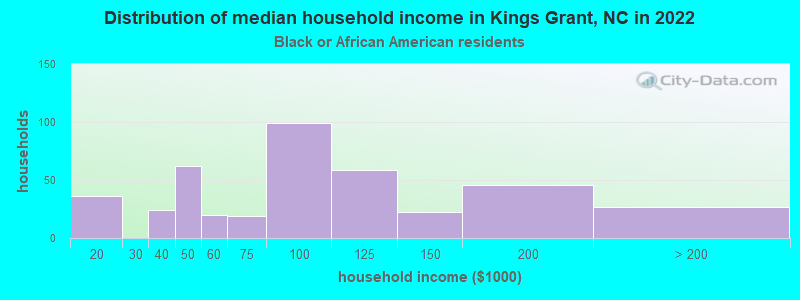
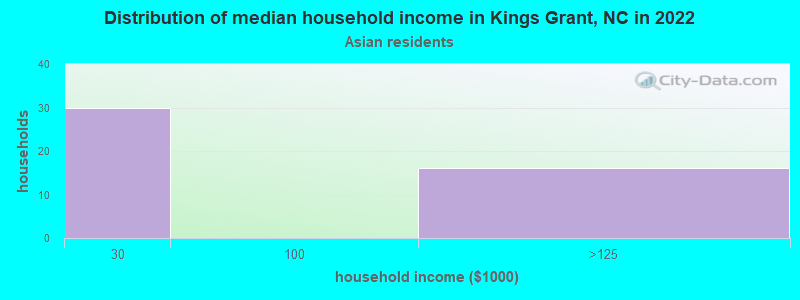
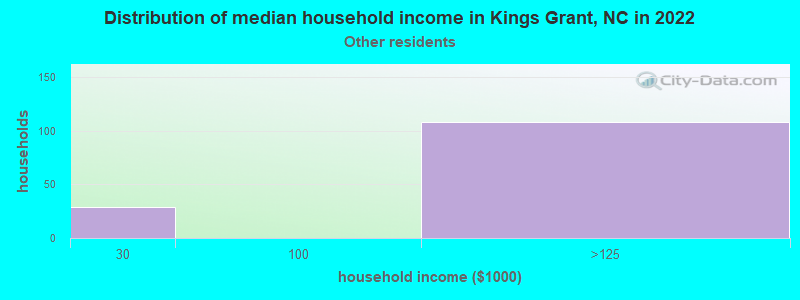
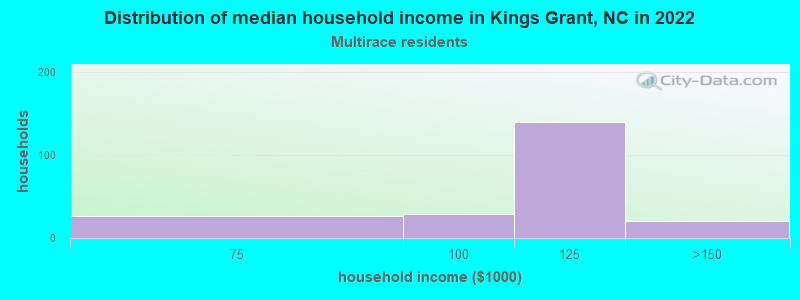
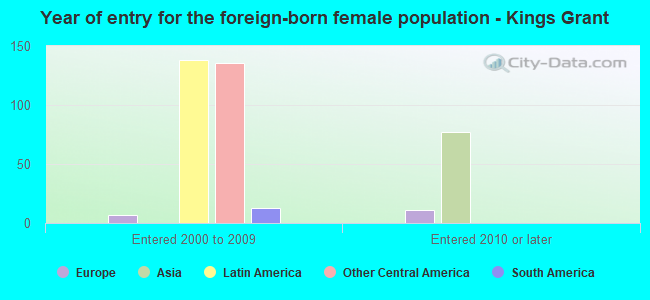
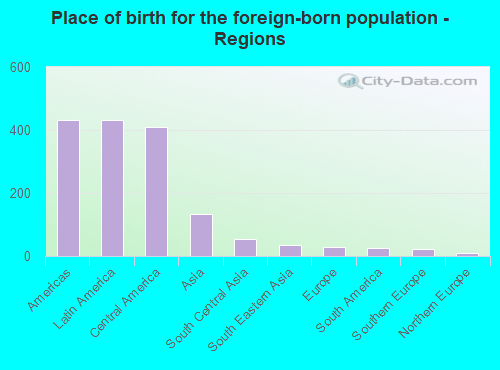
According to 2022 data, the most numerous races in Kings Grant, NC are White alone (6,674 residents), Black alone (938 residents), and Hispanic (701 residents). 91.6% of Kings Grant residents speak English at home. 6.8% of Kings Grant, NC residents are foreign-born (4.8% born in Latin America, 1.5% born in Asia), which is 18.1% less than the foreign-born rate of 8.0% across the entire state of North Carolina.
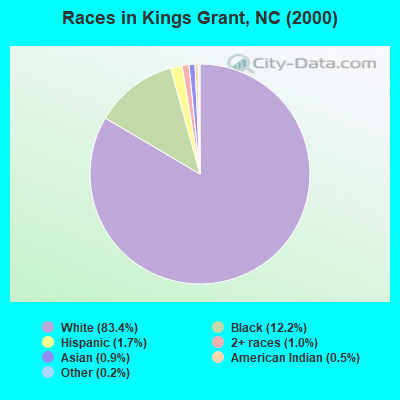
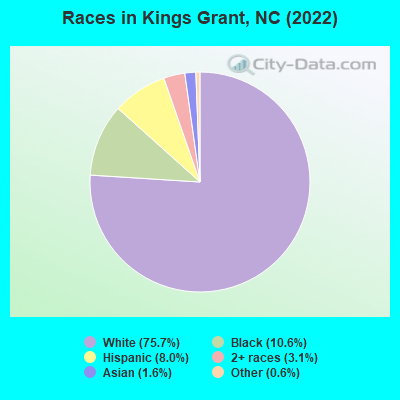
Race distribution in Kings Grant
2000 2022
5,647,155 70.2% White alone 1,723,301 21.4% Black alone 378,963 4.7% Hispanic 112,416 1.4% Asian alone 95,333 1.2% American Indian alone 79,965 1.0% Two or more races 9,015 0.1% Other race alone 3,165 0.04% Native Hawaiian and Other
6,497,519 60.7% White alone 2,155,650 20.1% Black alone 1,114,799 10.4% Hispanic 438,061 4.1% Two or more races 341,052 3.2% Asian alone 91,758 0.9% American Indian alone 50,180 0.5% Other race alone 9,954 0.09% Native Hawaiian and Other
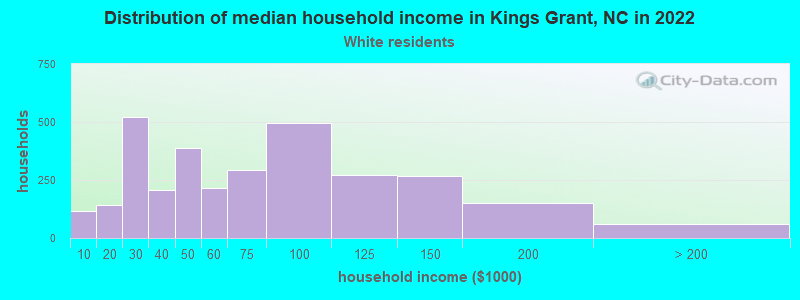
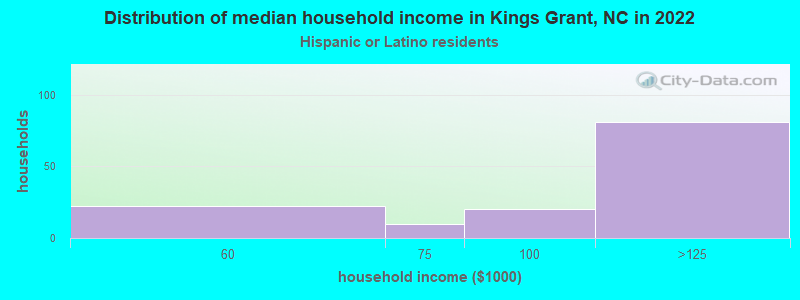
Income and house value in Kings Grant Median household income in 2022 $56,950 White non-Hispanic householders$101,359 Black householders$110,518 Some other race householders$167,048 Two or more races householders$142,288 Hispanic or Latino race householdersMedian 2022 house value $277,334 White Non-Hispanic householders$282,576 Black or African American householders $35,946 Asian householders$291,812 Hispanic or Latino householders
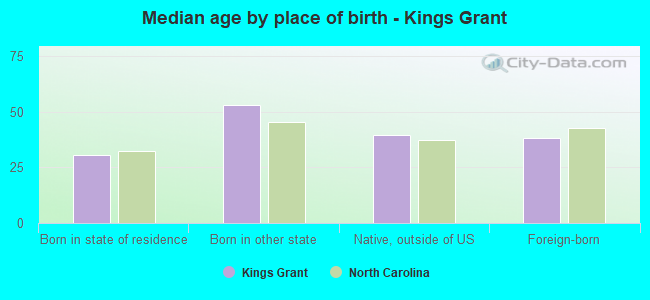
Median age by race in Kings Grant
42.7 Median age for White residents41.4 44.1 45.1 Median age for Black or African American residents51.1 38.8 -919,854,279.6 Median age for American Indian / Alaska Native residents-967,619,046.7 -901,433,690.9 34.2 Median age for Asian residents23.7 22.1 -666,666,666.0 Median age for Native Hawaiian / Pacific Islander residents-666,666,666.0 -666,666,666.0 41.3 Median age for Other race residents38.8 6.1 45.3 Median age for Two or more races residents45.4 16.7 42.7 Median age for White alone residents41.2 43.9 34.0 Median age for Hispanic or Latino residents38.6 5.5
Owner/renter occupied households by race in Kings Grant
House owners and renters - White residents 2,163 66.2% Owner occupied1,105 33.8% Renter occupiedHouse owners and renters - Black or African American residents 476 97.0% Owner occupied15 3.0% Renter occupiedHouse owners and renters - American Indian / Alaska Native residents 5 100.0% Owner occupiedHouse owners and renters - Asian residents 23 100.0% Owner occupiedHouse owners and renters - Other race residents 53 44.2% Owner occupied67 55.8% Renter occupiedHouse owners and renters - Two or more races residents 89 33.0% Owner occupied180 67.0% Renter occupiedHouse owners and renters - White alone residents 2,156 65.8% Owner occupied1,121 34.2% Renter occupiedHouse owners and renters - Hispanic or Latino residents 48 44.0% Owner occupied61 56.0% Renter occupied
Language usage in Kings Grant
English speakers - Total 91.6% of residents of Kings Grant speak English at home.
5.5% of residents speak Spanish at home 261 56.7% Speak English very well199 43.3% Speak English less than very well2.7% of residents speak other language at home 128 57.7% Speak English very well94 42.3% Speak English less than very well
English speakers - Born in the United States 97.9% of residents of Kings Grant speak English at home.
1.2% of residents speak Spanish at home 30 83.3% Speak English very well6 16.7% Speak English less than very well1.8% of residents speak other language at home 57 100.0% Speak English very well
All residents speak only English at home
English speakers - Foreign-born 4.6% of residents of Kings Grant speak English at home.
56.5% of residents speak Spanish at home 235 58.3% Speak English very well168 41.7% Speak English less than very well30.7% of residents speak other language at home 125 57.1% Speak English very well94 42.9% Speak English less than very well
White (Caucasian) - Speak only English Native:
99.0% (6,238)Foreign-born:
14.2% (26)
White (Caucasian) - Speak another language Native:
1.2% (75)Foreign-born:
84.5% (155)
Asian - Speak another language Native:
69.7% (8)Foreign-born:
94.3% (111)
White alone - Speak only English Native:
98.7% (6,235)Foreign-born:
20.9% (16)
White alone - Speak another language Native:
1.3% (80)Foreign-born:
87.8% (69)
Hispanic or Latino - Speak only English Native:
100.0% (59)Foreign-born:
3.3% (14)
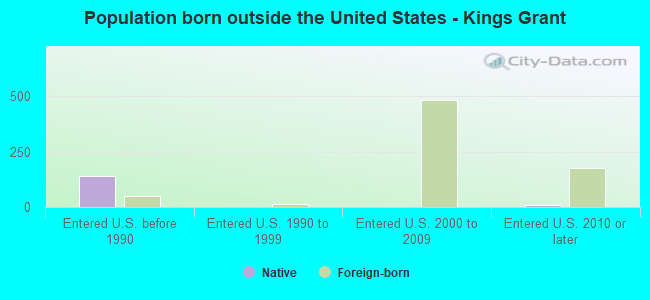
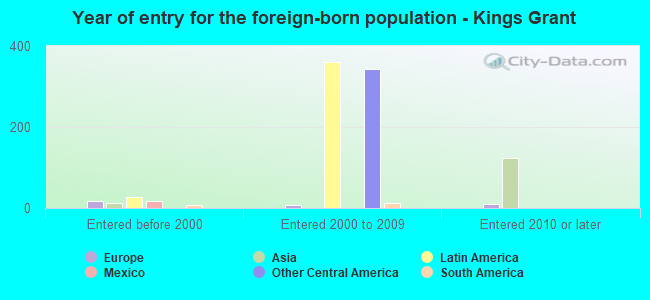
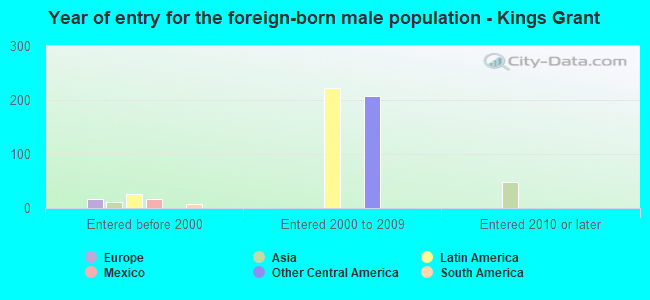
Foreign-born residents in Kings Grant 597 residents are foreign born (4.8% Latin America , 1.5% Asia ).
This city:
6.8%North Carolina:
8.3%
Marital status for residents in Kings Grant Marital status - White (Caucasian) population 15 years and over
Males 44.0% Never married45.7% Now married1.8% Separated2.3% Widowed6.2% DivorcedFemales 31.0% Never married48.3% Now married0.4% Separated8.2% Widowed12.1% DivorcedWomen who gave birth in the past 12 months Now married:
65.1% (53)Unmarried:
34.9% (29)
Women who did not give birth in the past 12 months Now married:
40.3% (635)Unmarried:
59.7% (941)
Marital status - Black or African American population 15 years and over
Males 16.5% Never married82.4% Now married0.0% Separated1.1% Widowed0.0% DivorcedFemales 48.7% Never married33.3% Now married0.0% Separated5.2% Widowed12.8% DivorcedWomen who did not give birth in the past 12 months Now married:
13.2% (36)Unmarried:
86.8% (237)
Marital status - Asian population 15 years and over
Males 21.1% Never married78.9% Now married0.0% Separated0.0% Widowed0.0% DivorcedFemales 32.0% Never married68.0% Now married0.0% Separated0.0% Widowed0.0% DivorcedWomen who did not give birth in the past 12 months Now married:
64.4% (30)Unmarried:
35.6% (17)
Marital status - Other race population 15 years and over
Males 94.1% Never married5.9% Now married0.0% Separated0.0% Widowed0.0% DivorcedFemales 70.3% Never married8.5% Now married0.0% Separated0.0% Widowed21.2% DivorcedWomen who did not give birth in the past 12 months Now married:
8.5% (14)Unmarried:
91.5% (148)
Marital status - Two or more races population 15 years and over
Males 11.5% Never married88.5% Now married0.0% Separated0.0% Widowed0.0% DivorcedFemales 60.0% Never married40.0% Now married0.0% Separated0.0% Widowed0.0% DivorcedWomen who did not give birth in the past 12 months Now married:
48.5% (22)Unmarried:
51.5% (23)
Marital status - White alone, not Hispanic / Latino population 15 years and over
Males 44.9% Never married44.6% Now married1.8% Separated2.3% Widowed6.4% DivorcedFemales 30.9% Never married48.1% Now married0.4% Separated8.3% Widowed12.3% DivorcedWomen who gave birth in the past 12 months Now married:
65.1% (54)Unmarried:
34.9% (29)
Women who did not give birth in the past 12 months Now married:
39.9% (627)Unmarried:
60.1% (944)
Marital status - Hispanic or Latino population 15 years and over
Males 70.7% Never married29.3% Now married0.0% Separated0.0% Widowed0.0% DivorcedFemales 77.6% Never married22.4% Now married0.0% Separated0.0% Widowed0.0% DivorcedWomen who did not give birth in the past 12 months Now married:
16.4% (21)Unmarried:
83.6% (108)
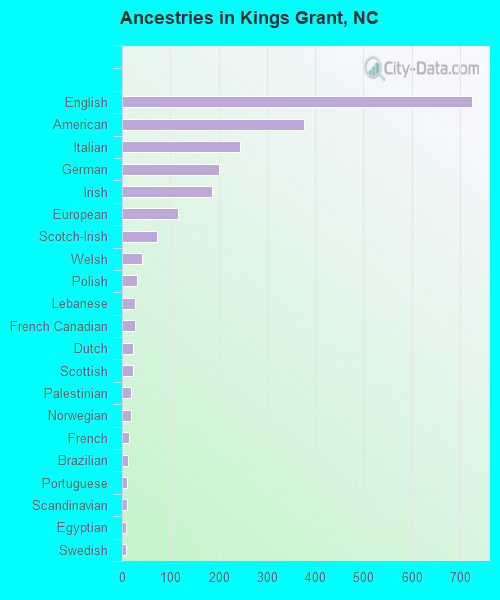
Ancestries in Kings Grant
724 19.9% English378 10.4% American244 6.7% Italian201 5.5% German187 5.1% Irish115 3.2% European72 2.0% Scotch-Irish41 1.1% Welsh31 0.9% Polish26 0.7% Lebanese26 0.7% French Canadian23 0.6% Dutch22 0.6% Scottish19 0.5% Palestinian18 0.5% Norwegian14 0.4% French12 0.3% Brazilian11 0.3% Portuguese10 0.3% Scandinavian8 0.2% Egyptian8 0.2% Swedish6 0.2% Eastern European1 0.03% African
Children Nativity (place of birth) in Kings Grant
Children under 6 years - Living with two parents Both parents native 192 100.0% NativeBoth parents foreign-born 12 100.0% NativeChildren under 6 years - Living with one parent Native parent 95 100.0% NativeForeign-born parent 266 100.0% NativeChildren 6 to 17 years - Living with two parents Both parents native 348 93.3% Native25 6.7% Foreign-bornBoth parents foreign-born 21 100.0% Foreign-bornOne native, one foreign-born parent 43 100.0% NativeChildren 6 to 17 years - Living with one parent Native parent 324 100.0% Native
Grandparents responsible for own grandchildren in Kings Grant
Grandparents (30 to 59 years) White / Caucasian 16 25.7% Responsible for grandchildren46 74.3% Not responsible for grandchildrenBlack or African American 16 100.0% Responsible for grandchildrenWhite alone, not Hispanic / Latino 6 100.0% Not responsible for grandchildrenHispanic or Latino 17 21.0% Responsible for grandchildren62 79.0% Not responsible for grandchildrenGrandparents (60 years and over) White / Caucasian 36 71.5% Responsible for grandchildren14 28.5% Not responsible for grandchildrenWhite alone, not Hispanic / Latino 37 71.6% Responsible for grandchildren15 28.4% Not responsible for grandchildren