Races in Kinnickinnic, Wisconsin (WI) Detailed Stats
Ancestries, Foreign-born residents, place of birth
0.4% of Kinnickinnic, WI residents are foreign-born , which is 1300.0% less than the foreign-born rate of 5.0% across the entire state of Wisconsin.
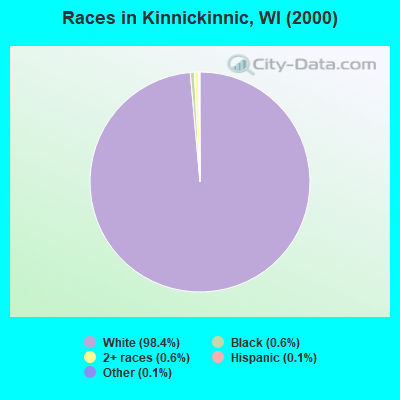
Race distribution in Kinnickinnic

- 1,37798.4%White alone
- 90.6%Black alone
- 90.6%Two or more races
- 20.1%Hispanic
- 20.1%Other race alone
- 10.07%Asian alone
2000
2022
-
- 4,681,63087.3%White alone
- 300,2455.6%Black alone
- 192,9213.6%Hispanic
- 87,9951.6%Asian alone
- 51,9211.0%Two or more races
- 43,9800.8%American Indian alone
- 3,6370.07%Other race alone
- 1,3460.03%Native Hawaiian and Other
Pacific Islander alone

-
- 4,654,03179.0%White alone
- 447,0227.6%Hispanic
- 345,6785.9%Black alone
- 217,5323.7%Two or more races
- 172,2422.9%Asian alone
- 33,7620.6%American Indian alone
- 19,6800.3%Other race alone
- 2,5920.04%Native Hawaiian and Other
Pacific Islander alone

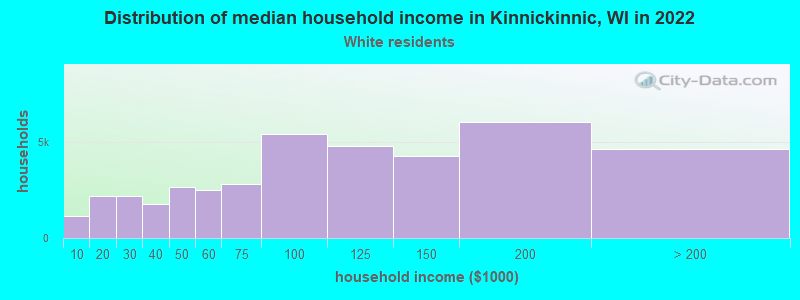
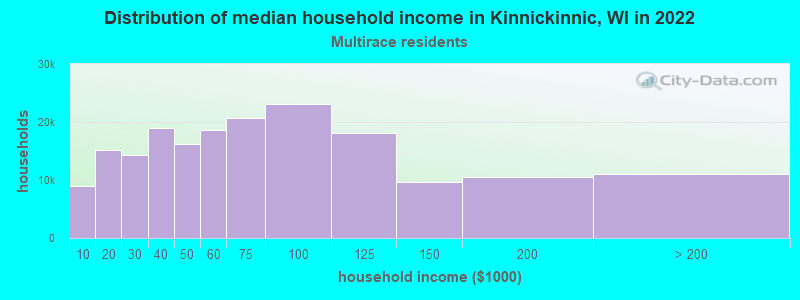
Income and house value in Kinnickinnic
- Median household income in 2022
- $110,425White non-Hispanic householders
- over $200,000Two or more races householders
- Median 2022 house value
- $378,050White Non-Hispanic householders
Household income for White non-Hispanic householders
Household income for Two or more races householders
Foreign-born residents in Kinnickinnic
5 residents are foreign born
| This city: | 0.4% |
| Wisconsin: | 3.6% |
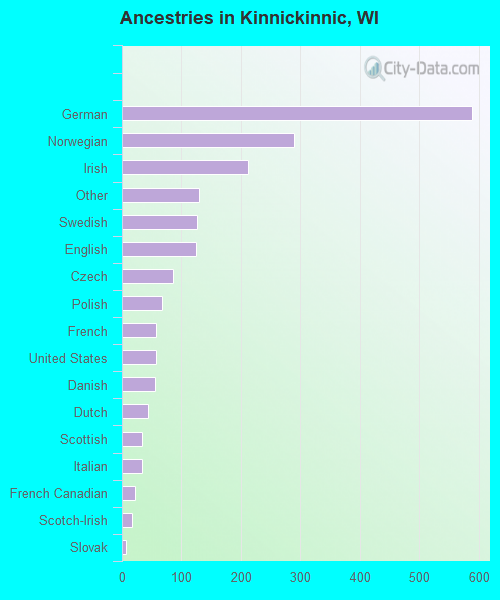
Ancestries in Kinnickinnic

- 58829.8%German
- 28914.6%Norwegian
- 21210.7%Irish
- 1296.5%Other
- 1266.4%Swedish
- 1256.3%English
- 854.3%Czech
- 673.4%Polish
- 582.9%French
- 582.9%United States
- 562.8%Danish
- 432.2%Dutch
- 341.7%Scottish
- 331.7%Italian
- 221.1%French Canadian
- 170.9%Scotch-Irish
- 60.3%Slovak
- 50.3%Greek
- 50.3%Subsaharan African
- 40.2%Hungarian
- 30.2%Welsh
- 20.1%Lithuanian
- 20.1%Russian
- 20.1%Swiss
- 20.1%Ukrainian
Zip codes: 54022.