Races in Knights Landing, California (CA) Detailed Stats
Ancestries, Foreign-born residents, place of birth
Data:
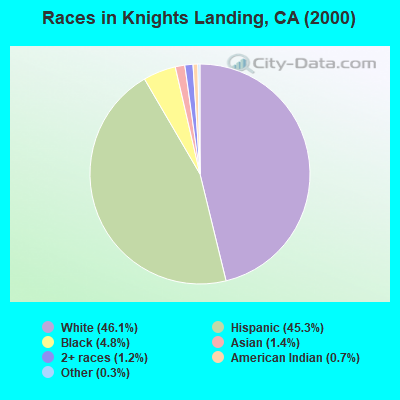
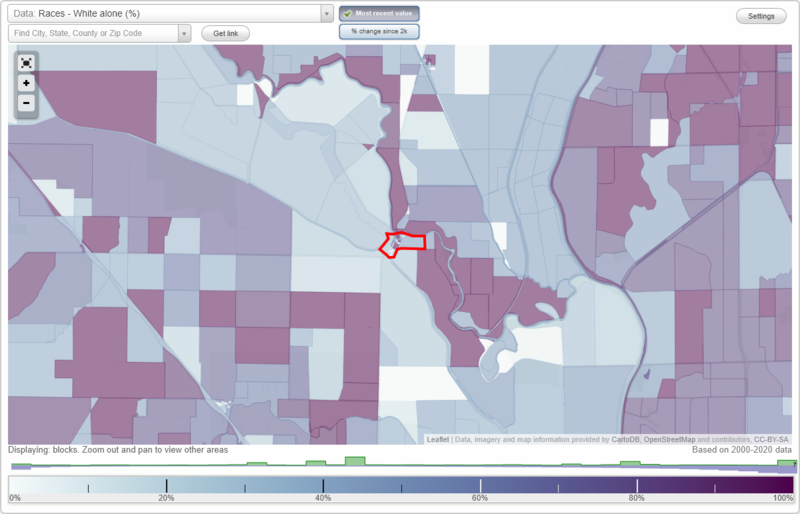
Race distribution in Knights Landing

- 1,74646.1%White alone
- 1,71545.3%Hispanic
- 1814.8%Black alone
- 531.4%Asian alone
- 471.2%Two or more races
- 280.7%American Indian alone
- 130.3%Other race alone
- 10.03%Native Hawaiian and Other
Pacific Islander alone
2000
2022
-
- 15,816,79046.7%White alone
- 10,966,55632.4%Hispanic
- 3,648,86010.8%Asian alone
- 2,181,9266.4%Black alone
- 903,1152.7%Two or more races
- 178,9840.5%American Indian alone
- 103,7360.3%Native Hawaiian and Other
Pacific Islander alone
- 71,6810.2%Other race alone
-
- 15,732,18440.3%Hispanic
- 13,160,42633.7%White alone
- 5,957,86715.3%Asian alone
- 2,025,2185.2%Black alone
- 1,663,2224.3%Two or more races
- 251,6180.6%Other race alone
- 135,7770.3%Native Hawaiian and Other
Pacific Islander alone
- 103,0300.3%American Indian alone
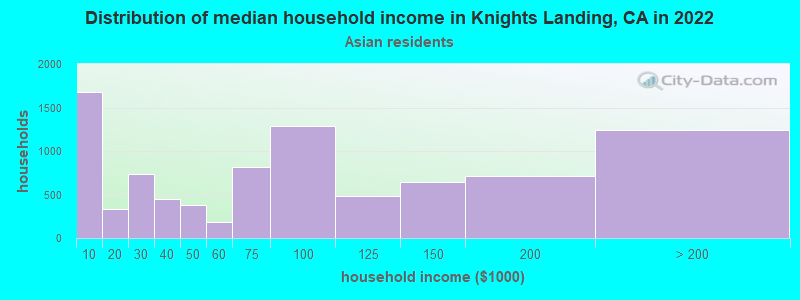
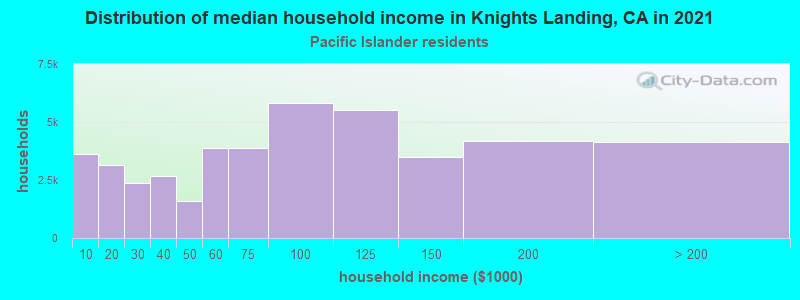
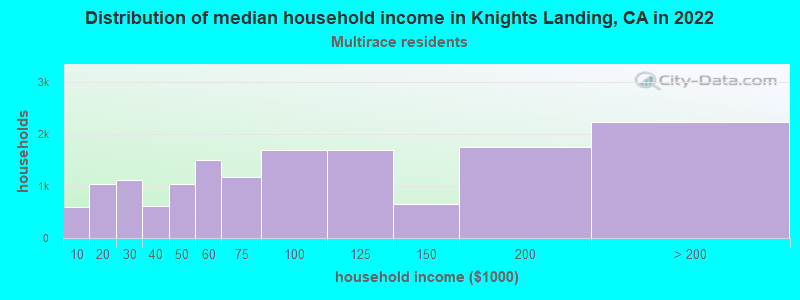
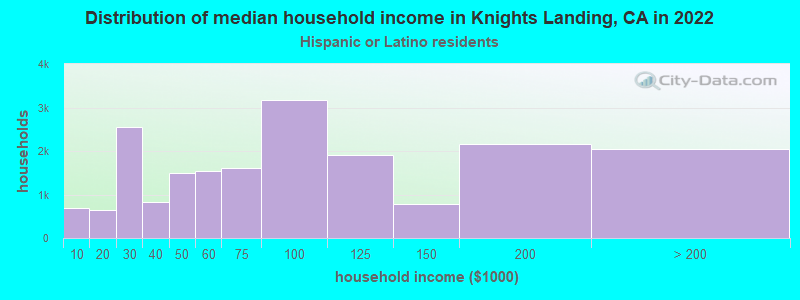
Income and house value in Knights Landing
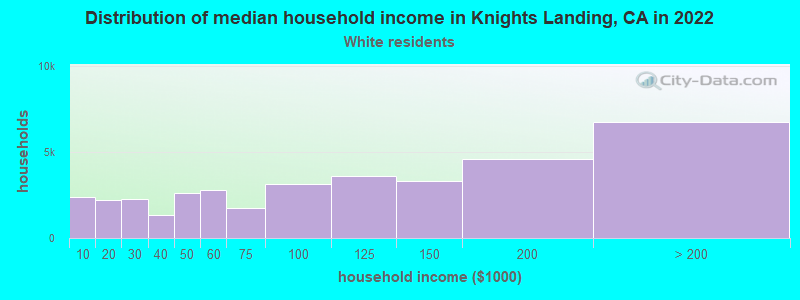
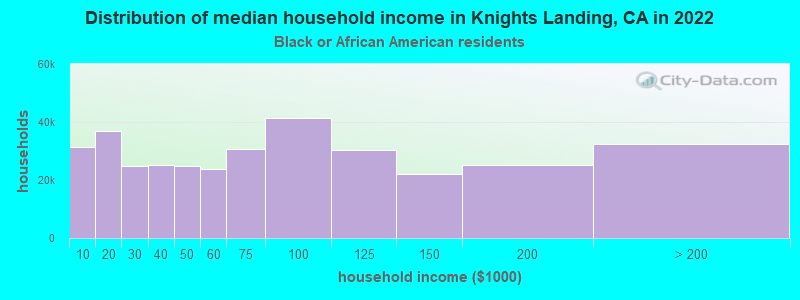
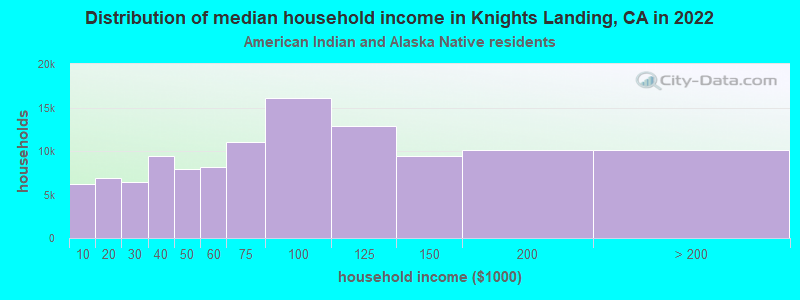
- Median household income in 2022
- $72,156White non-Hispanic householders
- $54,504Black householders
- $119,271American Indian and Alaska Native householders
- $47,391Asian householders
- $64,283Native Hawaiian and other Pacific Islander householders
- $64,459Some other race householders
- $81,537Two or more races householders
- $69,024Hispanic or Latino race householders
- Median 2022 house value
- $501,741White Non-Hispanic householders
- $467,188Black or African American householders
- $430,475Some other race householders
- $407,440Two or more races householders
- $409,599Hispanic or Latino householders