Races in La Puente, California (CA) Detailed Stats
Data:
Races - White alone (%)
Races - White alone (% change since 2000)
Races - Black alone (%)
Races - Black alone (% change since 2000)
Races - American Indian alone (%)
Races - American Indian alone (% change since 2000)
Races - Asian alone (%)
Races - Asian alone (% change since 2000)
Races - Hispanic (%)
Races - Hispanic (% change since 2000)
Races - Native Hawaiian and Other Pacific Islander alone (%)
Races - Native Hawaiian and Other Pacific Islander alone (% change since 2000)
Races - Two or more races(%)
Races - Two or more races(% change since 2000)
Races - Other race alone (%)
Races - Other race alone (% change since 2000)
Racial diversity
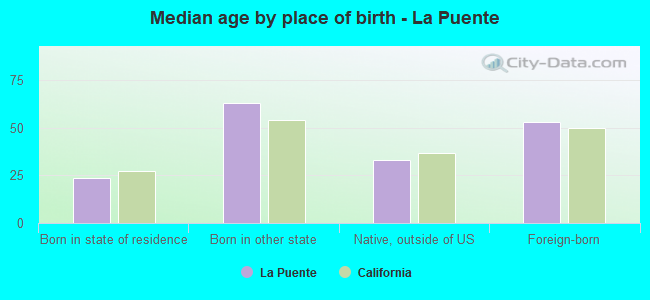
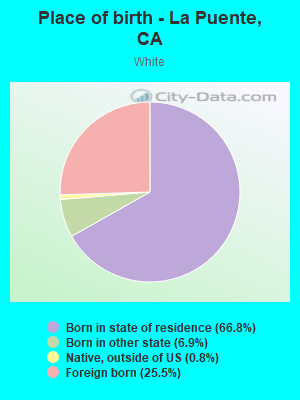
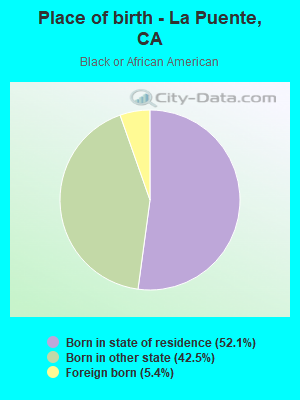
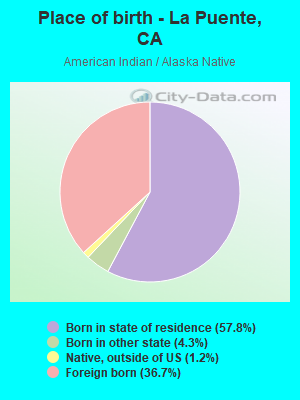
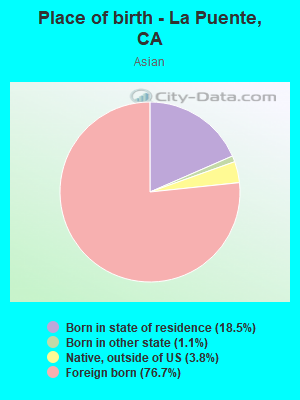
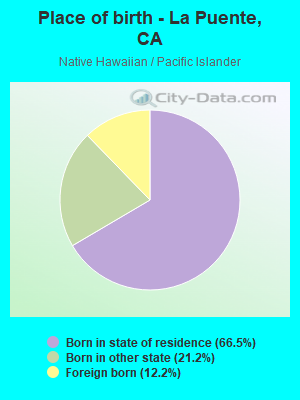
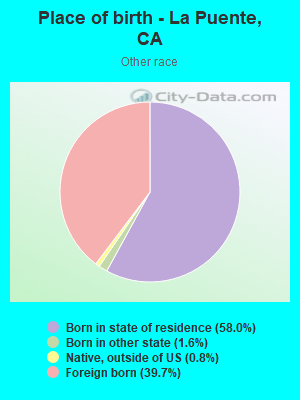
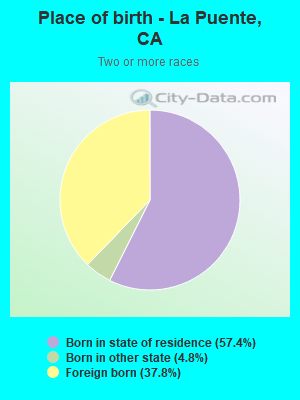
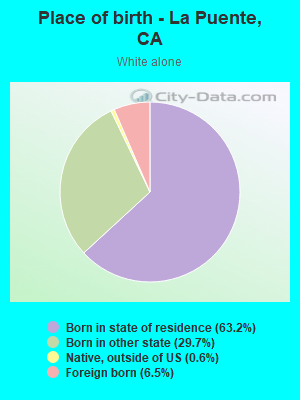
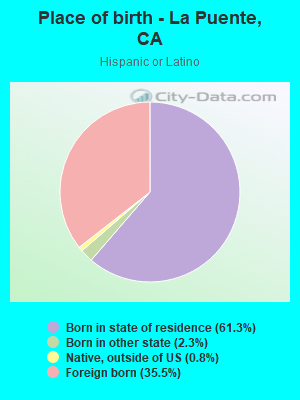
Place of birth - Born in state of residence (%)
Place of birth - Born in state of residence (%) - White
Place of birth - Born in state of residence (%) - Black or African American
Place of birth - Born in state of residence (%) - Asian
Place of birth - Born in state of residence (%) - Hispanic or Latino
Place of birth - Born in state of residence (%) - American Indian and Alaska Native
Place of birth - Born in state of residence (%) - Multirace
Place of birth - Born in state of residence (%) - Other Race
Place of birth - Born in other state (%)
Place of birth - Born in other state (%) - White
Place of birth - Born in other state (%) - Black or African American
Place of birth - Born in other state (%) - Asian
Place of birth - Born in other state (%) - Hispanic or Latino
Place of birth - Born in other state (%) - American Indian and Alaska Native
Place of birth - Born in other state (%) - Multirace
Place of birth - Born in other state (%) - Other Race
Place of birth - Native, outside of US (%)
Place of birth - Native, outside of US (%) - White
Place of birth - Native, outside of US (%) - Black or African American
Place of birth - Native, outside of US (%) - Asian
Place of birth - Native, outside of US (%) - Hispanic or Latino
Place of birth - Native, outside of US (%) - American Indian and Alaska Native
Place of birth - Native, outside of US (%) - Multirace
Place of birth - Native, outside of US (%) - Other Race
Place of birth - Foreign born (%)
Place of birth - Foreign born (%) - White
Place of birth - Foreign born (%) - Black or African American
Place of birth - Foreign born (%) - Asian
Place of birth - Foreign born (%) - Hispanic or Latino
Place of birth - Foreign born (%) - American Indian and Alaska Native
Place of birth - Foreign born (%) - Multirace
Place of birth - Foreign born (%) - Other Race
Residents speaking English at home (%)
Residents speaking English at home - Born in the United States (%)
Residents speaking English at home - Native, born elsewhere (%)
Residents speaking English at home - Foreign born (%)
Residents speaking Spanish at home (%)
Residents speaking Spanish at home - Born in the United States (%)
Residents speaking Spanish at home - Native, born elsewhere (%)
Residents speaking Spanish at home - Foreign born (%)
Residents speaking other language at home (%)
Residents speaking other language at home - Born in the United States (%)
Residents speaking other language at home - Native, born elsewhere (%)
Residents speaking other language at home - Foreign born (%)
Marital status - Never married (%)
Marital status - Now married (%)
Marital status - Separated (%)
Marital status - Widowed (%)
Marital status - Divorced (%)
Ancestries Reported - Arab (%)
Ancestries Reported - Czech (%)
Ancestries Reported - Danish (%)
Ancestries Reported - Dutch (%)
Ancestries Reported - English (%)
Ancestries Reported - French (%)
Ancestries Reported - French Canadian (%)
Ancestries Reported - German (%)
Ancestries Reported - Greek (%)
Ancestries Reported - Hungarian (%)
Ancestries Reported - Irish (%)
Ancestries Reported - Italian (%)
Ancestries Reported - Lithuanian (%)
Ancestries Reported - Norwegian (%)
Ancestries Reported - Polish (%)
Ancestries Reported - Portuguese (%)
Ancestries Reported - Russian (%)
Ancestries Reported - Scotch-Irish (%)
Ancestries Reported - Scottish (%)
Ancestries Reported - Slovak (%)
Ancestries Reported - Subsaharan African (%)
Ancestries Reported - Swedish (%)
Ancestries Reported - Swiss (%)
Ancestries Reported - Ukrainian (%)
Ancestries Reported - United States (%)
Ancestries Reported - Welsh (%)
Ancestries Reported - West Indian (%)
Ancestries Reported - Other (%)
Geographical mobility - Same house 1 year ago (%)
Geographical mobility - Same house 1 year ago (%) - White
Geographical mobility - Same house 1 year ago (%) - Black or African American
Geographical mobility - Same house 1 year ago (%) - Asian
Geographical mobility - Same house 1 year ago (%) - Hispanic or Latino
Geographical mobility - Same house 1 year ago (%) - American Indian and Alaska Native
Geographical mobility - Same house 1 year ago (%) - Multirace
Geographical mobility - Same house 1 year ago (%) - Other Race
Geographical mobility - Moved within same county (%)
Geographical mobility - Moved within same county (%) - White
Geographical mobility - Moved within same county (%) - Black or African American
Geographical mobility - Moved within same county (%) - Asian
Geographical mobility - Moved within same county (%) - Hispanic or Latino
Geographical mobility - Moved within same county (%) - American Indian and Alaska Native
Geographical mobility - Moved within same county (%) - Multirace
Geographical mobility - Moved within same county (%) - Other Race
Geographical mobility - Moved from different county within same state (%)
Geographical mobility - Moved from different county within same state (%) - White
Geographical mobility - Moved from different county within same state (%) - Black or African American
Geographical mobility - Moved from different county within same state (%) - Asian
Geographical mobility - Moved from different county within same state (%) - Hispanic or Latino
Geographical mobility - Moved from different county within same state (%) - American Indian and Alaska Native
Geographical mobility - Moved from different county within same state (%) - Multirace
Geographical mobility - Moved from different county within same state (%) - Other Race
Geographical mobility - Moved from different state (%)
Geographical mobility - Moved from different state (%) - White
Geographical mobility - Moved from different state (%) - Black or African American
Geographical mobility - Moved from different state (%) - Asian
Geographical mobility - Moved from different state (%) - Hispanic or Latino
Geographical mobility - Moved from different state (%) - American Indian and Alaska Native
Geographical mobility - Moved from different state (%) - Multirace
Geographical mobility - Moved from different state (%) - Other Race
Geographical mobility - Moved from abroad (%)
Geographical mobility - Moved from abroad (%) - White
Geographical mobility - Moved from abroad (%) - Black or African American
Geographical mobility - Moved from abroad (%) - Asian
Geographical mobility - Moved from abroad (%) - Hispanic or Latino
Geographical mobility - Moved from abroad (%) - American Indian and Alaska Native
Geographical mobility - Moved from abroad (%) - Multirace
Geographical mobility - Moved from abroad (%) - Other Race
Place of birth for the foreign-born population - Ireland (%)
Place of birth for the foreign-born population - Denmark (%)
Place of birth for the foreign-born population - Norway (%)
Place of birth for the foreign-born population - Sweden (%)
Place of birth for the foreign-born population - United Kingdom (%)
Place of birth for the foreign-born population - England (%)
Place of birth for the foreign-born population - Scotland (%)
Place of birth for the foreign-born population - Other Northern Europe (%)
Place of birth for the foreign-born population - Austria (%)
Place of birth for the foreign-born population - Belgium (%)
Place of birth for the foreign-born population - France (%)
Place of birth for the foreign-born population - Germany (%)
Place of birth for the foreign-born population - Netherlands (%)
Place of birth for the foreign-born population - Switzerland (%)
Place of birth for the foreign-born population - Other Western Europe (%)
Place of birth for the foreign-born population - Greece (%)
Place of birth for the foreign-born population - Italy (%)
Place of birth for the foreign-born population - Portugal (%)
Place of birth for the foreign-born population - Spain (%)
Place of birth for the foreign-born population - Other Southern Europe (%)
Place of birth for the foreign-born population - Albania (%)
Place of birth for the foreign-born population - Belarus (%)
Place of birth for the foreign-born population - Bosnia and Herzegovina (%)
Place of birth for the foreign-born population - Bulgaria (%)
Place of birth for the foreign-born population - Croatia (%)
Place of birth for the foreign-born population - Czechoslovakia (%)
Place of birth for the foreign-born population - Hungary (%)
Place of birth for the foreign-born population - Latvia (%)
Place of birth for the foreign-born population - Lithuania (%)
Place of birth for the foreign-born population - North Macedonia (Macedonia) (%)
Place of birth for the foreign-born population - Moldova (%)
Place of birth for the foreign-born population - Poland (%)
Place of birth for the foreign-born population - Romania (%)
Place of birth for the foreign-born population - Russia (%)
Place of birth for the foreign-born population - Serbia (%)
Place of birth for the foreign-born population - Ukraine (%)
Place of birth for the foreign-born population - Other Eastern Europe (%)
Place of birth for the foreign-born population - China (%)
Place of birth for the foreign-born population - Hong Kong (%)
Place of birth for the foreign-born population - Taiwan (%)
Place of birth for the foreign-born population - Japan (%)
Place of birth for the foreign-born population - Korea (%)
Place of birth for the foreign-born population - Other Eastern Asia (%)
Place of birth for the foreign-born population - Afghanistan (%)
Place of birth for the foreign-born population - Bangladesh (%)
Place of birth for the foreign-born population - India (%)
Place of birth for the foreign-born population - Iran (%)
Place of birth for the foreign-born population - Kazakhstan (%)
Place of birth for the foreign-born population - Nepal (%)
Place of birth for the foreign-born population - Pakistan (%)
Place of birth for the foreign-born population - Sri Lanka (%)
Place of birth for the foreign-born population - Uzbekistan (%)
Place of birth for the foreign-born population - Other South Central Asia (%)
Place of birth for the foreign-born population - Burma (%)
Place of birth for the foreign-born population - Cambodia (%)
Place of birth for the foreign-born population - Indonesia (%)
Place of birth for the foreign-born population - Laos (%)
Place of birth for the foreign-born population - Malaysia (%)
Place of birth for the foreign-born population - Philippines (%)
Place of birth for the foreign-born population - Singapore (%)
Place of birth for the foreign-born population - Thailand (%)
Place of birth for the foreign-born population - Vietnam (%)
Place of birth for the foreign-born population - Other South Eastern Asia (%)
Place of birth for the foreign-born population - Armenia (%)
Place of birth for the foreign-born population - Iraq (%)
Place of birth for the foreign-born population - Israel (%)
Place of birth for the foreign-born population - Jordan (%)
Place of birth for the foreign-born population - Kuwait (%)
Place of birth for the foreign-born population - Lebanon (%)
Place of birth for the foreign-born population - Saudi Arabia (%)
Place of birth for the foreign-born population - Syria (%)
Place of birth for the foreign-born population - Turkey (%)
Place of birth for the foreign-born population - Yemen (%)
Place of birth for the foreign-born population - Other Western Asia (%)
Place of birth for the foreign-born population - Eritrea (%)
Place of birth for the foreign-born population - Ethiopia (%)
Place of birth for the foreign-born population - Kenya (%)
Place of birth for the foreign-born population - Somalia (%)
Place of birth for the foreign-born population - Uganda (%)
Place of birth for the foreign-born population - Zimbabwe (%)
Place of birth for the foreign-born population - Other Eastern Africa (%)
Place of birth for the foreign-born population - Cameroon (%)
Place of birth for the foreign-born population - Congo (%)
Place of birth for the foreign-born population - Democratic Republic of Congo (Zaire) (%)
Place of birth for the foreign-born population - Other Middle Africa (%)
Place of birth for the foreign-born population - Egypt (%)
Place of birth for the foreign-born population - Morocco (%)
Place of birth for the foreign-born population - Sudan (%)
Place of birth for the foreign-born population - Other Northern Africa (%)
Place of birth for the foreign-born population - South Africa (%)
Place of birth for the foreign-born population - Other Southern Africa (%)
Place of birth for the foreign-born population - Cabo Verde (%)
Place of birth for the foreign-born population - Ghana (%)
Place of birth for the foreign-born population - Liberia (%)
Place of birth for the foreign-born population - Nigeria (%)
Place of birth for the foreign-born population - Senegal (%)
Place of birth for the foreign-born population - Sierra Leone (%)
Place of birth for the foreign-born population - Other Western Africa (%)
Place of birth for the foreign-born population - Australia (%)
Place of birth for the foreign-born population - New Zealand (%)
Place of birth for the foreign-born population - Fiji (%)
Place of birth for the foreign-born population - Micronesia (%)
Place of birth for the foreign-born population - Bahamas (%)
Place of birth for the foreign-born population - Barbados (%)
Place of birth for the foreign-born population - Cuba (%)
Place of birth for the foreign-born population - Dominica (%)
Place of birth for the foreign-born population - Dominican Republic (%)
Place of birth for the foreign-born population - Grenada (%)
Place of birth for the foreign-born population - Haiti (%)
Place of birth for the foreign-born population - Jamaica (%)
Place of birth for the foreign-born population - St. Vincent and the Grenadines (%)
Place of birth for the foreign-born population - Trinidad and Tobago (%)
Place of birth for the foreign-born population - West Indies (%)
Place of birth for the foreign-born population - Other Caribbean (%)
Place of birth for the foreign-born population - Belize (%)
Place of birth for the foreign-born population - Costa Rica (%)
Place of birth for the foreign-born population - El Salvador (%)
Place of birth for the foreign-born population - Guatemala (%)
Place of birth for the foreign-born population - Honduras (%)
Place of birth for the foreign-born population - Mexico (%)
Place of birth for the foreign-born population - Nicaragua (%)
Place of birth for the foreign-born population - Panama (%)
Place of birth for the foreign-born population - Other Central America (%)
Place of birth for the foreign-born population - Argentina (%)
Place of birth for the foreign-born population - Bolivia (%)
Place of birth for the foreign-born population - Brazil (%)
Place of birth for the foreign-born population - Chile (%)
Place of birth for the foreign-born population - Colombia (%)
Place of birth for the foreign-born population - Ecuador (%)
Place of birth for the foreign-born population - Guyana (%)
Place of birth for the foreign-born population - Peru (%)
Place of birth for the foreign-born population - Uruguay (%)
Place of birth for the foreign-born population - Venezuela (%)
Place of birth for the foreign-born population - Other South America (%)
Place of birth for the foreign-born population - Canada (%)
Place of birth for the foreign-born population - Other Northern America (%)
Place of birth for the foreign-born population - Other (%)
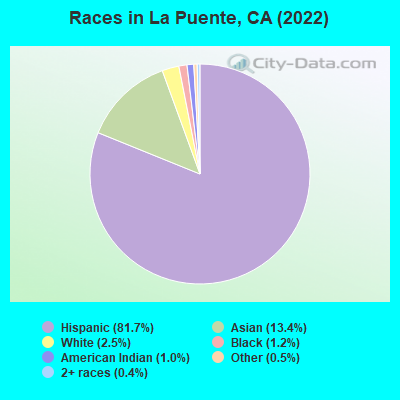
According to 2022 data, the most numerous races in La Puente, CA are Hispanic (33,760 residents), White alone (1,392 residents), and Asian alone (4,860 residents). 21.3% of La Puente residents speak English at home. 40.9% of La Puente, CA residents are foreign-born (30.9% born in Latin America, 9.0% born in Asia), which is 36.5% greater than the foreign-born rate of 26.0% across the entire state of California.
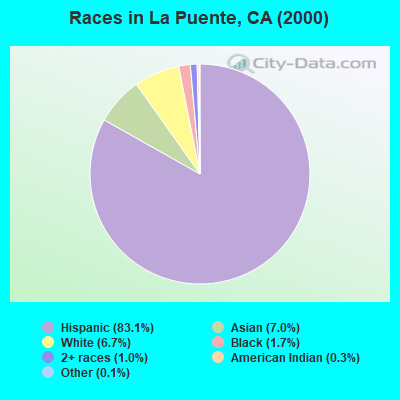
Race distribution in La Puente
2000 2022
15,816,790 46.7% White alone 10,966,556 32.4% Hispanic 3,648,860 10.8% Asian alone 2,181,926 6.4% Black alone 903,115 2.7% Two or more races 178,984 0.5% American Indian alone 103,736 0.3% Native Hawaiian and Other 71,681 0.2% Other race alone
15,732,184 40.3% Hispanic 13,160,426 33.7% White alone 5,957,867 15.3% Asian alone 2,025,218 5.2% Black alone 1,663,222 4.3% Two or more races 251,618 0.6% Other race alone 135,777 0.3% Native Hawaiian and Other 103,030 0.3% American Indian alone
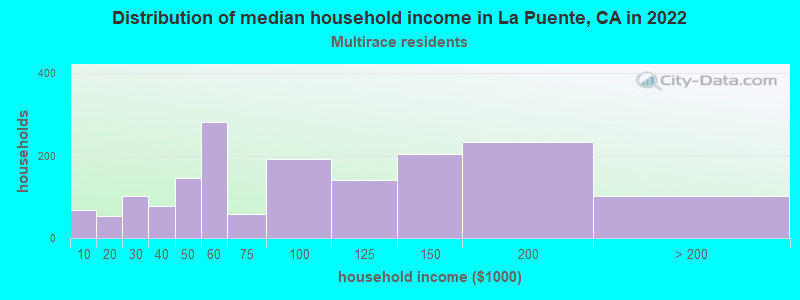
Income and house value in La Puente Median household income in 2022 $61,114 White non-Hispanic householders$113,296 Black householders$79,995 American Indian and Alaska Native householders$93,070 Asian householders$61,023 Native Hawaiian and other Pacific Islander householders$94,769 Some other race householders$70,577 Two or more races householders$91,068 Hispanic or Latino race householdersMedian 2022 house value $499,942 White Non-Hispanic householders$562,929 Black or African American householders$573,007 American Indian or Alaska Native householders $549,972 Asian householders$584,885 Native Hawaiian and other Pacific Islander householders$526,217 Some other race householders$540,614 Two or more races householders$528,736 Hispanic or Latino householders
Median age by race in La Puente
34.9 Median age for White residents34.3 36.8 44.8 Median age for Black or African American residents47.6 42.2 50.3 Median age for American Indian / Alaska Native residents45.9 51.1 47.7 Median age for Asian residents43.4 51.2 25.0 Median age for Native Hawaiian / Pacific Islander residents29.6 17.9 32.6 Median age for Other race residents32.5 32.9 36.8 Median age for Two or more races residents34.6 41.8 59.2 Median age for White alone residents54.4 61.9 32.5 Median age for Hispanic or Latino residents32.1 32.7
Owner/renter occupied households by race in La Puente
House owners and renters - White residents 1,820 57.4% Owner occupied1,353 42.6% Renter occupiedHouse owners and renters - Black or African American residents 69 56.7% Owner occupied53 43.3% Renter occupiedHouse owners and renters - American Indian / Alaska Native residents 255 75.7% Owner occupied82 24.3% Renter occupiedHouse owners and renters - Asian residents 971 65.2% Owner occupied518 34.8% Renter occupiedHouse owners and renters - Native Hawaiian / Pacific Islander residents 29 100.0% Owner occupiedHouse owners and renters - Other race residents 2,493 54.9% Owner occupied2,049 45.1% Renter occupiedHouse owners and renters - Two or more races residents 434 82.8% Owner occupied90 17.2% Renter occupiedHouse owners and renters - White alone residents 323 66.5% Owner occupied163 33.5% Renter occupiedHouse owners and renters - Hispanic or Latino residents 4,382 55.7% Owner occupied3,480 44.3% Renter occupied
Language usage in La Puente
English speakers - Total 21.3% of residents of La Puente speak English at home.
66.8% of residents speak Spanish at home 16,684 65.6% Speak English very well8,736 34.4% Speak English less than very well11.0% of residents speak other language at home 1,619 38.7% Speak English very well2,568 61.3% Speak English less than very well
English speakers - Born in the United States 62.9% of residents of La Puente speak English at home.
32.8% of residents speak Spanish at home 409 86.8% Speak English very well62 13.2% Speak English less than very well4.5% of residents speak other language at home 52 81.3% Speak English very well12 18.8% Speak English less than very well
English speakers - Native, born elsewhere 10.9% of residents of La Puente speak English at home.
50.1% of residents speak Spanish at home 162 79.8% Speak English very well41 20.2% Speak English less than very well38.3% of residents speak other language at home 94 60.6% Speak English very well61 39.4% Speak English less than very well
English speakers - Foreign-born 4.2% of residents of La Puente speak English at home.
71.6% of residents speak Spanish at home 3,502 30.8% Speak English very well7,875 69.2% Speak English less than very well21.9% of residents speak other language at home 1,093 31.4% Speak English very well2,390 68.6% Speak English less than very well
White (Caucasian) - Speak only English Native:
45.5% (3,715)Foreign-born:
8.1% (241)
White (Caucasian) - Speak another language Native:
44.1% (3,603)Foreign-born:
89.0% (2,656)
Black or African American - Speak only English Native:
91.3% (296)Foreign-born:
52.5% (10)
Black or African American - Speak another language Native:
9.6% (31)Foreign-born:
43.3% (8)
American Indian / Alaska Native - Speak only English Native:
35.4% (190)Foreign-born:
2.7% (9)
American Indian / Alaska Native - Speak another language Native:
80.3% (431)Foreign-born:
97.2% (337)
Asian - Speak only English Native:
30.0% (291)Foreign-born:
5.3% (194)
Asian - Speak another language Native:
68.1% (661)Foreign-born:
94.1% (3,460)
Native Hawaiian / Pacific Islander - Speak another language Native:
6.3% (7)Foreign-born:
97.0% (22)
Other race - Speak only English Native:
23.4% (2,747)Foreign-born:
2.5% (197)
Other race - Speak another language Native:
75.4% (8,844)Foreign-born:
96.7% (7,703)
Two or more races - Speak another language Native:
73.8% (1,058)Foreign-born:
100.0% (981)
White alone - Speak only English Native:
85.2% (1,104)Foreign-born:
64.3% (59)
White alone - Speak another language Native:
15.3% (198)Foreign-born:
33.5% (31)
Hispanic or Latino - Speak only English Native:
30.4% (6,240)Foreign-born:
3.8% (439)
Hispanic or Latino - Speak another language Native:
68.6% (14,081)Foreign-born:
95.8% (11,187)
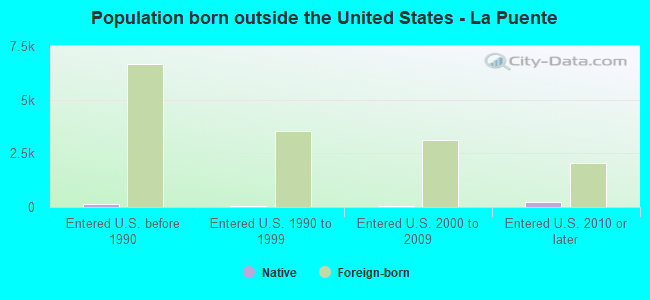
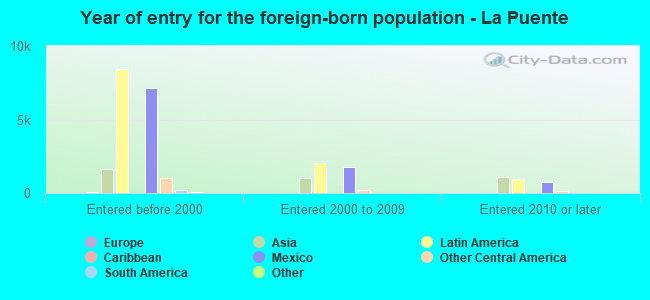
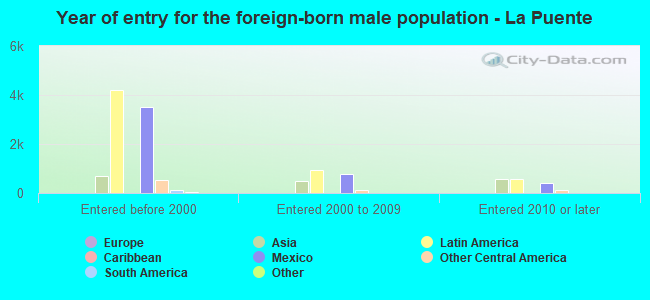
Foreign-born residents in La Puente 16,348 residents are foreign born (30.9% Latin America , 9.0% Asia ).
This city:
40.9%California:
100.0%
Marital status for residents in La Puente Marital status - White (Caucasian) population 15 years and over
Males 45.1% Never married43.6% Now married2.7% Separated2.1% Widowed6.5% DivorcedFemales 35.0% Never married39.3% Now married3.5% Separated10.7% Widowed11.5% DivorcedWomen who gave birth in the past 12 months Now married:
62.2% (120)Unmarried:
37.8% (73)
Women who did not give birth in the past 12 months Now married:
35.3% (951)Unmarried:
64.7% (1,745)
Marital status - Black or African American population 15 years and over
Males 48.1% Never married27.9% Now married0.0% Separated12.9% Widowed11.2% DivorcedFemales 36.5% Never married48.1% Now married5.8% Separated9.6% Widowed0.0% DivorcedWomen who gave birth in the past 12 months Now married:
100.0% (8)Unmarried:
0.0% (0)
Women who did not give birth in the past 12 months Now married:
25.5% (12)Unmarried:
74.5% (35)
Marital status - American Indian / Alaska Native population 15 years and over
Males 33.1% Never married50.9% Now married0.0% Separated12.0% Widowed3.9% DivorcedFemales 22.4% Never married57.7% Now married6.0% Separated0.0% Widowed13.9% DivorcedWomen who did not give birth in the past 12 months Now married:
31.6% (45)Unmarried:
68.4% (98)
Marital status - Asian population 15 years and over
Males 37.4% Never married52.1% Now married2.4% Separated1.0% Widowed7.2% DivorcedFemales 24.4% Never married47.7% Now married2.7% Separated16.3% Widowed9.0% DivorcedWomen who gave birth in the past 12 months Now married:
100.0% (78)Unmarried:
0.0% (0)
Women who did not give birth in the past 12 months Now married:
47.4% (452)Unmarried:
52.6% (502)
Marital status - Native Hawaiian / Pacific Islander population 15 years and over
Males 47.6% Never married15.2% Now married32.4% Separated0.0% Widowed4.8% DivorcedFemales 0.0% Never married100.0% Now married0.0% Separated0.0% Widowed0.0% DivorcedWomen who did not give birth in the past 12 months Now married:
100.0% (7)Unmarried:
0.0% (0)
Marital status - Other race population 15 years and over
Males 52.2% Never married40.3% Now married2.5% Separated1.5% Widowed3.6% DivorcedFemales 42.7% Never married38.1% Now married3.7% Separated7.0% Widowed8.6% DivorcedWomen who gave birth in the past 12 months Now married:
17.6% (42)Unmarried:
82.4% (196)
Women who did not give birth in the past 12 months Now married:
36.8% (1,935)Unmarried:
63.2% (3,323)
Marital status - Two or more races population 15 years and over
Males 72.6% Never married25.3% Now married0.0% Separated0.0% Widowed2.0% DivorcedFemales 33.8% Never married56.1% Now married4.1% Separated1.4% Widowed4.7% DivorcedWomen who gave birth in the past 12 months Now married:
0.0% (0)Unmarried:
100.0% (21)
Women who did not give birth in the past 12 months Now married:
45.9% (232)Unmarried:
54.1% (274)
Marital status - White alone, not Hispanic / Latino population 15 years and over
Males 48.9% Never married41.1% Now married1.8% Separated3.7% Widowed4.4% DivorcedFemales 23.3% Never married40.0% Now married0.9% Separated22.2% Widowed13.7% DivorcedWomen who did not give birth in the past 12 months Now married:
28.5% (48)Unmarried:
71.5% (121)
Marital status - Hispanic or Latino population 15 years and over
Males 49.4% Never married41.5% Now married2.5% Separated1.6% Widowed4.9% DivorcedFemales 39.7% Never married39.2% Now married3.8% Separated7.8% Widowed9.5% DivorcedWomen who gave birth in the past 12 months Now married:
40.5% (192)Unmarried:
59.5% (282)
Women who did not give birth in the past 12 months Now married:
36.8% (3,072)Unmarried:
63.2% (5,287)
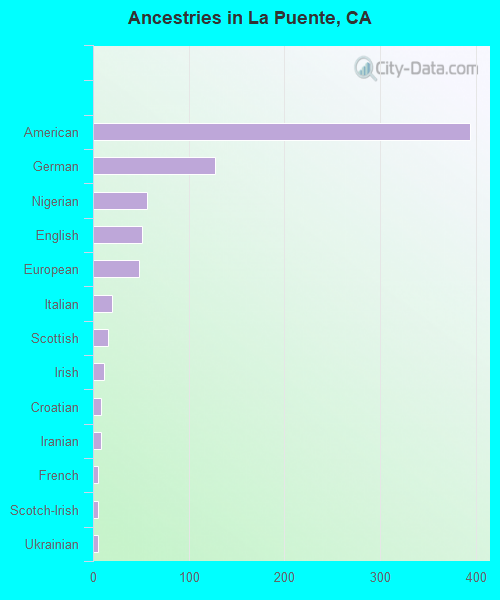
Ancestries in La Puente
318 1.0% American118 0.4% German102 0.3% European43 0.1% French39 0.1% Scottish35 0.1% English26 0.08% African25 0.08% Syrian18 0.06% Italian17 0.06% Irish16 0.05% Nigerian15 0.05% Russian6 0.02% Basque5 0.02% Scotch-Irish4 0.01% Swedish3 0.01% Polish2 0.01% Ukrainian2 0.01% Jamaican
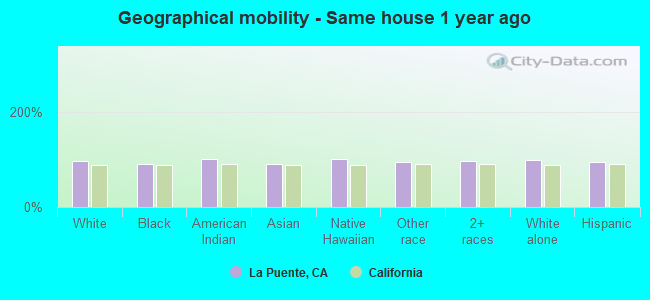
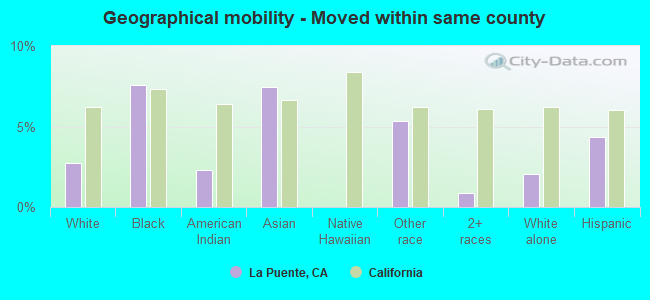
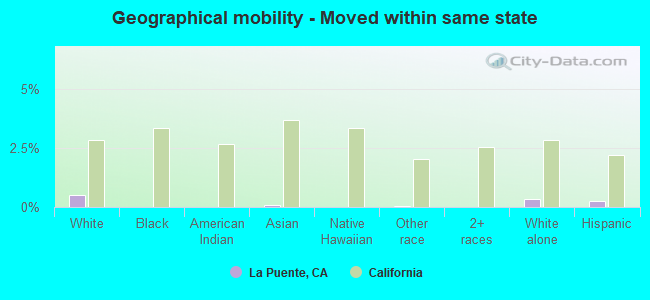
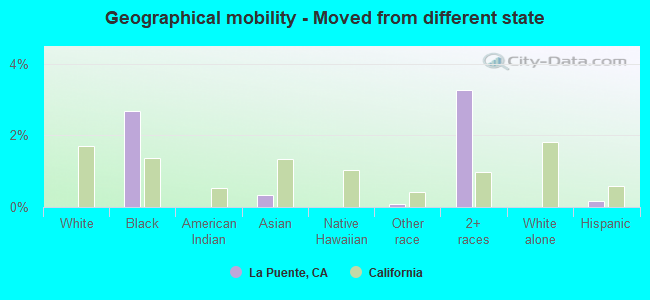
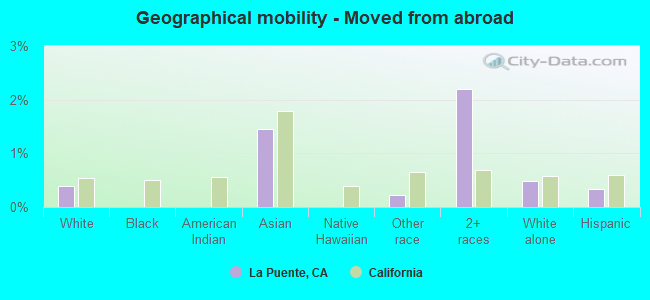
Geographical mobility in La Puente Same house 1 year ago 11,660 97.1% White (Caucasian)309 90.0% Black or African American866 100.0% American Indian / Alaska Native4,412 90.5% Asian149 100.0% Native Hawaiian / Pacific Islander19,246 94.9% Other race2,100 95.6% Two or more races1,391 98.1% White alone, not Hispanic / Latino31,931 95.4% Hispanic or LatinoMoved within same county 331 2.8% White / Caucasian26 7.6% Black or African American19 2.3% American Indian / Alaska Native365 7.5% Asian1,077 5.3% Other race19 0.9% Two or more races29 2.0% White alone, not Hispanic / Latino1,447 4.3% Hispanic or LatinoMoved within same state 63 0.5% White / Caucasian3 0.1% Asian7 0.0% Other race5 0.3% White alone, not Hispanic / Latino90 0.3% Hispanic or LatinoMoved from different state 9 2.7% Black or African American16 0.3% Asian19 0.1% Other race72 3.3% Two or more races60 0.2% Hispanic or LatinoMoved from abroad 47 0.4% White71 1.5% Asian45 0.2% Other race48 2.2% Two or more races7 0.5% White alone, not Hispanic / Latino114 0.3% Hispanic or Latino
Children Nativity (place of birth) in La Puente
Children under 6 years - Living with two parents Both parents native 418 100.0% NativeBoth parents foreign-born 369 97.0% Native12 3.0% Foreign-bornOne native, one foreign-born parent 177 89.7% Native20 10.3% Foreign-bornChildren under 6 years - Living with one parent Native parent 795 99.9% Native1 0.1% Foreign-bornForeign-born parent 307 86.8% Native47 13.2% Foreign-bornChildren 6 to 17 years - Living with two parents Both parents native 788 100.0% NativeBoth parents foreign-born 1,822 95.4% Native88 4.6% Foreign-bornOne native, one foreign-born parent 509 99.1% Native5 0.9% Foreign-bornChildren 6 to 17 years - Living with one parent Native parent 1,548 100.0% NativeForeign-born parent 1,398 51.5% Native1,317 48.5% Foreign-born
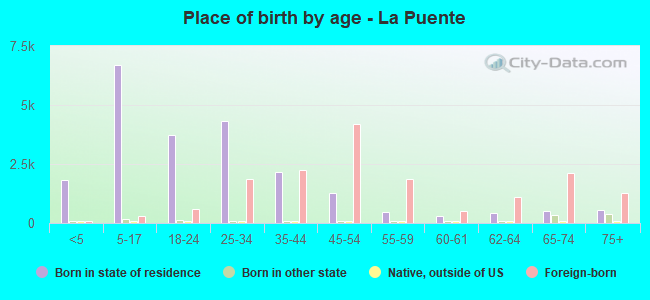
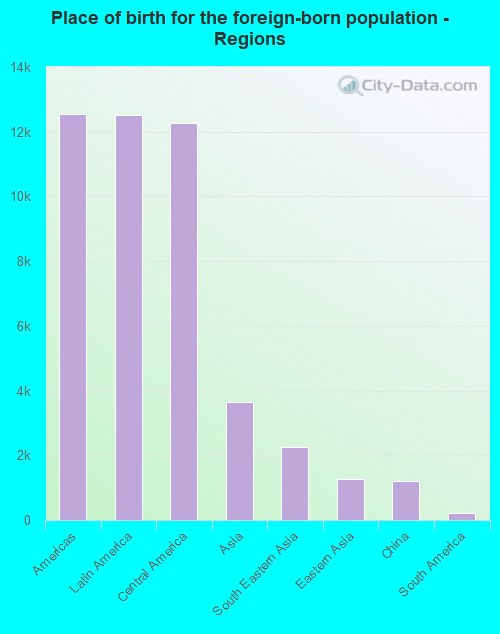
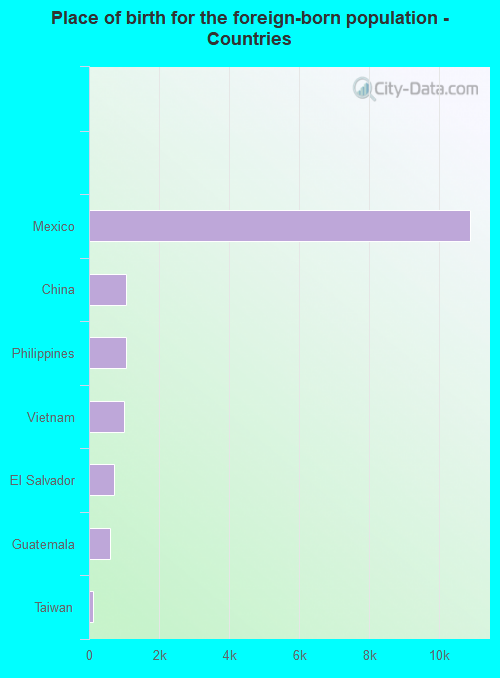
Place of birth for residents in La Puente 12,536 Americas12,529 Latin America12,279 Central America3,648 Asia2,246 South Eastern Asia1,279 Eastern Asia1,209 China216 South America86 Europe77 Oceania76 Western Asia45 South Central Asia32 Caribbean26 Western Europe21 Eastern Europe7 Northern America10,870 Mexico1,067 China1,043 Philippines1,004 Vietnam702 El Salvador606 Guatemala102 Taiwan92 Burma84 Ecuador69 Korea67 Colombia59 Fiji51 Nicaragua45 India41 Saudi Arabia39 Hong Kong37 Thailand34 Chile32 Honduras30 Cuba27 Indonesia24 Bolivia22 Syria21 Russia20 Switzerland18 Cambodia17 Laos11 Panama7 Canada6 Malaysia6 Venezuela6 France5 Costa Rica2 Jamaica
Grandparents responsible for own grandchildren in La Puente
Grandparents (30 to 59 years) White / Caucasian 11 6.0% Responsible for grandchildren174 94.0% Not responsible for grandchildrenAmerican Indian / Alaska Native 37 100.0% Not responsible for grandchildrenAsian 9 13.3% Responsible for grandchildren61 86.7% Not responsible for grandchildrenOther race 110 19.5% Responsible for grandchildren451 80.5% Not responsible for grandchildrenTwo or more races 32 100.0% Not responsible for grandchildrenWhite alone, not Hispanic / Latino 4 35.5% Responsible for grandchildren8 64.5% Not responsible for grandchildrenHispanic or Latino 99 12.3% Responsible for grandchildren706 87.7% Not responsible for grandchildrenGrandparents (60 years and over) White / Caucasian 81 14.8% Responsible for grandchildren464 85.2% Not responsible for grandchildrenAmerican Indian / Alaska Native 17 19.7% Responsible for grandchildren68 80.3% Not responsible for grandchildrenAsian 97 100.0% Not responsible for grandchildrenOther race 81 11.7% Responsible for grandchildren610 88.3% Not responsible for grandchildrenTwo or more races 315 100.0% Not responsible for grandchildrenWhite alone, not Hispanic / Latino 15 21.2% Responsible for grandchildren57 78.8% Not responsible for grandchildrenHispanic or Latino 162 12.4% Responsible for grandchildren1,144 87.6% Not responsible for grandchildren