Races in Lafayette, California (CA) Detailed Stats
Data:
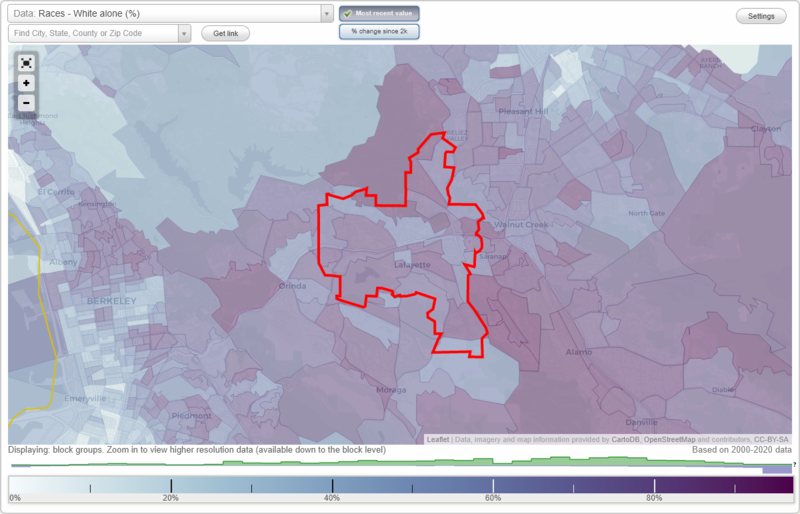
Races - White alone (%)
Races - White alone (% change since 2000)
Races - Black alone (%)
Races - Black alone (% change since 2000)
Races - American Indian alone (%)
Races - American Indian alone (% change since 2000)
Races - Asian alone (%)
Races - Asian alone (% change since 2000)
Races - Hispanic (%)
Races - Hispanic (% change since 2000)
Races - Native Hawaiian and Other Pacific Islander alone (%)
Races - Native Hawaiian and Other Pacific Islander alone (% change since 2000)
Races - Two or more races(%)
Races - Two or more races(% change since 2000)
Races - Other race alone (%)
Races - Other race alone (% change since 2000)
Racial diversity
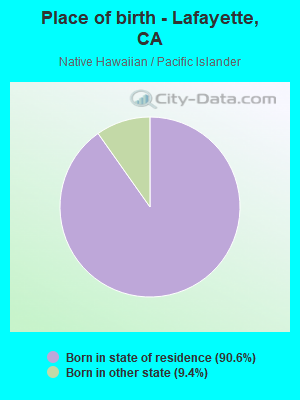
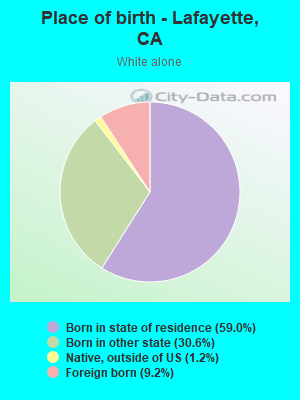
Place of birth - Born in state of residence (%)
Place of birth - Born in state of residence (%) - White
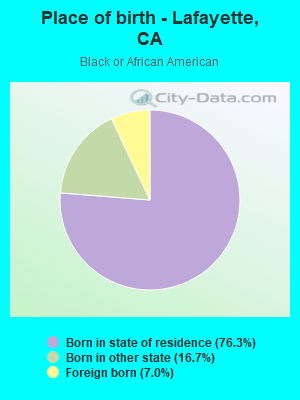
Place of birth - Born in state of residence (%) - Black or African American
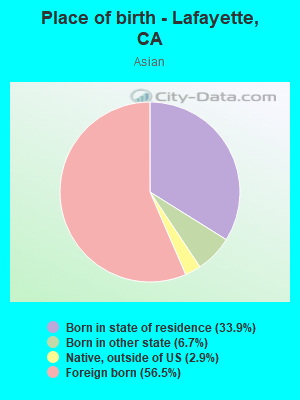
Place of birth - Born in state of residence (%) - Asian
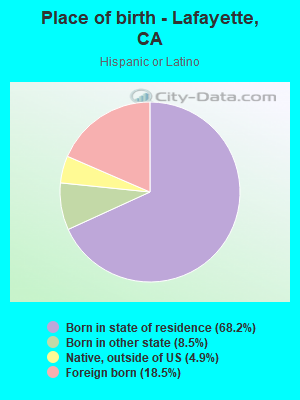
Place of birth - Born in state of residence (%) - Hispanic or Latino
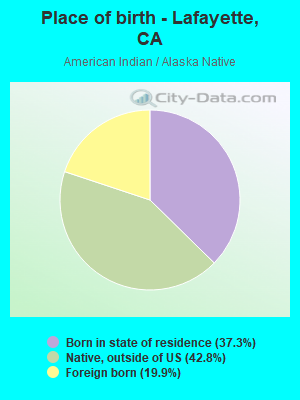
Place of birth - Born in state of residence (%) - American Indian and Alaska Native
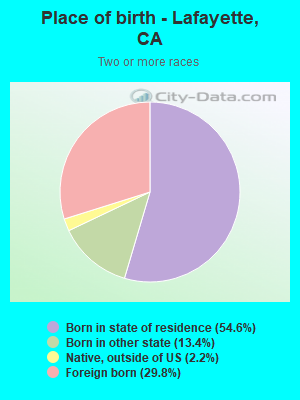
Place of birth - Born in state of residence (%) - Multirace
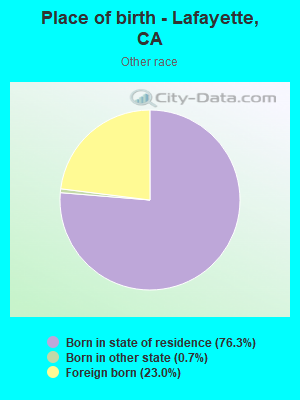
Place of birth - Born in state of residence (%) - Other Race
Place of birth - Born in other state (%)
Place of birth - Born in other state (%) - White
Place of birth - Born in other state (%) - Black or African American
Place of birth - Born in other state (%) - Asian
Place of birth - Born in other state (%) - Hispanic or Latino
Place of birth - Born in other state (%) - American Indian and Alaska Native
Place of birth - Born in other state (%) - Multirace
Place of birth - Born in other state (%) - Other Race
Place of birth - Native, outside of US (%)
Place of birth - Native, outside of US (%) - White
Place of birth - Native, outside of US (%) - Black or African American
Place of birth - Native, outside of US (%) - Asian
Place of birth - Native, outside of US (%) - Hispanic or Latino
Place of birth - Native, outside of US (%) - American Indian and Alaska Native
Place of birth - Native, outside of US (%) - Multirace
Place of birth - Native, outside of US (%) - Other Race
Place of birth - Foreign born (%)
Place of birth - Foreign born (%) - White
Place of birth - Foreign born (%) - Black or African American
Place of birth - Foreign born (%) - Asian
Place of birth - Foreign born (%) - Hispanic or Latino
Place of birth - Foreign born (%) - American Indian and Alaska Native
Place of birth - Foreign born (%) - Multirace
Place of birth - Foreign born (%) - Other Race
Residents speaking English at home (%)
Residents speaking English at home - Born in the United States (%)
Residents speaking English at home - Native, born elsewhere (%)
Residents speaking English at home - Foreign born (%)
Residents speaking Spanish at home (%)
Residents speaking Spanish at home - Born in the United States (%)
Residents speaking Spanish at home - Native, born elsewhere (%)
Residents speaking Spanish at home - Foreign born (%)
Residents speaking other language at home (%)
Residents speaking other language at home - Born in the United States (%)
Residents speaking other language at home - Native, born elsewhere (%)
Residents speaking other language at home - Foreign born (%)
Marital status - Never married (%)
Marital status - Now married (%)
Marital status - Separated (%)
Marital status - Widowed (%)
Marital status - Divorced (%)
Ancestries Reported - Arab (%)
Ancestries Reported - Czech (%)
Ancestries Reported - Danish (%)
Ancestries Reported - Dutch (%)
Ancestries Reported - English (%)
Ancestries Reported - French (%)
Ancestries Reported - French Canadian (%)
Ancestries Reported - German (%)
Ancestries Reported - Greek (%)
Ancestries Reported - Hungarian (%)
Ancestries Reported - Irish (%)
Ancestries Reported - Italian (%)
Ancestries Reported - Lithuanian (%)
Ancestries Reported - Norwegian (%)
Ancestries Reported - Polish (%)
Ancestries Reported - Portuguese (%)
Ancestries Reported - Russian (%)
Ancestries Reported - Scotch-Irish (%)
Ancestries Reported - Scottish (%)
Ancestries Reported - Slovak (%)
Ancestries Reported - Subsaharan African (%)
Ancestries Reported - Swedish (%)
Ancestries Reported - Swiss (%)
Ancestries Reported - Ukrainian (%)
Ancestries Reported - United States (%)
Ancestries Reported - Welsh (%)
Ancestries Reported - West Indian (%)
Ancestries Reported - Other (%)
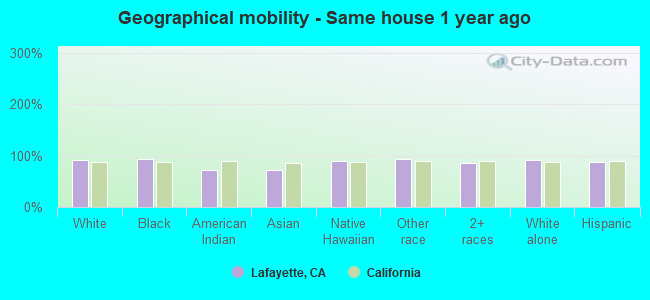
Geographical mobility - Same house 1 year ago (%)
Geographical mobility - Same house 1 year ago (%) - White
Geographical mobility - Same house 1 year ago (%) - Black or African American
Geographical mobility - Same house 1 year ago (%) - Asian
Geographical mobility - Same house 1 year ago (%) - Hispanic or Latino
Geographical mobility - Same house 1 year ago (%) - American Indian and Alaska Native
Geographical mobility - Same house 1 year ago (%) - Multirace
Geographical mobility - Same house 1 year ago (%) - Other Race
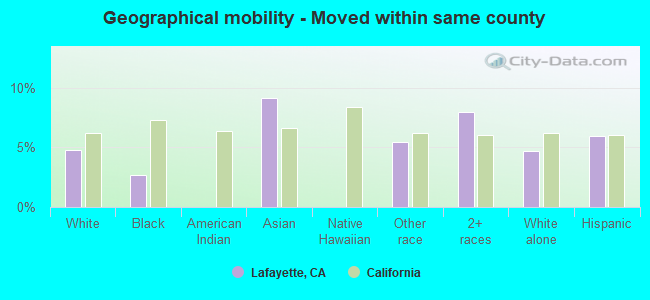
Geographical mobility - Moved within same county (%)
Geographical mobility - Moved within same county (%) - White
Geographical mobility - Moved within same county (%) - Black or African American
Geographical mobility - Moved within same county (%) - Asian
Geographical mobility - Moved within same county (%) - Hispanic or Latino
Geographical mobility - Moved within same county (%) - American Indian and Alaska Native
Geographical mobility - Moved within same county (%) - Multirace
Geographical mobility - Moved within same county (%) - Other Race
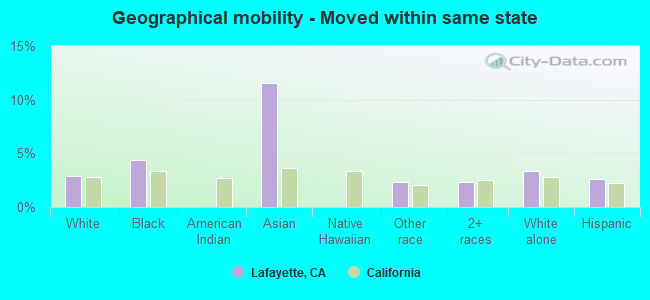
Geographical mobility - Moved from different county within same state (%)
Geographical mobility - Moved from different county within same state (%) - White
Geographical mobility - Moved from different county within same state (%) - Black or African American
Geographical mobility - Moved from different county within same state (%) - Asian
Geographical mobility - Moved from different county within same state (%) - Hispanic or Latino
Geographical mobility - Moved from different county within same state (%) - American Indian and Alaska Native
Geographical mobility - Moved from different county within same state (%) - Multirace
Geographical mobility - Moved from different county within same state (%) - Other Race
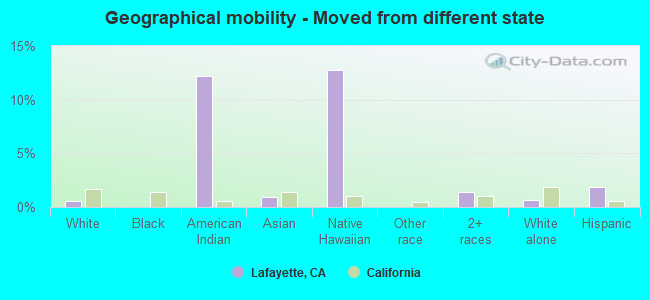
Geographical mobility - Moved from different state (%)
Geographical mobility - Moved from different state (%) - White
Geographical mobility - Moved from different state (%) - Black or African American
Geographical mobility - Moved from different state (%) - Asian
Geographical mobility - Moved from different state (%) - Hispanic or Latino
Geographical mobility - Moved from different state (%) - American Indian and Alaska Native
Geographical mobility - Moved from different state (%) - Multirace
Geographical mobility - Moved from different state (%) - Other Race
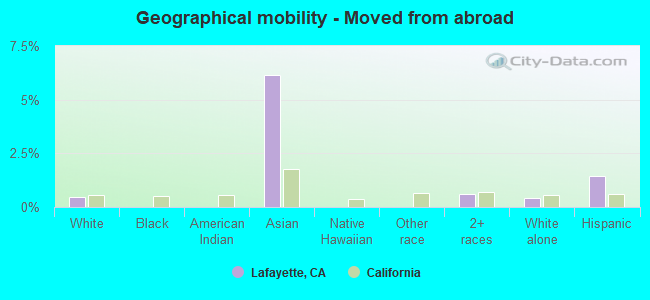
Geographical mobility - Moved from abroad (%)
Geographical mobility - Moved from abroad (%) - White
Geographical mobility - Moved from abroad (%) - Black or African American
Geographical mobility - Moved from abroad (%) - Asian
Geographical mobility - Moved from abroad (%) - Hispanic or Latino
Geographical mobility - Moved from abroad (%) - American Indian and Alaska Native
Geographical mobility - Moved from abroad (%) - Multirace
Geographical mobility - Moved from abroad (%) - Other Race
Place of birth for the foreign-born population - Ireland (%)
Place of birth for the foreign-born population - Denmark (%)
Place of birth for the foreign-born population - Norway (%)
Place of birth for the foreign-born population - Sweden (%)
Place of birth for the foreign-born population - United Kingdom (%)
Place of birth for the foreign-born population - England (%)
Place of birth for the foreign-born population - Scotland (%)
Place of birth for the foreign-born population - Other Northern Europe (%)
Place of birth for the foreign-born population - Austria (%)
Place of birth for the foreign-born population - Belgium (%)
Place of birth for the foreign-born population - France (%)
Place of birth for the foreign-born population - Germany (%)
Place of birth for the foreign-born population - Netherlands (%)
Place of birth for the foreign-born population - Switzerland (%)
Place of birth for the foreign-born population - Other Western Europe (%)
Place of birth for the foreign-born population - Greece (%)
Place of birth for the foreign-born population - Italy (%)
Place of birth for the foreign-born population - Portugal (%)
Place of birth for the foreign-born population - Spain (%)
Place of birth for the foreign-born population - Other Southern Europe (%)
Place of birth for the foreign-born population - Albania (%)
Place of birth for the foreign-born population - Belarus (%)
Place of birth for the foreign-born population - Bosnia and Herzegovina (%)
Place of birth for the foreign-born population - Bulgaria (%)
Place of birth for the foreign-born population - Croatia (%)
Place of birth for the foreign-born population - Czechoslovakia (%)
Place of birth for the foreign-born population - Hungary (%)
Place of birth for the foreign-born population - Latvia (%)
Place of birth for the foreign-born population - Lithuania (%)
Place of birth for the foreign-born population - North Macedonia (Macedonia) (%)
Place of birth for the foreign-born population - Moldova (%)
Place of birth for the foreign-born population - Poland (%)
Place of birth for the foreign-born population - Romania (%)
Place of birth for the foreign-born population - Russia (%)
Place of birth for the foreign-born population - Serbia (%)
Place of birth for the foreign-born population - Ukraine (%)
Place of birth for the foreign-born population - Other Eastern Europe (%)
Place of birth for the foreign-born population - China (%)
Place of birth for the foreign-born population - Hong Kong (%)
Place of birth for the foreign-born population - Taiwan (%)
Place of birth for the foreign-born population - Japan (%)
Place of birth for the foreign-born population - Korea (%)
Place of birth for the foreign-born population - Other Eastern Asia (%)
Place of birth for the foreign-born population - Afghanistan (%)
Place of birth for the foreign-born population - Bangladesh (%)
Place of birth for the foreign-born population - India (%)
Place of birth for the foreign-born population - Iran (%)
Place of birth for the foreign-born population - Kazakhstan (%)
Place of birth for the foreign-born population - Nepal (%)
Place of birth for the foreign-born population - Pakistan (%)
Place of birth for the foreign-born population - Sri Lanka (%)
Place of birth for the foreign-born population - Uzbekistan (%)
Place of birth for the foreign-born population - Other South Central Asia (%)
Place of birth for the foreign-born population - Burma (%)
Place of birth for the foreign-born population - Cambodia (%)
Place of birth for the foreign-born population - Indonesia (%)
Place of birth for the foreign-born population - Laos (%)
Place of birth for the foreign-born population - Malaysia (%)
Place of birth for the foreign-born population - Philippines (%)
Place of birth for the foreign-born population - Singapore (%)
Place of birth for the foreign-born population - Thailand (%)
Place of birth for the foreign-born population - Vietnam (%)
Place of birth for the foreign-born population - Other South Eastern Asia (%)
Place of birth for the foreign-born population - Armenia (%)
Place of birth for the foreign-born population - Iraq (%)
Place of birth for the foreign-born population - Israel (%)
Place of birth for the foreign-born population - Jordan (%)
Place of birth for the foreign-born population - Kuwait (%)
Place of birth for the foreign-born population - Lebanon (%)
Place of birth for the foreign-born population - Saudi Arabia (%)
Place of birth for the foreign-born population - Syria (%)
Place of birth for the foreign-born population - Turkey (%)
Place of birth for the foreign-born population - Yemen (%)
Place of birth for the foreign-born population - Other Western Asia (%)
Place of birth for the foreign-born population - Eritrea (%)
Place of birth for the foreign-born population - Ethiopia (%)
Place of birth for the foreign-born population - Kenya (%)
Place of birth for the foreign-born population - Somalia (%)
Place of birth for the foreign-born population - Uganda (%)
Place of birth for the foreign-born population - Zimbabwe (%)
Place of birth for the foreign-born population - Other Eastern Africa (%)
Place of birth for the foreign-born population - Cameroon (%)
Place of birth for the foreign-born population - Congo (%)
Place of birth for the foreign-born population - Democratic Republic of Congo (Zaire) (%)
Place of birth for the foreign-born population - Other Middle Africa (%)
Place of birth for the foreign-born population - Egypt (%)
Place of birth for the foreign-born population - Morocco (%)
Place of birth for the foreign-born population - Sudan (%)
Place of birth for the foreign-born population - Other Northern Africa (%)
Place of birth for the foreign-born population - South Africa (%)
Place of birth for the foreign-born population - Other Southern Africa (%)
Place of birth for the foreign-born population - Cabo Verde (%)
Place of birth for the foreign-born population - Ghana (%)
Place of birth for the foreign-born population - Liberia (%)
Place of birth for the foreign-born population - Nigeria (%)
Place of birth for the foreign-born population - Senegal (%)
Place of birth for the foreign-born population - Sierra Leone (%)
Place of birth for the foreign-born population - Other Western Africa (%)
Place of birth for the foreign-born population - Australia (%)
Place of birth for the foreign-born population - New Zealand (%)
Place of birth for the foreign-born population - Fiji (%)
Place of birth for the foreign-born population - Micronesia (%)
Place of birth for the foreign-born population - Bahamas (%)
Place of birth for the foreign-born population - Barbados (%)
Place of birth for the foreign-born population - Cuba (%)
Place of birth for the foreign-born population - Dominica (%)
Place of birth for the foreign-born population - Dominican Republic (%)
Place of birth for the foreign-born population - Grenada (%)
Place of birth for the foreign-born population - Haiti (%)
Place of birth for the foreign-born population - Jamaica (%)
Place of birth for the foreign-born population - St. Vincent and the Grenadines (%)
Place of birth for the foreign-born population - Trinidad and Tobago (%)
Place of birth for the foreign-born population - West Indies (%)
Place of birth for the foreign-born population - Other Caribbean (%)
Place of birth for the foreign-born population - Belize (%)
Place of birth for the foreign-born population - Costa Rica (%)
Place of birth for the foreign-born population - El Salvador (%)
Place of birth for the foreign-born population - Guatemala (%)
Place of birth for the foreign-born population - Honduras (%)
Place of birth for the foreign-born population - Mexico (%)
Place of birth for the foreign-born population - Nicaragua (%)
Place of birth for the foreign-born population - Panama (%)
Place of birth for the foreign-born population - Other Central America (%)
Place of birth for the foreign-born population - Argentina (%)
Place of birth for the foreign-born population - Bolivia (%)
Place of birth for the foreign-born population - Brazil (%)
Place of birth for the foreign-born population - Chile (%)
Place of birth for the foreign-born population - Colombia (%)
Place of birth for the foreign-born population - Ecuador (%)
Place of birth for the foreign-born population - Guyana (%)
Place of birth for the foreign-born population - Peru (%)
Place of birth for the foreign-born population - Uruguay (%)
Place of birth for the foreign-born population - Venezuela (%)
Place of birth for the foreign-born population - Other South America (%)
Place of birth for the foreign-born population - Canada (%)
Place of birth for the foreign-born population - Other Northern America (%)
Place of birth for the foreign-born population - Other (%)
Latest news about races in Lafayette, CA collected exclusively by city-data.com from local newspapers, TV, and radio stations
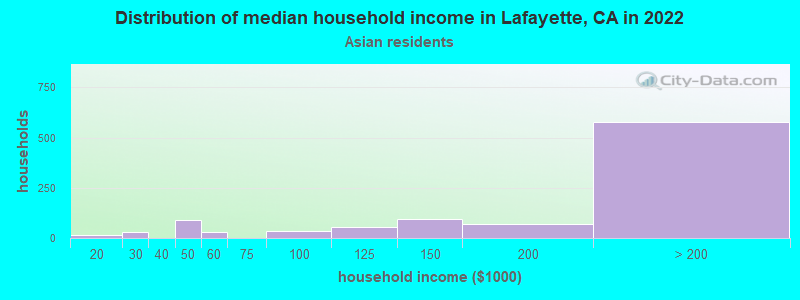
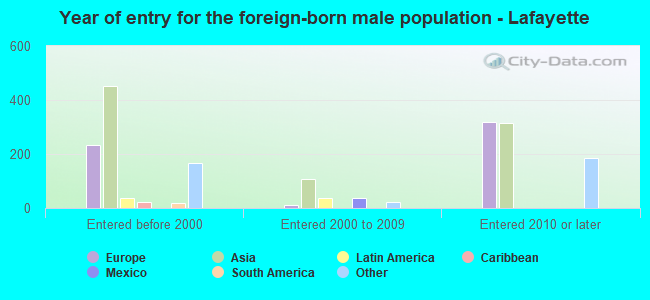
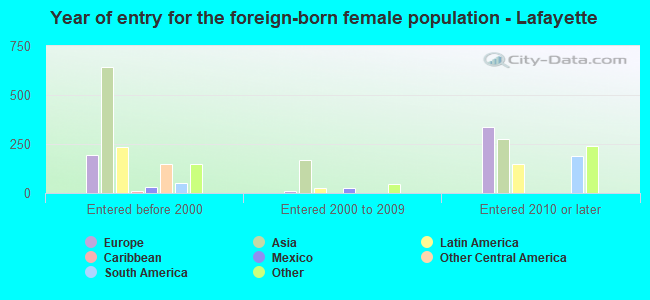
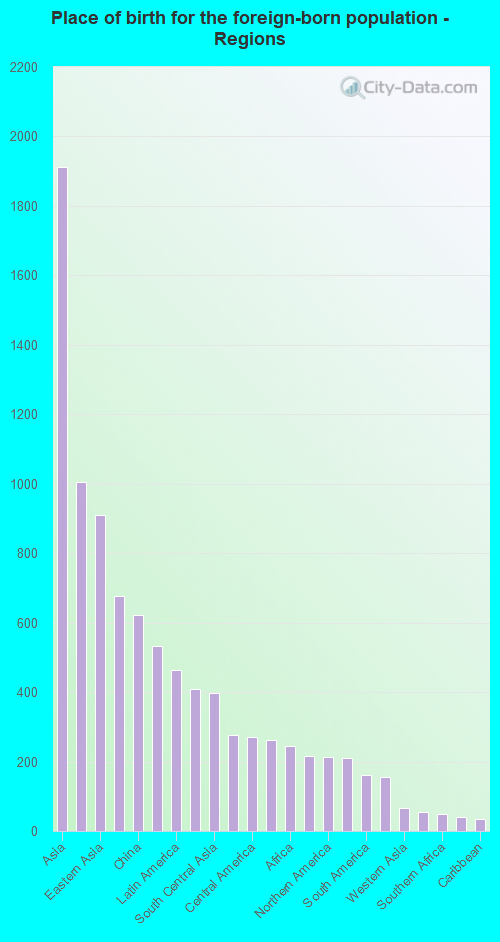
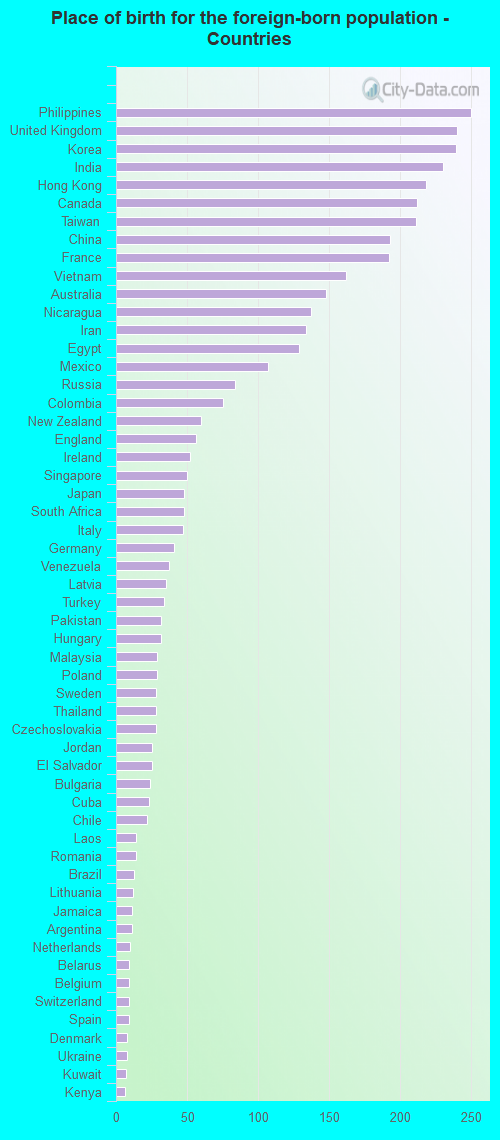
According to 2022 data, the most numerous races in Lafayette, CA are Hispanic (2,357 residents), White alone (18,353 residents), and Asian alone (3,322 residents). 84.1% of Lafayette residents speak English at home. 15.2% of Lafayette, CA residents are foreign-born (7.2% born in Asia, 3.8% born in Europe, 1.7% born in Latin America), which is 70.6% less than the foreign-born rate of 26.0% across the entire state of California.
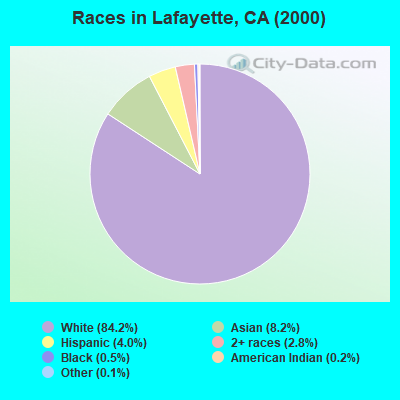
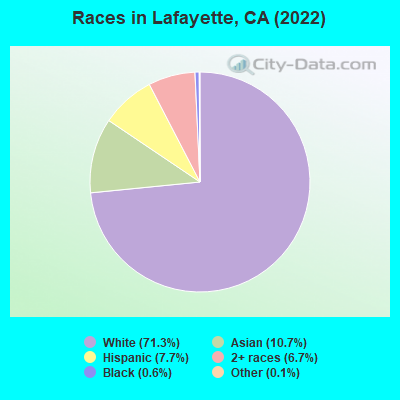
Race distribution in Lafayette
2000 2022
15,816,790 46.7% White alone 10,966,556 32.4% Hispanic 3,648,860 10.8% Asian alone 2,181,926 6.4% Black alone 903,115 2.7% Two or more races 178,984 0.5% American Indian alone 103,736 0.3% Native Hawaiian and Other 71,681 0.2% Other race alone
15,732,184 40.3% Hispanic 13,160,426 33.7% White alone 5,957,867 15.3% Asian alone 2,025,218 5.2% Black alone 1,663,222 4.3% Two or more races 251,618 0.6% Other race alone 135,777 0.3% Native Hawaiian and Other 103,030 0.3% American Indian alone
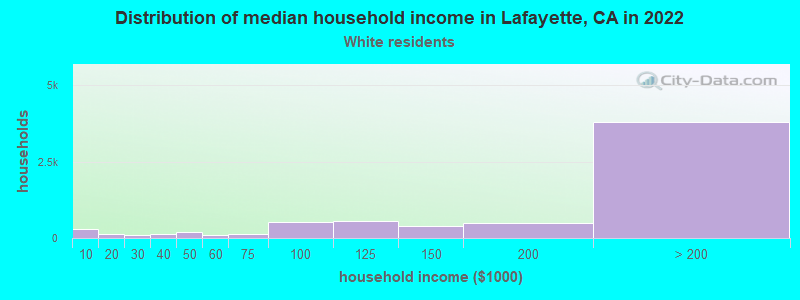
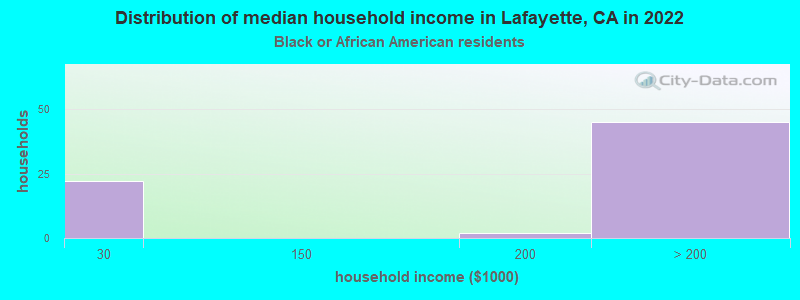
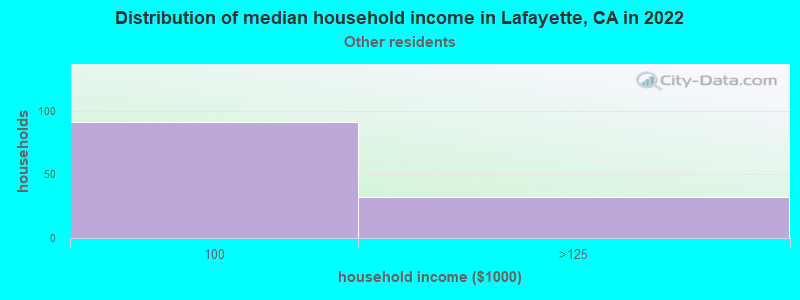
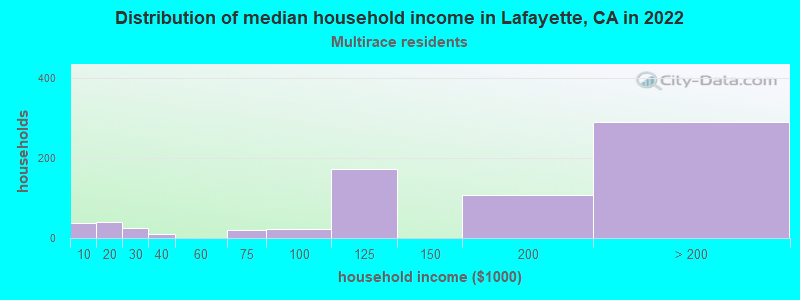
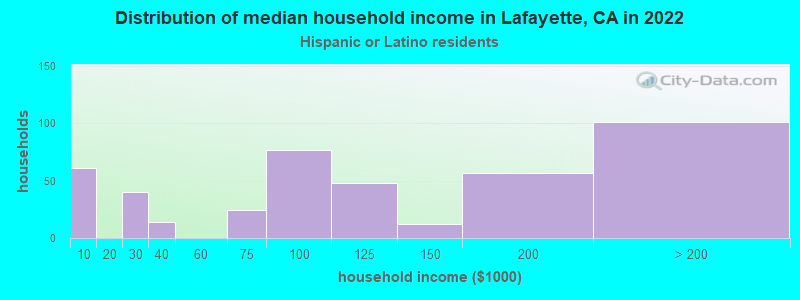
Income and house value in Lafayette Median household income in 2022 over $200,000 White non-Hispanic householdersover $200,000 Black householders$75,337 American Indian and Alaska Native householdersover $200,000 Asian householdersover $200,000 Native Hawaiian and other Pacific Islander householders$116,927 Some other race householders$120,290 Two or more races householders$156,543 Hispanic or Latino race householdersMedian 2022 house value over $1,000,000 White Non-Hispanic householdersover $1,000,000 Black or African American householdersover $1,000,000 American Indian or Alaska Native householders over $1,000,000 Asian householdersover $1,000,000 Native Hawaiian and other Pacific Islander householdersover $1,000,000 Some other race householdersover $1,000,000 Two or more races householdersover $1,000,000 Hispanic or Latino householders
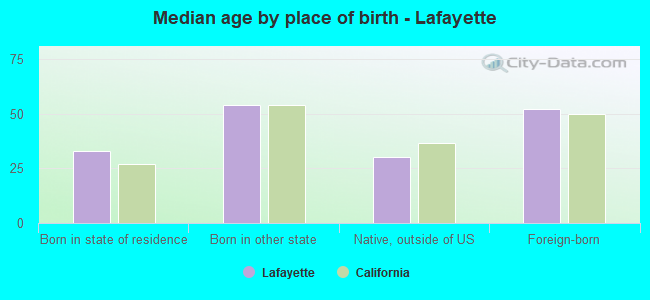
Median age by race in Lafayette
51.8 Median age for White residents52.3 51.6 56.3 Median age for Black or African American residents48.7 71.0 14.4 Median age for American Indian / Alaska Native residents41.5 Median age for Asian residents43.7 40.9 23.3 Median age for Native Hawaiian / Pacific Islander residents33.7 Median age for Other race residents34.4 29.1 22.0 Median age for Two or more races residents20.4 25.6 49.6 Median age for White alone residents50.1 48.8 31.1 Median age for Hispanic or Latino residents25.6 37.6
Owner/renter occupied households by race in Lafayette
House owners and renters - White residents 5,260 77.1% Owner occupied1,561 22.9% Renter occupiedHouse owners and renters - Black or African American residents 12 17.1% Owner occupied58 82.9% Renter occupiedHouse owners and renters - Asian residents 709 66.5% Owner occupied358 33.5% Renter occupiedHouse owners and renters - Other race residents 147 100.0% Renter occupiedHouse owners and renters - Two or more races residents 304 36.0% Owner occupied540 64.0% Renter occupiedHouse owners and renters - White alone residents 5,553 76.4% Owner occupied1,715 23.6% Renter occupiedHouse owners and renters - Hispanic or Latino residents 219 34.0% Owner occupied425 66.0% Renter occupied
Language usage in Lafayette
English speakers - Total 84.1% of residents of Lafayette speak English at home.
3.8% of residents speak Spanish at home 701 73.5% Speak English very well253 26.5% Speak English less than very well12.8% of residents speak other language at home 2,633 81.2% Speak English very well609 18.8% Speak English less than very well
English speakers - Born in the United States 95.3% of residents of Lafayette speak English at home.
1.3% of residents speak Spanish at home 86 100.0% Speak English very well3.3% of residents speak other language at home 186 85.3% Speak English very well32 14.7% Speak English less than very well
English speakers - Native, born elsewhere 71.9% of residents of Lafayette speak English at home.
10.4% of residents speak Spanish at home 43 87.8% Speak English very well6 12.2% Speak English less than very well17.1% of residents speak other language at home 74 91.4% Speak English very well7 8.6% Speak English less than very well
English speakers - Foreign-born 40.5% of residents of Lafayette speak English at home.
10.4% of residents speak Spanish at home 269 66.6% Speak English very well135 33.4% Speak English less than very well54.2% of residents speak other language at home 1,584 75.0% Speak English very well528 25.0% Speak English less than very well
White (Caucasian) - Speak only English Native:
100.0% (15,001)Foreign-born:
78.2% (880)
White (Caucasian) - Speak another language Native:
3.5% (527)Foreign-born:
46.4% (523)
Black or African American - Speak only English Native:
100.0% (138)Foreign-born:
99.6% (10)
American Indian / Alaska Native - Speak only English Native:
88.0% (73)Foreign-born:
59.3% (12)
Asian - Speak only English Native:
75.1% (1,030)Foreign-born:
31.2% (572)
Asian - Speak another language Native:
26.5% (363)Foreign-born:
72.0% (1,321)
Other race - Speak only English Native:
34.5% (127)Foreign-born:
6.0% (6)
Other race - Speak another language Native:
65.4% (241)Foreign-born:
91.9% (97)
Two or more races - Speak only English Native:
65.2% (1,724)Foreign-born:
4.1% (61)
Two or more races - Speak another language Native:
32.1% (848)Foreign-born:
100.0% (1,481)
White alone - Speak only English Native:
95.7% (15,342)Foreign-born:
50.1% (899)
White alone - Speak another language Native:
4.3% (691)Foreign-born:
49.2% (883)
Hispanic or Latino - Speak only English Native:
72.6% (1,188)Foreign-born:
16.4% (72)
Hispanic or Latino - Speak another language Native:
27.4% (447)Foreign-born:
85.2% (375)
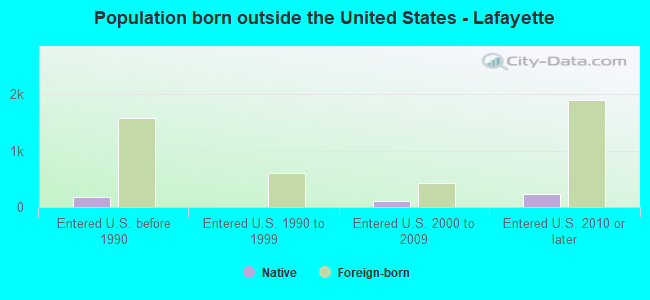
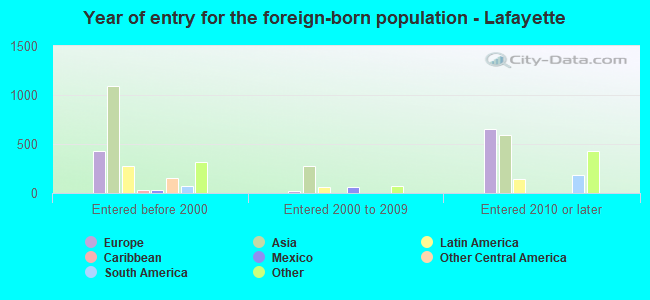
Foreign-born residents in Lafayette 4,056 residents are foreign born (7.2% Asia , 3.8% Europe , 1.7% Latin America ).
This city:
15.2%California:
100.0%
Marital status for residents in Lafayette Marital status - White (Caucasian) population 15 years and over
Males 21.1% Never married68.8% Now married1.1% Separated3.7% Widowed5.4% DivorcedFemales 24.8% Never married57.8% Now married1.9% Separated4.2% Widowed11.2% DivorcedWomen who gave birth in the past 12 months Now married:
87.5% (54)Unmarried:
12.5% (8)
Women who did not give birth in the past 12 months Now married:
49.4% (1,440)Unmarried:
50.6% (1,475)
Marital status - Black or African American population 15 years and over
Males 31.7% Never married24.4% Now married0.0% Separated0.0% Widowed43.9% DivorcedFemales 8.4% Never married14.0% Now married15.9% Separated46.7% Widowed15.0% DivorcedWomen who did not give birth in the past 12 months Now married:
35.3% (11)Unmarried:
64.7% (21)
Marital status - American Indian / Alaska Native population 15 years and over
Males 0.0% Never married0.0% Now married0.0% Separated0.0% Widowed100.0% DivorcedFemales 80.0% Never married20.0% Now married0.0% Separated0.0% Widowed0.0% DivorcedWomen who did not give birth in the past 12 months Now married:
20.0% (9)Unmarried:
80.0% (35)
Marital status - Asian population 15 years and over
Males 23.3% Never married75.8% Now married0.0% Separated0.9% Widowed0.0% DivorcedFemales 19.0% Never married79.6% Now married0.0% Separated1.3% Widowed0.0% DivorcedWomen who gave birth in the past 12 months Now married:
100.0% (51)Unmarried:
0.0% (0)
Women who did not give birth in the past 12 months Now married:
71.0% (642)Unmarried:
29.0% (262)
Marital status - Native Hawaiian / Pacific Islander population 15 years and over
Males 0.0% Never married100.0% Now married0.0% Separated0.0% Widowed0.0% DivorcedFemales 100.0% Never married0.0% Now married0.0% Separated0.0% Widowed0.0% DivorcedWomen who did not give birth in the past 12 months Now married:
0.0% (0)Unmarried:
100.0% (8)
Marital status - Other race population 15 years and over
Males 57.5% Never married42.5% Now married0.0% Separated0.0% Widowed0.0% DivorcedFemales 5.2% Never married93.3% Now married0.0% Separated1.5% Widowed0.0% DivorcedWomen who did not give birth in the past 12 months Now married:
94.4% (99)Unmarried:
5.6% (6)
Marital status - Two or more races population 15 years and over
Males 57.8% Never married38.8% Now married0.0% Separated0.0% Widowed3.4% DivorcedFemales 54.2% Never married25.6% Now married0.0% Separated0.0% Widowed20.2% DivorcedWomen who did not give birth in the past 12 months Now married:
25.3% (257)Unmarried:
74.7% (757)
Marital status - White alone, not Hispanic / Latino population 15 years and over
Males 20.1% Never married69.6% Now married1.1% Separated3.8% Widowed5.4% DivorcedFemales 25.2% Never married57.3% Now married1.9% Separated4.4% Widowed11.2% DivorcedWomen who gave birth in the past 12 months Now married:
100.0% (56)Unmarried:
0.0% (0)
Women who did not give birth in the past 12 months Now married:
47.9% (1,583)Unmarried:
52.1% (1,721)
Marital status - Hispanic or Latino population 15 years and over
Males 53.6% Never married44.4% Now married0.0% Separated0.0% Widowed2.0% DivorcedFemales 30.1% Never married57.8% Now married1.6% Separated1.6% Widowed8.9% DivorcedWomen who gave birth in the past 12 months Now married:
56.0% (14)Unmarried:
44.0% (11)
Women who did not give birth in the past 12 months Now married:
61.2% (369)Unmarried:
38.8% (234)
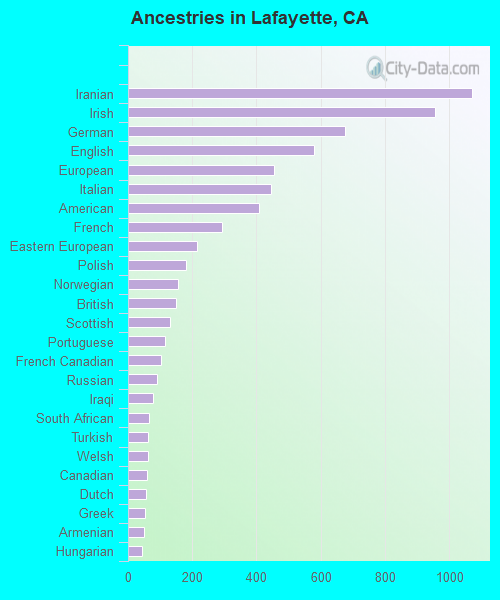
Ancestries in Lafayette
845 7.8% European706 6.5% Irish620 5.7% English573 5.3% German565 5.2% American484 4.5% Italian386 3.6% Eastern European242 2.2% British204 1.9% Portuguese172 1.6% Northern European153 1.4% Russian142 1.3% Norwegian117 1.1% French116 1.1% Iranian112 1.0% Swedish107 1.0% Canadian89 0.8% Hungarian84 0.8% Scottish68 0.6% Dutch67 0.6% Finnish61 0.6% Scandinavian53 0.5% Egyptian49 0.5% Serbian47 0.4% Ukrainian45 0.4% Polish39 0.4% Australian39 0.4% Czech37 0.3% Afghan37 0.3% Turkish31 0.3% Romanian30 0.3% Croatian28 0.3% Jordanian28 0.3% Latvian23 0.2% Brazilian22 0.2% Bulgarian22 0.2% Swiss18 0.2% Greek17 0.2% Lithuanian15 0.1% Celtic14 0.1% Lebanese14 0.1% Danish13 0.1% Jamaican12 0.1% Yugoslavian11 0.1% French Canadian8 0.07% Austrian8 0.07% South African7 0.06% Belgian7 0.06% Palestinian6 0.06% Scotch-Irish1 0.01% African
Geographical mobility in Lafayette Same house 1 year ago 14,881 91.7% White (Caucasian)136 93.1% Black or African American81 72.5% American Indian / Alaska Native2,378 72.1% Asian8 88.9% Native Hawaiian / Pacific Islander333 92.7% Other race3,418 86.7% Two or more races17,087 91.3% White alone, not Hispanic / Latino2,009 88.1% Hispanic or LatinoMoved within same county 772 4.8% White / Caucasian4 2.7% Black or African American301 9.1% Asian20 5.4% Other race313 7.9% Two or more races877 4.7% White alone, not Hispanic / Latino137 6.0% Hispanic or LatinoMoved within same state 472 2.9% White / Caucasian6 4.3% Black or African American382 11.6% Asian8 2.3% Other race94 2.4% Two or more races633 3.4% White alone, not Hispanic / Latino60 2.6% Hispanic or LatinoMoved from different state 96 0.6% White / Caucasian14 12.2% American Indian / Alaska Native30 0.9% Asian1 12.8% Native Hawaiian / Pacific Islander57 1.4% Two or more races123 0.7% White alone, not Hispanic / Latino42 1.8% Hispanic or LatinoMoved from abroad 75 0.5% White203 6.1% Asian23 0.6% Two or more races83 0.4% White alone, not Hispanic / Latino32 1.4% Hispanic or Latino
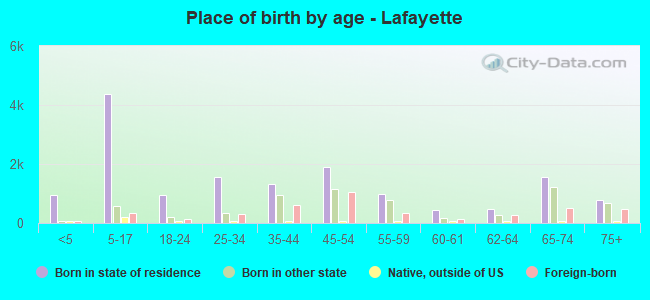
Children Nativity (place of birth) in Lafayette
Children under 6 years - Living with two parents Both parents native 755 100.0% NativeBoth parents foreign-born 64 54.3% Native54 45.7% Foreign-bornOne native, one foreign-born parent 246 94.6% Native14 5.4% Foreign-bornChildren under 6 years - Living with one parent Native parent 86 100.0% NativeChildren 6 to 17 years - Living with two parents Both parents native 2,856 100.0% Native1 0.0% Foreign-bornBoth parents foreign-born 277 56.6% Native213 43.4% Foreign-bornOne native, one foreign-born parent 881 100.0% NativeChildren 6 to 17 years - Living with one parent Native parent 390 100.0% NativeForeign-born parent 237 62.3% Native143 37.7% Foreign-born
Grandparents responsible for own grandchildren in Lafayette
Grandparents (30 to 59 years) White / Caucasian 8 100.0% Responsible for grandchildrenWhite alone, not Hispanic / Latino 5 100.0% Responsible for grandchildrenGrandparents (60 years and over) White / Caucasian 52 28.3% Responsible for grandchildren132 71.7% Not responsible for grandchildrenWhite alone, not Hispanic / Latino 49 24.3% Responsible for grandchildren154 75.7% Not responsible for grandchildren