Races in Lakeside, California (CA) Detailed Stats
Data:
Races - White alone (%)
Races - White alone (% change since 2000)
Races - Black alone (%)
Races - Black alone (% change since 2000)
Races - American Indian alone (%)
Races - American Indian alone (% change since 2000)
Races - Asian alone (%)
Races - Asian alone (% change since 2000)
Races - Hispanic (%)
Races - Hispanic (% change since 2000)
Races - Native Hawaiian and Other Pacific Islander alone (%)
Races - Native Hawaiian and Other Pacific Islander alone (% change since 2000)
Races - Two or more races(%)
Races - Two or more races(% change since 2000)
Races - Other race alone (%)
Races - Other race alone (% change since 2000)
Racial diversity
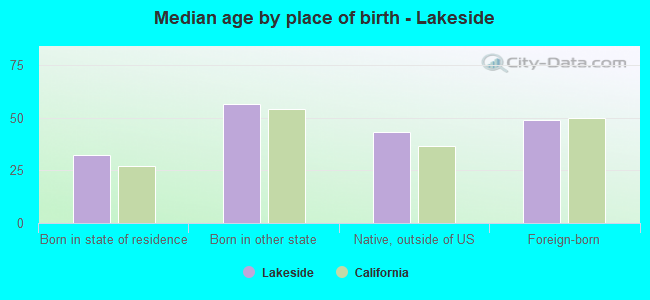
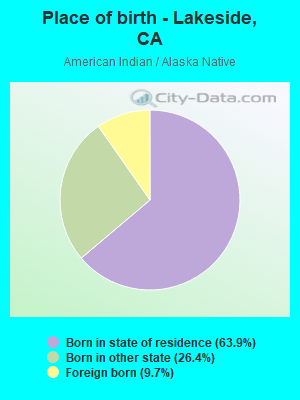
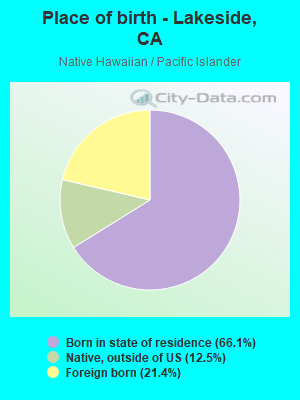
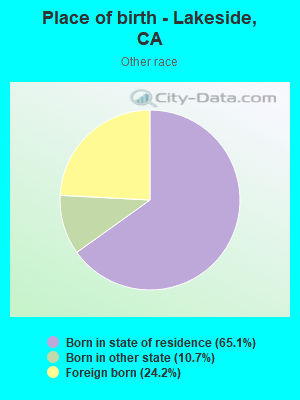
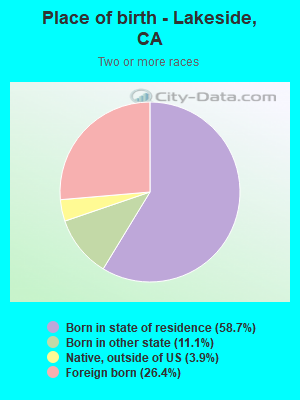
Place of birth - Born in state of residence (%)
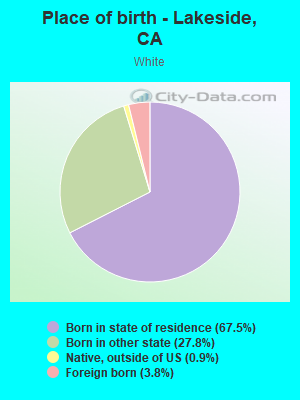
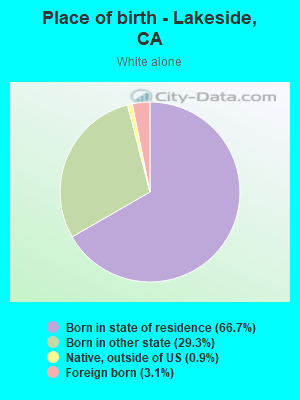
Place of birth - Born in state of residence (%) - White
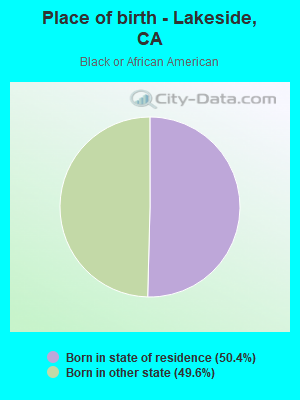
Place of birth - Born in state of residence (%) - Black or African American
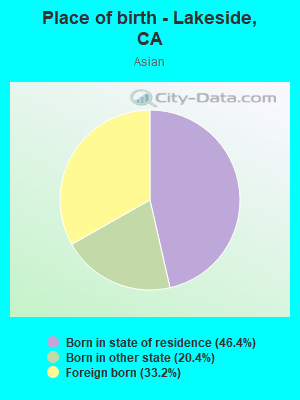
Place of birth - Born in state of residence (%) - Asian
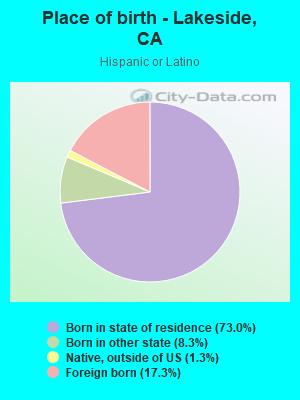
Place of birth - Born in state of residence (%) - Hispanic or Latino
Place of birth - Born in state of residence (%) - American Indian and Alaska Native
Place of birth - Born in state of residence (%) - Multirace
Place of birth - Born in state of residence (%) - Other Race
Place of birth - Born in other state (%)
Place of birth - Born in other state (%) - White
Place of birth - Born in other state (%) - Black or African American
Place of birth - Born in other state (%) - Asian
Place of birth - Born in other state (%) - Hispanic or Latino
Place of birth - Born in other state (%) - American Indian and Alaska Native
Place of birth - Born in other state (%) - Multirace
Place of birth - Born in other state (%) - Other Race
Place of birth - Native, outside of US (%)
Place of birth - Native, outside of US (%) - White
Place of birth - Native, outside of US (%) - Black or African American
Place of birth - Native, outside of US (%) - Asian
Place of birth - Native, outside of US (%) - Hispanic or Latino
Place of birth - Native, outside of US (%) - American Indian and Alaska Native
Place of birth - Native, outside of US (%) - Multirace
Place of birth - Native, outside of US (%) - Other Race
Place of birth - Foreign born (%)
Place of birth - Foreign born (%) - White
Place of birth - Foreign born (%) - Black or African American
Place of birth - Foreign born (%) - Asian
Place of birth - Foreign born (%) - Hispanic or Latino
Place of birth - Foreign born (%) - American Indian and Alaska Native
Place of birth - Foreign born (%) - Multirace
Place of birth - Foreign born (%) - Other Race
Residents speaking English at home (%)
Residents speaking English at home - Born in the United States (%)
Residents speaking English at home - Native, born elsewhere (%)
Residents speaking English at home - Foreign born (%)
Residents speaking Spanish at home (%)
Residents speaking Spanish at home - Born in the United States (%)
Residents speaking Spanish at home - Native, born elsewhere (%)
Residents speaking Spanish at home - Foreign born (%)
Residents speaking other language at home (%)
Residents speaking other language at home - Born in the United States (%)
Residents speaking other language at home - Native, born elsewhere (%)
Residents speaking other language at home - Foreign born (%)
Marital status - Never married (%)
Marital status - Now married (%)
Marital status - Separated (%)
Marital status - Widowed (%)
Marital status - Divorced (%)
Ancestries Reported - Arab (%)
Ancestries Reported - Czech (%)
Ancestries Reported - Danish (%)
Ancestries Reported - Dutch (%)
Ancestries Reported - English (%)
Ancestries Reported - French (%)
Ancestries Reported - French Canadian (%)
Ancestries Reported - German (%)
Ancestries Reported - Greek (%)
Ancestries Reported - Hungarian (%)
Ancestries Reported - Irish (%)
Ancestries Reported - Italian (%)
Ancestries Reported - Lithuanian (%)
Ancestries Reported - Norwegian (%)
Ancestries Reported - Polish (%)
Ancestries Reported - Portuguese (%)
Ancestries Reported - Russian (%)
Ancestries Reported - Scotch-Irish (%)
Ancestries Reported - Scottish (%)
Ancestries Reported - Slovak (%)
Ancestries Reported - Subsaharan African (%)
Ancestries Reported - Swedish (%)
Ancestries Reported - Swiss (%)
Ancestries Reported - Ukrainian (%)
Ancestries Reported - United States (%)
Ancestries Reported - Welsh (%)
Ancestries Reported - West Indian (%)
Ancestries Reported - Other (%)
Geographical mobility - Same house 1 year ago (%)
Geographical mobility - Same house 1 year ago (%) - White
Geographical mobility - Same house 1 year ago (%) - Black or African American
Geographical mobility - Same house 1 year ago (%) - Asian
Geographical mobility - Same house 1 year ago (%) - Hispanic or Latino
Geographical mobility - Same house 1 year ago (%) - American Indian and Alaska Native
Geographical mobility - Same house 1 year ago (%) - Multirace
Geographical mobility - Same house 1 year ago (%) - Other Race
Geographical mobility - Moved within same county (%)
Geographical mobility - Moved within same county (%) - White
Geographical mobility - Moved within same county (%) - Black or African American
Geographical mobility - Moved within same county (%) - Asian
Geographical mobility - Moved within same county (%) - Hispanic or Latino
Geographical mobility - Moved within same county (%) - American Indian and Alaska Native
Geographical mobility - Moved within same county (%) - Multirace
Geographical mobility - Moved within same county (%) - Other Race
Geographical mobility - Moved from different county within same state (%)
Geographical mobility - Moved from different county within same state (%) - White
Geographical mobility - Moved from different county within same state (%) - Black or African American
Geographical mobility - Moved from different county within same state (%) - Asian
Geographical mobility - Moved from different county within same state (%) - Hispanic or Latino
Geographical mobility - Moved from different county within same state (%) - American Indian and Alaska Native
Geographical mobility - Moved from different county within same state (%) - Multirace
Geographical mobility - Moved from different county within same state (%) - Other Race
Geographical mobility - Moved from different state (%)
Geographical mobility - Moved from different state (%) - White
Geographical mobility - Moved from different state (%) - Black or African American
Geographical mobility - Moved from different state (%) - Asian
Geographical mobility - Moved from different state (%) - Hispanic or Latino
Geographical mobility - Moved from different state (%) - American Indian and Alaska Native
Geographical mobility - Moved from different state (%) - Multirace
Geographical mobility - Moved from different state (%) - Other Race
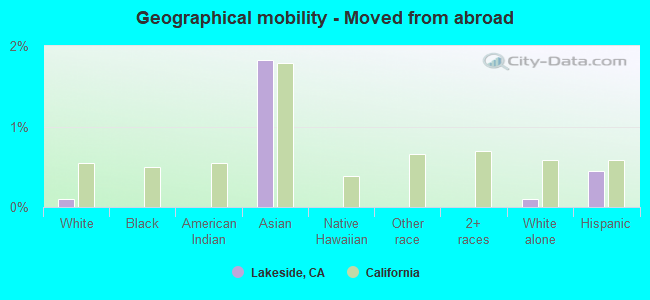
Geographical mobility - Moved from abroad (%)
Geographical mobility - Moved from abroad (%) - White
Geographical mobility - Moved from abroad (%) - Black or African American
Geographical mobility - Moved from abroad (%) - Asian
Geographical mobility - Moved from abroad (%) - Hispanic or Latino
Geographical mobility - Moved from abroad (%) - American Indian and Alaska Native
Geographical mobility - Moved from abroad (%) - Multirace
Geographical mobility - Moved from abroad (%) - Other Race
Place of birth for the foreign-born population - Ireland (%)
Place of birth for the foreign-born population - Denmark (%)
Place of birth for the foreign-born population - Norway (%)
Place of birth for the foreign-born population - Sweden (%)
Place of birth for the foreign-born population - United Kingdom (%)
Place of birth for the foreign-born population - England (%)
Place of birth for the foreign-born population - Scotland (%)
Place of birth for the foreign-born population - Other Northern Europe (%)
Place of birth for the foreign-born population - Austria (%)
Place of birth for the foreign-born population - Belgium (%)
Place of birth for the foreign-born population - France (%)
Place of birth for the foreign-born population - Germany (%)
Place of birth for the foreign-born population - Netherlands (%)
Place of birth for the foreign-born population - Switzerland (%)
Place of birth for the foreign-born population - Other Western Europe (%)
Place of birth for the foreign-born population - Greece (%)
Place of birth for the foreign-born population - Italy (%)
Place of birth for the foreign-born population - Portugal (%)
Place of birth for the foreign-born population - Spain (%)
Place of birth for the foreign-born population - Other Southern Europe (%)
Place of birth for the foreign-born population - Albania (%)
Place of birth for the foreign-born population - Belarus (%)
Place of birth for the foreign-born population - Bosnia and Herzegovina (%)
Place of birth for the foreign-born population - Bulgaria (%)
Place of birth for the foreign-born population - Croatia (%)
Place of birth for the foreign-born population - Czechoslovakia (%)
Place of birth for the foreign-born population - Hungary (%)
Place of birth for the foreign-born population - Latvia (%)
Place of birth for the foreign-born population - Lithuania (%)
Place of birth for the foreign-born population - North Macedonia (Macedonia) (%)
Place of birth for the foreign-born population - Moldova (%)
Place of birth for the foreign-born population - Poland (%)
Place of birth for the foreign-born population - Romania (%)
Place of birth for the foreign-born population - Russia (%)
Place of birth for the foreign-born population - Serbia (%)
Place of birth for the foreign-born population - Ukraine (%)
Place of birth for the foreign-born population - Other Eastern Europe (%)
Place of birth for the foreign-born population - China (%)
Place of birth for the foreign-born population - Hong Kong (%)
Place of birth for the foreign-born population - Taiwan (%)
Place of birth for the foreign-born population - Japan (%)
Place of birth for the foreign-born population - Korea (%)
Place of birth for the foreign-born population - Other Eastern Asia (%)
Place of birth for the foreign-born population - Afghanistan (%)
Place of birth for the foreign-born population - Bangladesh (%)
Place of birth for the foreign-born population - India (%)
Place of birth for the foreign-born population - Iran (%)
Place of birth for the foreign-born population - Kazakhstan (%)
Place of birth for the foreign-born population - Nepal (%)
Place of birth for the foreign-born population - Pakistan (%)
Place of birth for the foreign-born population - Sri Lanka (%)
Place of birth for the foreign-born population - Uzbekistan (%)
Place of birth for the foreign-born population - Other South Central Asia (%)
Place of birth for the foreign-born population - Burma (%)
Place of birth for the foreign-born population - Cambodia (%)
Place of birth for the foreign-born population - Indonesia (%)
Place of birth for the foreign-born population - Laos (%)
Place of birth for the foreign-born population - Malaysia (%)
Place of birth for the foreign-born population - Philippines (%)
Place of birth for the foreign-born population - Singapore (%)
Place of birth for the foreign-born population - Thailand (%)
Place of birth for the foreign-born population - Vietnam (%)
Place of birth for the foreign-born population - Other South Eastern Asia (%)
Place of birth for the foreign-born population - Armenia (%)
Place of birth for the foreign-born population - Iraq (%)
Place of birth for the foreign-born population - Israel (%)
Place of birth for the foreign-born population - Jordan (%)
Place of birth for the foreign-born population - Kuwait (%)
Place of birth for the foreign-born population - Lebanon (%)
Place of birth for the foreign-born population - Saudi Arabia (%)
Place of birth for the foreign-born population - Syria (%)
Place of birth for the foreign-born population - Turkey (%)
Place of birth for the foreign-born population - Yemen (%)
Place of birth for the foreign-born population - Other Western Asia (%)
Place of birth for the foreign-born population - Eritrea (%)
Place of birth for the foreign-born population - Ethiopia (%)
Place of birth for the foreign-born population - Kenya (%)
Place of birth for the foreign-born population - Somalia (%)
Place of birth for the foreign-born population - Uganda (%)
Place of birth for the foreign-born population - Zimbabwe (%)
Place of birth for the foreign-born population - Other Eastern Africa (%)
Place of birth for the foreign-born population - Cameroon (%)
Place of birth for the foreign-born population - Congo (%)
Place of birth for the foreign-born population - Democratic Republic of Congo (Zaire) (%)
Place of birth for the foreign-born population - Other Middle Africa (%)
Place of birth for the foreign-born population - Egypt (%)
Place of birth for the foreign-born population - Morocco (%)
Place of birth for the foreign-born population - Sudan (%)
Place of birth for the foreign-born population - Other Northern Africa (%)
Place of birth for the foreign-born population - South Africa (%)
Place of birth for the foreign-born population - Other Southern Africa (%)
Place of birth for the foreign-born population - Cabo Verde (%)
Place of birth for the foreign-born population - Ghana (%)
Place of birth for the foreign-born population - Liberia (%)
Place of birth for the foreign-born population - Nigeria (%)
Place of birth for the foreign-born population - Senegal (%)
Place of birth for the foreign-born population - Sierra Leone (%)
Place of birth for the foreign-born population - Other Western Africa (%)
Place of birth for the foreign-born population - Australia (%)
Place of birth for the foreign-born population - New Zealand (%)
Place of birth for the foreign-born population - Fiji (%)
Place of birth for the foreign-born population - Micronesia (%)
Place of birth for the foreign-born population - Bahamas (%)
Place of birth for the foreign-born population - Barbados (%)
Place of birth for the foreign-born population - Cuba (%)
Place of birth for the foreign-born population - Dominica (%)
Place of birth for the foreign-born population - Dominican Republic (%)
Place of birth for the foreign-born population - Grenada (%)
Place of birth for the foreign-born population - Haiti (%)
Place of birth for the foreign-born population - Jamaica (%)
Place of birth for the foreign-born population - St. Vincent and the Grenadines (%)
Place of birth for the foreign-born population - Trinidad and Tobago (%)
Place of birth for the foreign-born population - West Indies (%)
Place of birth for the foreign-born population - Other Caribbean (%)
Place of birth for the foreign-born population - Belize (%)
Place of birth for the foreign-born population - Costa Rica (%)
Place of birth for the foreign-born population - El Salvador (%)
Place of birth for the foreign-born population - Guatemala (%)
Place of birth for the foreign-born population - Honduras (%)
Place of birth for the foreign-born population - Mexico (%)
Place of birth for the foreign-born population - Nicaragua (%)
Place of birth for the foreign-born population - Panama (%)
Place of birth for the foreign-born population - Other Central America (%)
Place of birth for the foreign-born population - Argentina (%)
Place of birth for the foreign-born population - Bolivia (%)
Place of birth for the foreign-born population - Brazil (%)
Place of birth for the foreign-born population - Chile (%)
Place of birth for the foreign-born population - Colombia (%)
Place of birth for the foreign-born population - Ecuador (%)
Place of birth for the foreign-born population - Guyana (%)
Place of birth for the foreign-born population - Peru (%)
Place of birth for the foreign-born population - Uruguay (%)
Place of birth for the foreign-born population - Venezuela (%)
Place of birth for the foreign-born population - Other South America (%)
Place of birth for the foreign-born population - Canada (%)
Place of birth for the foreign-born population - Other Northern America (%)
Place of birth for the foreign-born population - Other (%)
Latest news about races in Lakeside, CA collected exclusively by city-data.com from local newspapers, TV, and radio stations
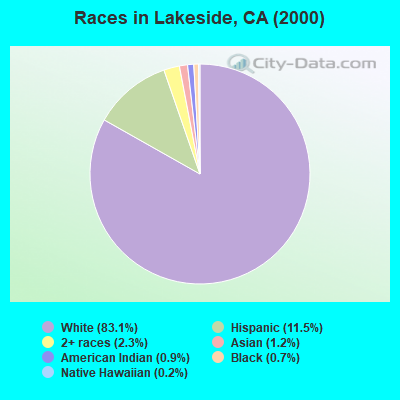
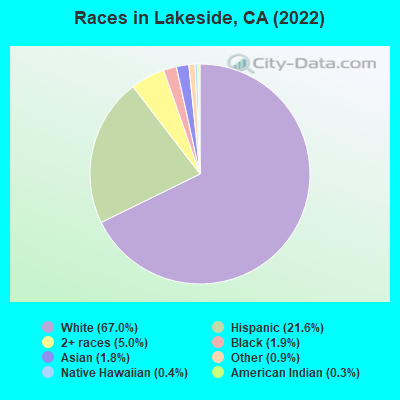
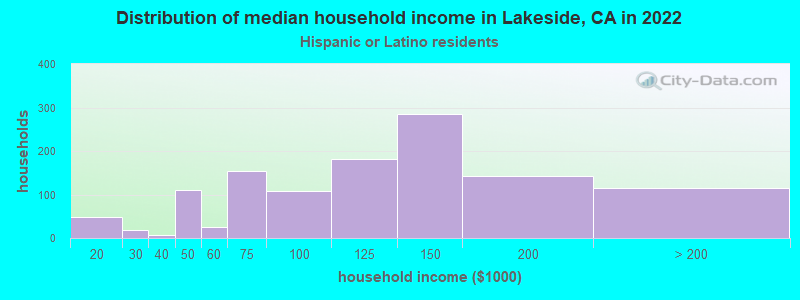
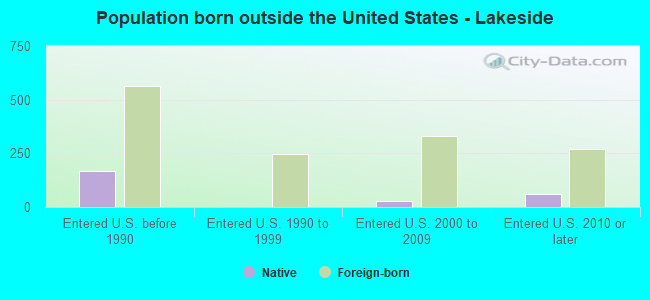
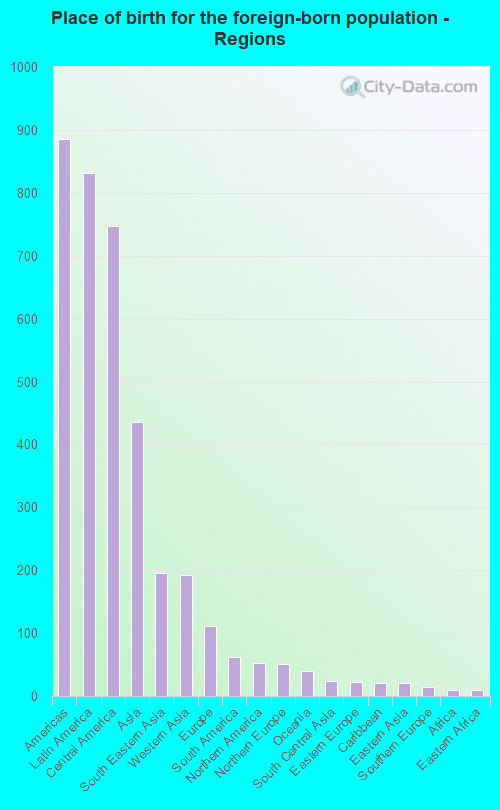
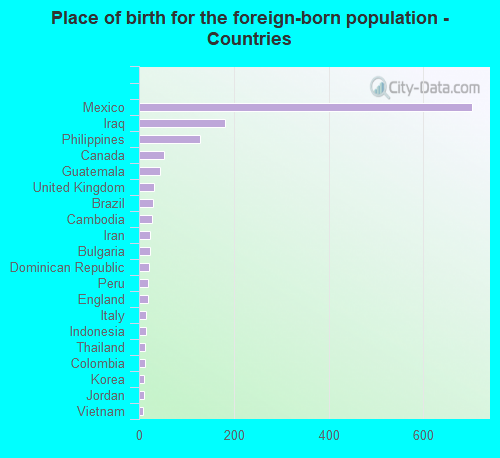
According to 2022 data, the most numerous races in Lakeside, CA are Hispanic (3,775 residents), White alone (15,315 residents), and Asian alone (660 residents). 87.7% of Lakeside residents speak English at home. 6.7% of Lakeside, CA residents are foreign-born (3.7% born in Latin America, 2.0% born in Asia), which is 288.3% less than the foreign-born rate of 26.0% across the entire state of California.
Race distribution in Lakeside
2000 2022
15,816,790 46.7% White alone 10,966,556 32.4% Hispanic 3,648,860 10.8% Asian alone 2,181,926 6.4% Black alone 903,115 2.7% Two or more races 178,984 0.5% American Indian alone 103,736 0.3% Native Hawaiian and Other 71,681 0.2% Other race alone
15,732,184 40.3% Hispanic 13,160,426 33.7% White alone 5,957,867 15.3% Asian alone 2,025,218 5.2% Black alone 1,663,222 4.3% Two or more races 251,618 0.6% Other race alone 135,777 0.3% Native Hawaiian and Other 103,030 0.3% American Indian alone
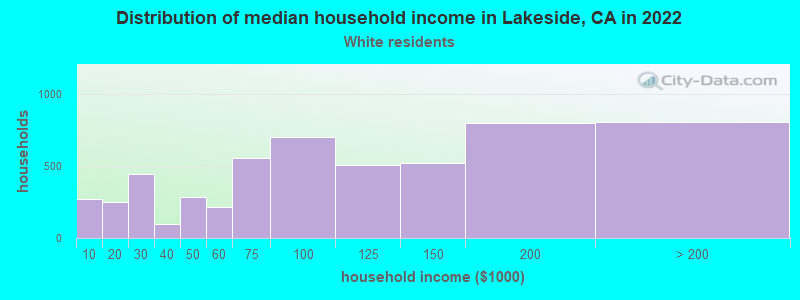
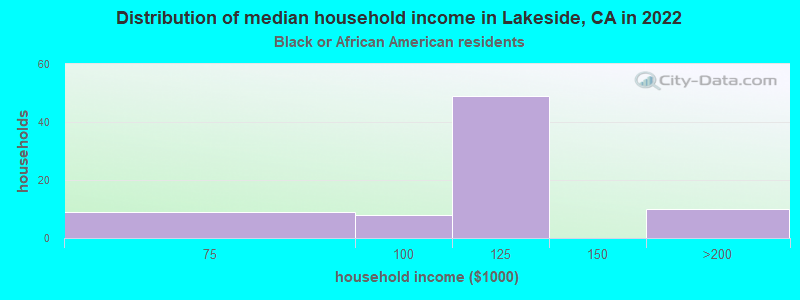
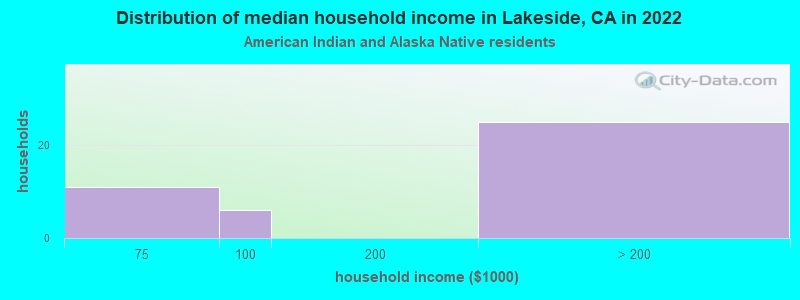
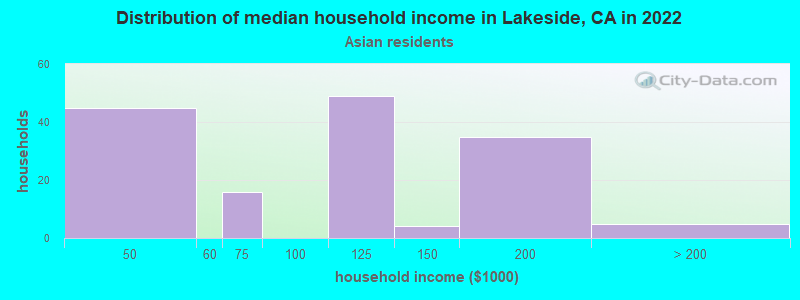
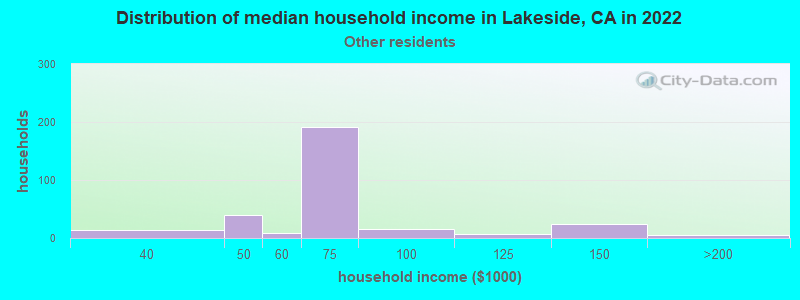
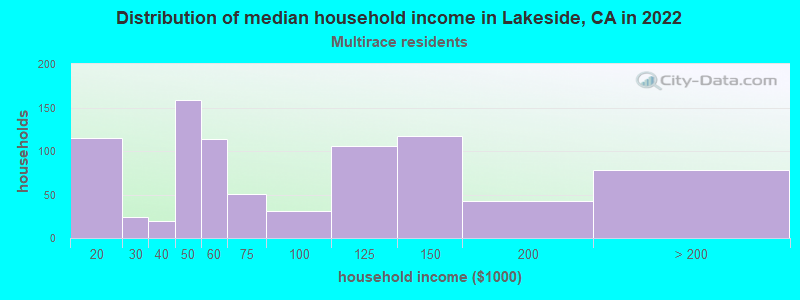
Income and house value in Lakeside Median household income in 2022 $96,822 White non-Hispanic householders$44,467 Black householdersover $200,000 American Indian and Alaska Native householders$114,104 Asian householders$113,509 Native Hawaiian and other Pacific Islander householders$84,766 Some other race householders$75,810 Two or more races householders$87,966 Hispanic or Latino race householdersMedian 2022 house value $729,217 White Non-Hispanic householders$494,903 Black or African American householders$809,841 American Indian or Alaska Native householders $770,249 Asian householders$691,784 Some other race householders$593,523 Two or more races householders$769,529 Hispanic or Latino householders
Median age by race in Lakeside
43.9 Median age for White residents41.6 46.0 40.2 Median age for Black or African American residents31.3 54.4 37.5 Median age for American Indian / Alaska Native residents39.3 50.6 33.6 Median age for Asian residents26.3 47.4 33.8 Median age for Native Hawaiian / Pacific Islander residents31.5 Median age for Other race residents33.8 27.1 40.9 Median age for Two or more races residents47.0 35.3 44.6 Median age for White alone residents41.4 47.7 29.5 Median age for Hispanic or Latino residents32.1 27.5
Owner/renter occupied households by race in Lakeside
House owners and renters - White residents 4,218 71.7% Owner occupied1,664 28.3% Renter occupiedHouse owners and renters - Black or African American residents 30 22.6% Owner occupied102 77.4% Renter occupiedHouse owners and renters - American Indian / Alaska Native residents 133 85.8% Owner occupied22 14.2% Renter occupiedHouse owners and renters - Asian residents 128 88.9% Owner occupied16 11.1% Renter occupiedHouse owners and renters - Native Hawaiian / Pacific Islander residents 40 100.0% Renter occupiedHouse owners and renters - Other race residents 66 77.0% Owner occupied20 23.0% Renter occupiedHouse owners and renters - Two or more races residents 498 60.5% Owner occupied325 39.5% Renter occupiedHouse owners and renters - White alone residents 4,210 74.6% Owner occupied1,430 25.4% Renter occupiedHouse owners and renters - Hispanic or Latino residents 446 44.2% Owner occupied562 55.8% Renter occupied
Language usage in Lakeside
English speakers - Total 87.7% of residents of Lakeside speak English at home.
9.6% of residents speak Spanish at home 1,344 67.5% Speak English very well646 32.5% Speak English less than very well3.1% of residents speak other language at home 458 70.5% Speak English very well192 29.5% Speak English less than very well
English speakers - Born in the United States 96.9% of residents of Lakeside speak English at home.
2.3% of residents speak Spanish at home 122 100.0% Speak English very well0.6% of residents speak other language at home 30 100.0% Speak English very well
English speakers - Native, born elsewhere 82.0% of residents of Lakeside speak English at home.
17.3% of residents speak other language at home 44 100.0% Speak English very well
English speakers - Foreign-born 20.2% of residents of Lakeside speak English at home.
51.8% of residents speak Spanish at home 292 38.9% Speak English very well458 61.1% Speak English less than very well28.6% of residents speak other language at home 249 60.1% Speak English very well165 39.9% Speak English less than very well
White (Caucasian) - Speak only English Native:
99.3% (14,631)Foreign-born:
29.0% (180)
White (Caucasian) - Speak another language Native:
4.9% (717)Foreign-born:
74.8% (465)
American Indian / Alaska Native - Speak another language Native:
9.4% (27)Foreign-born:
100.0% (32)
Asian - Speak only English Native:
87.7% (415)Foreign-born:
35.2% (82)
Asian - Speak another language Native:
16.9% (80)Foreign-born:
68.7% (159)
Native Hawaiian / Pacific Islander - Speak another language Native:
17.4% (24)Foreign-born:
96.4% (47)
Other race - Speak another language Native:
58.7% (186)Foreign-born:
96.6% (102)
Two or more races - Speak only English Native:
70.6% (1,312)Foreign-born:
6.7% (41)
Two or more races - Speak another language Native:
17.5% (325)Foreign-born:
91.0% (561)
White alone - Speak only English Native:
96.2% (13,666)Foreign-born:
32.2% (156)
White alone - Speak another language Native:
3.7% (525)Foreign-born:
67.7% (328)
Hispanic or Latino - Speak only English Native:
76.2% (2,082)Foreign-born:
7.0% (43)
Hispanic or Latino - Speak another language Native:
29.8% (814)Foreign-born:
92.9% (571)
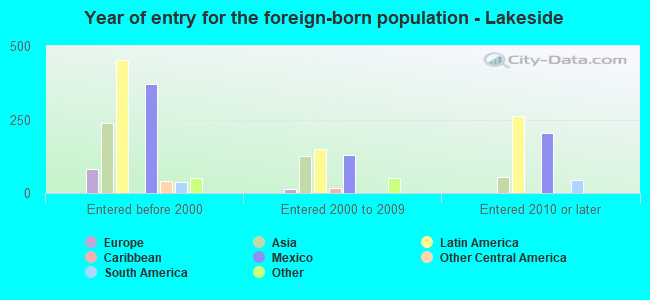
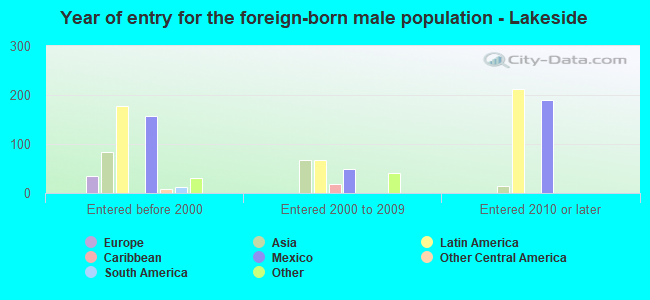
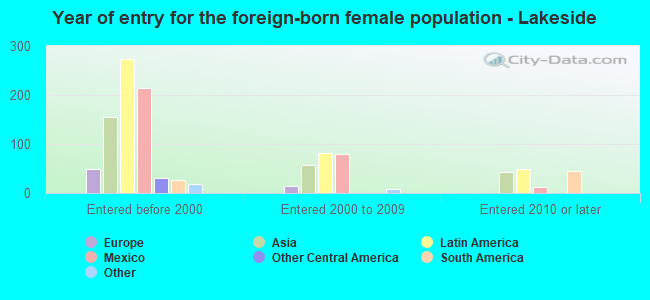
Foreign-born residents in Lakeside 1,480 residents are foreign born (3.7% Latin America , 2.0% Asia ).
This city:
6.7%California:
100.0%
Marital status for residents in Lakeside Marital status - White (Caucasian) population 15 years and over
Males 35.6% Never married49.2% Now married1.7% Separated3.5% Widowed10.1% DivorcedFemales 24.1% Never married50.4% Now married1.7% Separated10.6% Widowed13.3% DivorcedWomen who gave birth in the past 12 months Now married:
79.9% (141)Unmarried:
20.1% (35)
Women who did not give birth in the past 12 months Now married:
45.1% (1,304)Unmarried:
54.9% (1,584)
Marital status - Black or African American population 15 years and over
Males 56.8% Never married32.2% Now married6.4% Separated2.5% Widowed2.1% DivorcedFemales 56.8% Never married26.3% Now married0.0% Separated0.0% Widowed16.9% DivorcedWomen who gave birth in the past 12 months Now married:
0.0% (0)Unmarried:
100.0% (3)
Women who did not give birth in the past 12 months Now married:
38.5% (9)Unmarried:
61.5% (15)
Marital status - American Indian / Alaska Native population 15 years and over
Males 36.9% Never married63.1% Now married0.0% Separated0.0% Widowed0.0% DivorcedFemales 15.5% Never married53.6% Now married0.0% Separated16.5% Widowed14.4% DivorcedWomen who did not give birth in the past 12 months Now married:
77.6% (77)Unmarried:
22.4% (22)
Marital status - Asian population 15 years and over
Males 71.4% Never married20.3% Now married0.0% Separated8.3% Widowed0.0% DivorcedFemales 16.1% Never married60.7% Now married0.0% Separated6.7% Widowed16.4% DivorcedWomen who gave birth in the past 12 months Now married:
100.0% (5)Unmarried:
0.0% (0)
Women who did not give birth in the past 12 months Now married:
71.0% (119)Unmarried:
29.0% (49)
Marital status - Native Hawaiian / Pacific Islander population 15 years and over
Males 34.3% Never married38.5% Now married27.3% Separated0.0% Widowed0.0% DivorcedFemales 92.2% Never married0.0% Now married0.0% Separated0.0% Widowed7.8% DivorcedWomen who did not give birth in the past 12 months Now married:
0.0% (0)Unmarried:
100.0% (52)
Marital status - Other race population 15 years and over
Males 12.6% Never married73.5% Now married0.0% Separated0.0% Widowed13.9% DivorcedFemales 8.1% Never married65.8% Now married17.4% Separated3.1% Widowed5.6% DivorcedWomen who did not give birth in the past 12 months Now married:
80.2% (88)Unmarried:
19.8% (22)
Marital status - Two or more races population 15 years and over
Males 28.2% Never married67.5% Now married1.3% Separated0.0% Widowed3.0% DivorcedFemales 35.7% Never married55.2% Now married7.1% Separated0.0% Widowed2.0% DivorcedWomen who gave birth in the past 12 months Now married:
100.0% (128)Unmarried:
0.0% (0)
Women who did not give birth in the past 12 months Now married:
55.3% (373)Unmarried:
44.7% (302)
Marital status - White alone, not Hispanic / Latino population 15 years and over
Males 32.3% Never married52.3% Now married1.9% Separated3.7% Widowed9.8% DivorcedFemales 21.7% Never married52.5% Now married1.3% Separated10.6% Widowed13.9% DivorcedWomen who gave birth in the past 12 months Now married:
79.6% (132)Unmarried:
20.4% (34)
Women who did not give birth in the past 12 months Now married:
46.4% (1,289)Unmarried:
53.6% (1,489)
Marital status - Hispanic or Latino population 15 years and over
Males 50.1% Never married36.4% Now married0.4% Separated2.0% Widowed11.1% DivorcedFemales 37.0% Never married41.3% Now married5.7% Separated8.4% Widowed7.6% DivorcedWomen who gave birth in the past 12 months Now married:
89.3% (69)Unmarried:
10.7% (8)
Women who did not give birth in the past 12 months Now married:
45.5% (402)Unmarried:
54.5% (482)
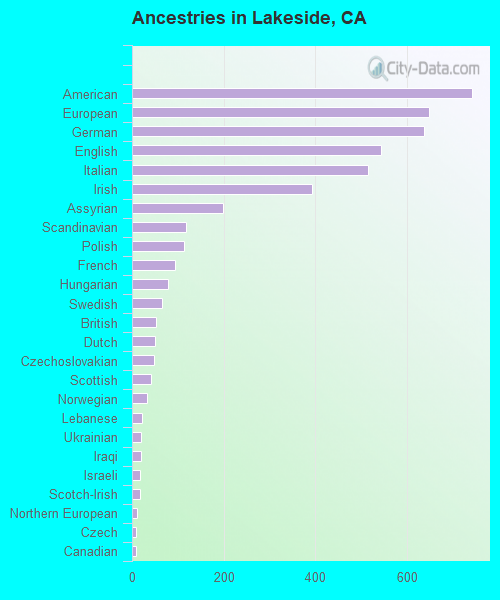
Ancestries in Lakeside
840 9.1% European838 9.1% German796 8.6% American431 4.7% Irish308 3.3% English277 3.0% Italian152 1.6% British150 1.6% Norwegian139 1.5% Scandinavian135 1.5% Assyrian100 1.1% French76 0.8% Scottish69 0.7% Swedish45 0.5% Palestinian44 0.5% Hungarian43 0.5% Scotch-Irish40 0.4% Polish37 0.4% Iraqi33 0.4% Croatian28 0.3% Dutch26 0.3% Danish26 0.3% French Canadian25 0.3% Welsh23 0.2% Iranian21 0.2% Bulgarian21 0.2% Ukrainian18 0.2% Pennsylvania German16 0.2% Portuguese13 0.1% Russian13 0.1% Armenian12 0.1% Basque9 0.10% Slovak7 0.08% Czechoslovakian5 0.05% Swiss4 0.04% Jordanian4 0.04% Czech1 0.01% African
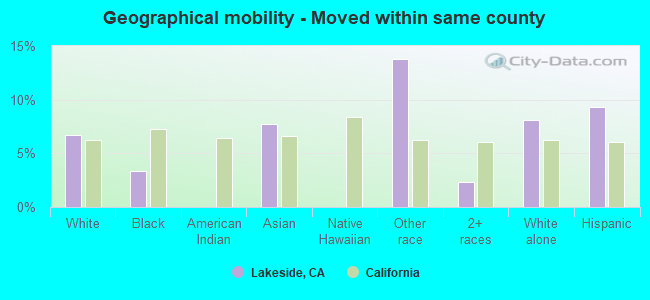
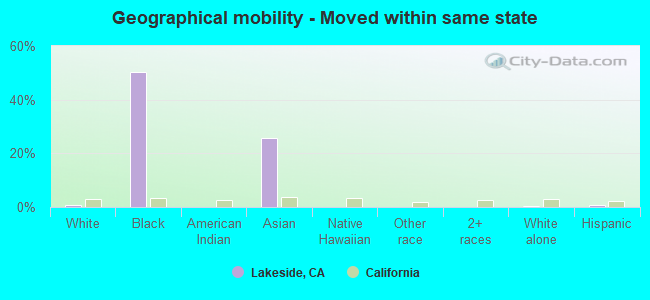
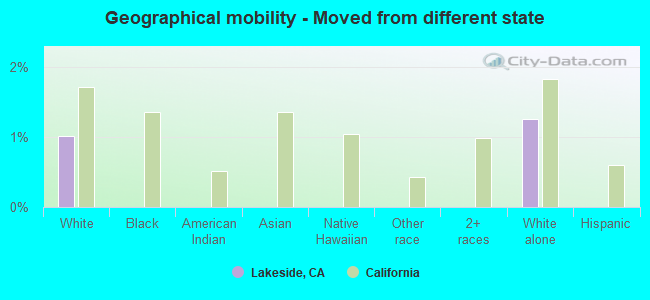
Geographical mobility in Lakeside Same house 1 year ago 14,138 92.1% White (Caucasian)196 55.6% Black or African American374 100.0% American Indian / Alaska Native433 62.4% Asian197 100.0% Native Hawaiian / Pacific Islander397 82.5% Other race2,439 100.0% Two or more races13,745 90.1% White alone, not Hispanic / Latino3,187 89.0% Hispanic or LatinoMoved within same county 1,027 6.7% White / Caucasian12 3.3% Black or African American54 7.8% Asian66 13.8% Other race55 2.3% Two or more races1,234 8.1% White alone, not Hispanic / Latino334 9.3% Hispanic or LatinoMoved within same state 99 0.6% White / Caucasian177 50.2% Black or African American179 25.9% Asian73 0.5% White alone, not Hispanic / Latino25 0.7% Hispanic or LatinoMoved from different state 155 1.0% White / Caucasian192 1.3% White alone, not Hispanic / LatinoMoved from abroad 16 0.1% White13 1.8% Asian15 0.1% White alone, not Hispanic / Latino16 0.5% Hispanic or Latino
Children Nativity (place of birth) in Lakeside
Children under 6 years - Living with two parents Both parents native 732 100.0% NativeBoth parents foreign-born 183 100.0% NativeOne native, one foreign-born parent 111 100.0% NativeChildren under 6 years - Living with one parent Native parent 190 100.0% NativeForeign-born parent 74 100.0% NativeChildren 6 to 17 years - Living with two parents Both parents native 1,868 100.0% NativeBoth parents foreign-born 321 100.0% NativeOne native, one foreign-born parent 142 100.0% NativeChildren 6 to 17 years - Living with one parent Native parent 731 100.0% NativeForeign-born parent 54 50.2% Native54 49.8% Foreign-born
Grandparents responsible for own grandchildren in Lakeside
Grandparents (30 to 59 years) White / Caucasian 51 47.8% Responsible for grandchildren55 52.2% Not responsible for grandchildrenOther race 22 100.0% Not responsible for grandchildrenWhite alone, not Hispanic / Latino 32 35.0% Responsible for grandchildren60 65.0% Not responsible for grandchildrenHispanic or Latino 36 100.0% Not responsible for grandchildrenGrandparents (60 years and over) White / Caucasian 41 23.0% Responsible for grandchildren138 77.0% Not responsible for grandchildrenOther race 8 100.0% Not responsible for grandchildrenWhite alone, not Hispanic / Latino 39 28.2% Responsible for grandchildren99 71.8% Not responsible for grandchildrenHispanic or Latino 11 9.9% Responsible for grandchildren100 90.1% Not responsible for grandchildren