Races in Lancaster, Pennsylvania (PA) Detailed Stats
Data:
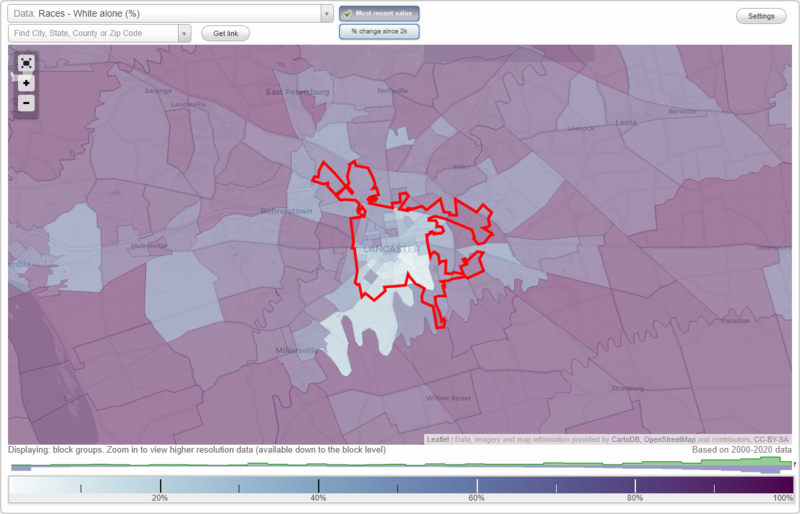
Races - White alone (%)
Races - White alone (% change since 2000)
Races - Black alone (%)
Races - Black alone (% change since 2000)
Races - American Indian alone (%)
Races - American Indian alone (% change since 2000)
Races - Asian alone (%)
Races - Asian alone (% change since 2000)
Races - Hispanic (%)
Races - Hispanic (% change since 2000)
Races - Native Hawaiian and Other Pacific Islander alone (%)
Races - Native Hawaiian and Other Pacific Islander alone (% change since 2000)
Races - Two or more races(%)
Races - Two or more races(% change since 2000)
Races - Other race alone (%)
Races - Other race alone (% change since 2000)
Racial diversity
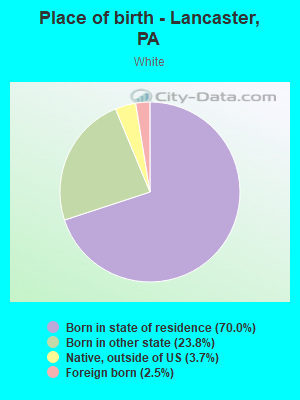
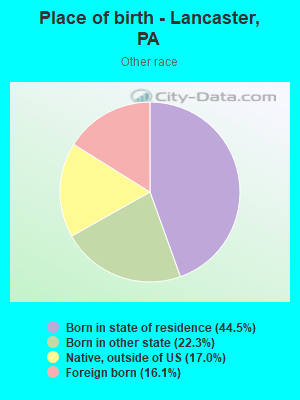
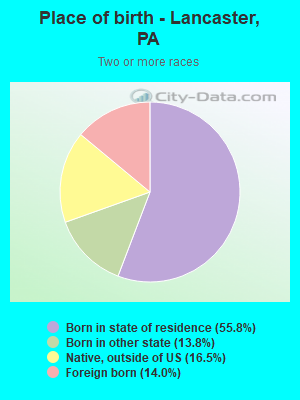
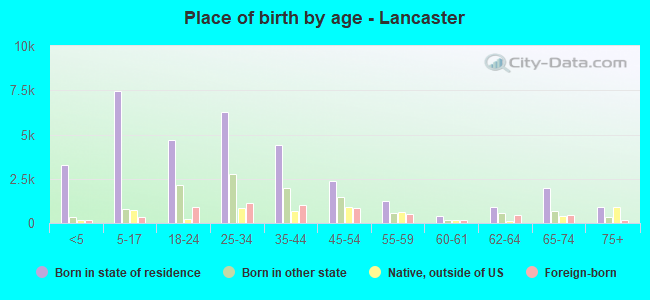
Place of birth - Born in state of residence (%)
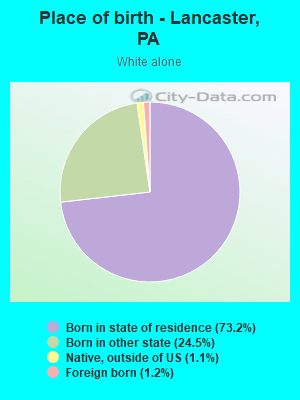
Place of birth - Born in state of residence (%) - White
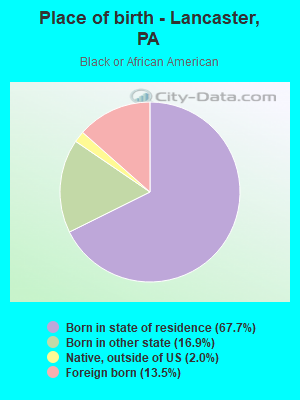
Place of birth - Born in state of residence (%) - Black or African American
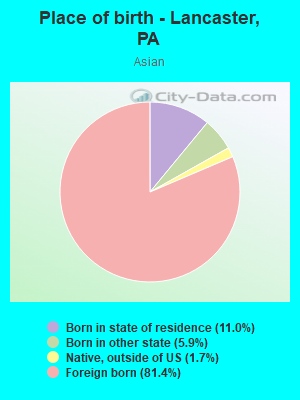
Place of birth - Born in state of residence (%) - Asian
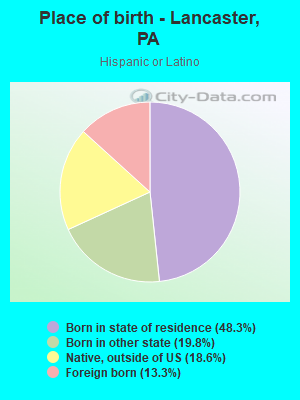
Place of birth - Born in state of residence (%) - Hispanic or Latino
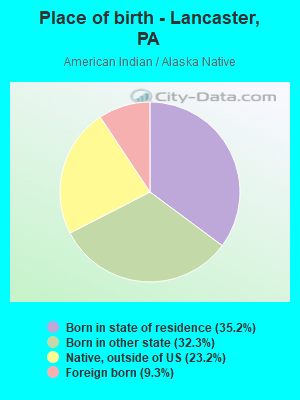
Place of birth - Born in state of residence (%) - American Indian and Alaska Native
Place of birth - Born in state of residence (%) - Multirace
Place of birth - Born in state of residence (%) - Other Race
Place of birth - Born in other state (%)
Place of birth - Born in other state (%) - White
Place of birth - Born in other state (%) - Black or African American
Place of birth - Born in other state (%) - Asian
Place of birth - Born in other state (%) - Hispanic or Latino
Place of birth - Born in other state (%) - American Indian and Alaska Native
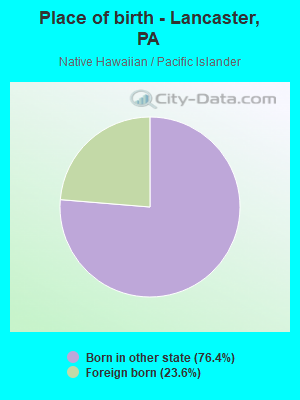
Place of birth - Born in other state (%) - Multirace
Place of birth - Born in other state (%) - Other Race
Place of birth - Native, outside of US (%)
Place of birth - Native, outside of US (%) - White
Place of birth - Native, outside of US (%) - Black or African American
Place of birth - Native, outside of US (%) - Asian
Place of birth - Native, outside of US (%) - Hispanic or Latino
Place of birth - Native, outside of US (%) - American Indian and Alaska Native
Place of birth - Native, outside of US (%) - Multirace
Place of birth - Native, outside of US (%) - Other Race
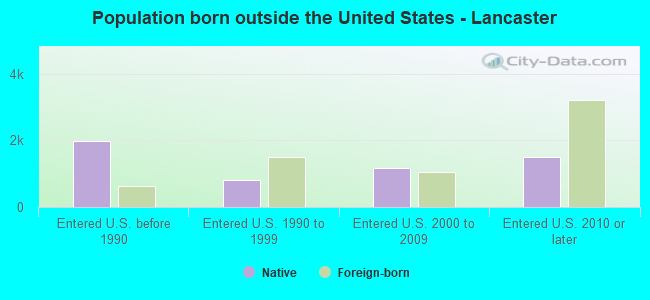
Place of birth - Foreign born (%)
Place of birth - Foreign born (%) - White
Place of birth - Foreign born (%) - Black or African American
Place of birth - Foreign born (%) - Asian
Place of birth - Foreign born (%) - Hispanic or Latino
Place of birth - Foreign born (%) - American Indian and Alaska Native
Place of birth - Foreign born (%) - Multirace
Place of birth - Foreign born (%) - Other Race
Residents speaking English at home (%)
Residents speaking English at home - Born in the United States (%)
Residents speaking English at home - Native, born elsewhere (%)
Residents speaking English at home - Foreign born (%)
Residents speaking Spanish at home (%)
Residents speaking Spanish at home - Born in the United States (%)
Residents speaking Spanish at home - Native, born elsewhere (%)
Residents speaking Spanish at home - Foreign born (%)
Residents speaking other language at home (%)
Residents speaking other language at home - Born in the United States (%)
Residents speaking other language at home - Native, born elsewhere (%)
Residents speaking other language at home - Foreign born (%)
Marital status - Never married (%)
Marital status - Now married (%)
Marital status - Separated (%)
Marital status - Widowed (%)
Marital status - Divorced (%)
Ancestries Reported - Arab (%)
Ancestries Reported - Czech (%)
Ancestries Reported - Danish (%)
Ancestries Reported - Dutch (%)
Ancestries Reported - English (%)
Ancestries Reported - French (%)
Ancestries Reported - French Canadian (%)
Ancestries Reported - German (%)
Ancestries Reported - Greek (%)
Ancestries Reported - Hungarian (%)
Ancestries Reported - Irish (%)
Ancestries Reported - Italian (%)
Ancestries Reported - Lithuanian (%)
Ancestries Reported - Norwegian (%)
Ancestries Reported - Polish (%)
Ancestries Reported - Portuguese (%)
Ancestries Reported - Russian (%)
Ancestries Reported - Scotch-Irish (%)
Ancestries Reported - Scottish (%)
Ancestries Reported - Slovak (%)
Ancestries Reported - Subsaharan African (%)
Ancestries Reported - Swedish (%)
Ancestries Reported - Swiss (%)
Ancestries Reported - Ukrainian (%)
Ancestries Reported - United States (%)
Ancestries Reported - Welsh (%)
Ancestries Reported - West Indian (%)
Ancestries Reported - Other (%)
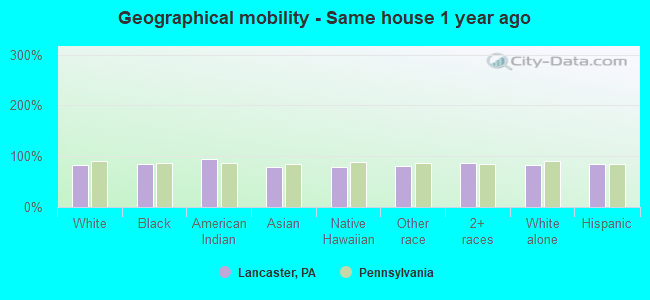
Geographical mobility - Same house 1 year ago (%)
Geographical mobility - Same house 1 year ago (%) - White
Geographical mobility - Same house 1 year ago (%) - Black or African American
Geographical mobility - Same house 1 year ago (%) - Asian
Geographical mobility - Same house 1 year ago (%) - Hispanic or Latino
Geographical mobility - Same house 1 year ago (%) - American Indian and Alaska Native
Geographical mobility - Same house 1 year ago (%) - Multirace
Geographical mobility - Same house 1 year ago (%) - Other Race
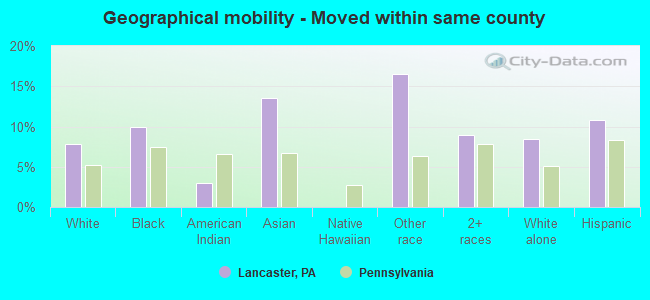
Geographical mobility - Moved within same county (%)
Geographical mobility - Moved within same county (%) - White
Geographical mobility - Moved within same county (%) - Black or African American
Geographical mobility - Moved within same county (%) - Asian
Geographical mobility - Moved within same county (%) - Hispanic or Latino
Geographical mobility - Moved within same county (%) - American Indian and Alaska Native
Geographical mobility - Moved within same county (%) - Multirace
Geographical mobility - Moved within same county (%) - Other Race
Geographical mobility - Moved from different county within same state (%)
Geographical mobility - Moved from different county within same state (%) - White
Geographical mobility - Moved from different county within same state (%) - Black or African American
Geographical mobility - Moved from different county within same state (%) - Asian
Geographical mobility - Moved from different county within same state (%) - Hispanic or Latino
Geographical mobility - Moved from different county within same state (%) - American Indian and Alaska Native
Geographical mobility - Moved from different county within same state (%) - Multirace
Geographical mobility - Moved from different county within same state (%) - Other Race
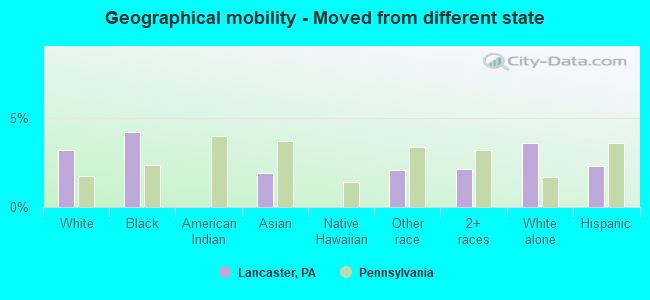
Geographical mobility - Moved from different state (%)
Geographical mobility - Moved from different state (%) - White
Geographical mobility - Moved from different state (%) - Black or African American
Geographical mobility - Moved from different state (%) - Asian
Geographical mobility - Moved from different state (%) - Hispanic or Latino
Geographical mobility - Moved from different state (%) - American Indian and Alaska Native
Geographical mobility - Moved from different state (%) - Multirace
Geographical mobility - Moved from different state (%) - Other Race
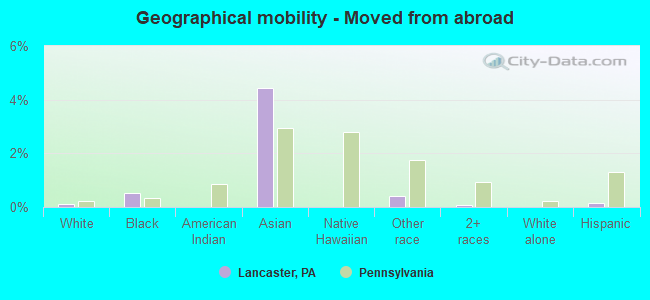
Geographical mobility - Moved from abroad (%)
Geographical mobility - Moved from abroad (%) - White
Geographical mobility - Moved from abroad (%) - Black or African American
Geographical mobility - Moved from abroad (%) - Asian
Geographical mobility - Moved from abroad (%) - Hispanic or Latino
Geographical mobility - Moved from abroad (%) - American Indian and Alaska Native
Geographical mobility - Moved from abroad (%) - Multirace
Geographical mobility - Moved from abroad (%) - Other Race
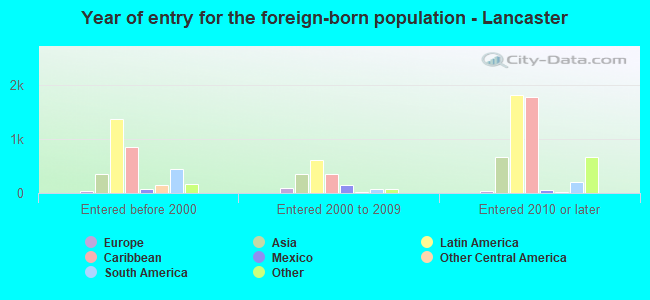
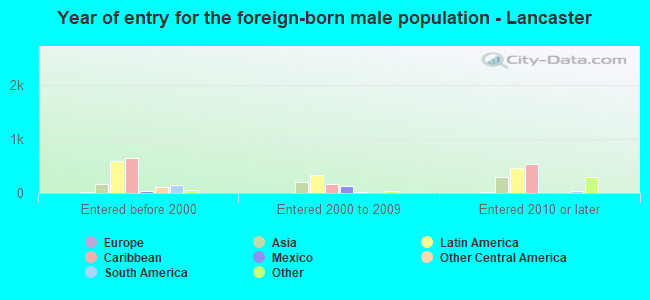
Place of birth for the foreign-born population - Ireland (%)
Place of birth for the foreign-born population - Denmark (%)
Place of birth for the foreign-born population - Norway (%)
Place of birth for the foreign-born population - Sweden (%)
Place of birth for the foreign-born population - United Kingdom (%)
Place of birth for the foreign-born population - England (%)
Place of birth for the foreign-born population - Scotland (%)
Place of birth for the foreign-born population - Other Northern Europe (%)
Place of birth for the foreign-born population - Austria (%)
Place of birth for the foreign-born population - Belgium (%)
Place of birth for the foreign-born population - France (%)
Place of birth for the foreign-born population - Germany (%)
Place of birth for the foreign-born population - Netherlands (%)
Place of birth for the foreign-born population - Switzerland (%)
Place of birth for the foreign-born population - Other Western Europe (%)
Place of birth for the foreign-born population - Greece (%)
Place of birth for the foreign-born population - Italy (%)
Place of birth for the foreign-born population - Portugal (%)
Place of birth for the foreign-born population - Spain (%)
Place of birth for the foreign-born population - Other Southern Europe (%)
Place of birth for the foreign-born population - Albania (%)
Place of birth for the foreign-born population - Belarus (%)
Place of birth for the foreign-born population - Bosnia and Herzegovina (%)
Place of birth for the foreign-born population - Bulgaria (%)
Place of birth for the foreign-born population - Croatia (%)
Place of birth for the foreign-born population - Czechoslovakia (%)
Place of birth for the foreign-born population - Hungary (%)
Place of birth for the foreign-born population - Latvia (%)
Place of birth for the foreign-born population - Lithuania (%)
Place of birth for the foreign-born population - North Macedonia (Macedonia) (%)
Place of birth for the foreign-born population - Moldova (%)
Place of birth for the foreign-born population - Poland (%)
Place of birth for the foreign-born population - Romania (%)
Place of birth for the foreign-born population - Russia (%)
Place of birth for the foreign-born population - Serbia (%)
Place of birth for the foreign-born population - Ukraine (%)
Place of birth for the foreign-born population - Other Eastern Europe (%)
Place of birth for the foreign-born population - China (%)
Place of birth for the foreign-born population - Hong Kong (%)
Place of birth for the foreign-born population - Taiwan (%)
Place of birth for the foreign-born population - Japan (%)
Place of birth for the foreign-born population - Korea (%)
Place of birth for the foreign-born population - Other Eastern Asia (%)
Place of birth for the foreign-born population - Afghanistan (%)
Place of birth for the foreign-born population - Bangladesh (%)
Place of birth for the foreign-born population - India (%)
Place of birth for the foreign-born population - Iran (%)
Place of birth for the foreign-born population - Kazakhstan (%)
Place of birth for the foreign-born population - Nepal (%)
Place of birth for the foreign-born population - Pakistan (%)
Place of birth for the foreign-born population - Sri Lanka (%)
Place of birth for the foreign-born population - Uzbekistan (%)
Place of birth for the foreign-born population - Other South Central Asia (%)
Place of birth for the foreign-born population - Burma (%)
Place of birth for the foreign-born population - Cambodia (%)
Place of birth for the foreign-born population - Indonesia (%)
Place of birth for the foreign-born population - Laos (%)
Place of birth for the foreign-born population - Malaysia (%)
Place of birth for the foreign-born population - Philippines (%)
Place of birth for the foreign-born population - Singapore (%)
Place of birth for the foreign-born population - Thailand (%)
Place of birth for the foreign-born population - Vietnam (%)
Place of birth for the foreign-born population - Other South Eastern Asia (%)
Place of birth for the foreign-born population - Armenia (%)
Place of birth for the foreign-born population - Iraq (%)
Place of birth for the foreign-born population - Israel (%)
Place of birth for the foreign-born population - Jordan (%)
Place of birth for the foreign-born population - Kuwait (%)
Place of birth for the foreign-born population - Lebanon (%)
Place of birth for the foreign-born population - Saudi Arabia (%)
Place of birth for the foreign-born population - Syria (%)
Place of birth for the foreign-born population - Turkey (%)
Place of birth for the foreign-born population - Yemen (%)
Place of birth for the foreign-born population - Other Western Asia (%)
Place of birth for the foreign-born population - Eritrea (%)
Place of birth for the foreign-born population - Ethiopia (%)
Place of birth for the foreign-born population - Kenya (%)
Place of birth for the foreign-born population - Somalia (%)
Place of birth for the foreign-born population - Uganda (%)
Place of birth for the foreign-born population - Zimbabwe (%)
Place of birth for the foreign-born population - Other Eastern Africa (%)
Place of birth for the foreign-born population - Cameroon (%)
Place of birth for the foreign-born population - Congo (%)
Place of birth for the foreign-born population - Democratic Republic of Congo (Zaire) (%)
Place of birth for the foreign-born population - Other Middle Africa (%)
Place of birth for the foreign-born population - Egypt (%)
Place of birth for the foreign-born population - Morocco (%)
Place of birth for the foreign-born population - Sudan (%)
Place of birth for the foreign-born population - Other Northern Africa (%)
Place of birth for the foreign-born population - South Africa (%)
Place of birth for the foreign-born population - Other Southern Africa (%)
Place of birth for the foreign-born population - Cabo Verde (%)
Place of birth for the foreign-born population - Ghana (%)
Place of birth for the foreign-born population - Liberia (%)
Place of birth for the foreign-born population - Nigeria (%)
Place of birth for the foreign-born population - Senegal (%)
Place of birth for the foreign-born population - Sierra Leone (%)
Place of birth for the foreign-born population - Other Western Africa (%)
Place of birth for the foreign-born population - Australia (%)
Place of birth for the foreign-born population - New Zealand (%)
Place of birth for the foreign-born population - Fiji (%)
Place of birth for the foreign-born population - Micronesia (%)
Place of birth for the foreign-born population - Bahamas (%)
Place of birth for the foreign-born population - Barbados (%)
Place of birth for the foreign-born population - Cuba (%)
Place of birth for the foreign-born population - Dominica (%)
Place of birth for the foreign-born population - Dominican Republic (%)
Place of birth for the foreign-born population - Grenada (%)
Place of birth for the foreign-born population - Haiti (%)
Place of birth for the foreign-born population - Jamaica (%)
Place of birth for the foreign-born population - St. Vincent and the Grenadines (%)
Place of birth for the foreign-born population - Trinidad and Tobago (%)
Place of birth for the foreign-born population - West Indies (%)
Place of birth for the foreign-born population - Other Caribbean (%)
Place of birth for the foreign-born population - Belize (%)
Place of birth for the foreign-born population - Costa Rica (%)
Place of birth for the foreign-born population - El Salvador (%)
Place of birth for the foreign-born population - Guatemala (%)
Place of birth for the foreign-born population - Honduras (%)
Place of birth for the foreign-born population - Mexico (%)
Place of birth for the foreign-born population - Nicaragua (%)
Place of birth for the foreign-born population - Panama (%)
Place of birth for the foreign-born population - Other Central America (%)
Place of birth for the foreign-born population - Argentina (%)
Place of birth for the foreign-born population - Bolivia (%)
Place of birth for the foreign-born population - Brazil (%)
Place of birth for the foreign-born population - Chile (%)
Place of birth for the foreign-born population - Colombia (%)
Place of birth for the foreign-born population - Ecuador (%)
Place of birth for the foreign-born population - Guyana (%)
Place of birth for the foreign-born population - Peru (%)
Place of birth for the foreign-born population - Uruguay (%)
Place of birth for the foreign-born population - Venezuela (%)
Place of birth for the foreign-born population - Other South America (%)
Place of birth for the foreign-born population - Canada (%)
Place of birth for the foreign-born population - Other Northern America (%)
Place of birth for the foreign-born population - Other (%)
Latest news about races in Lancaster, PA collected exclusively by city-data.com from local newspapers, TV, and radio stations
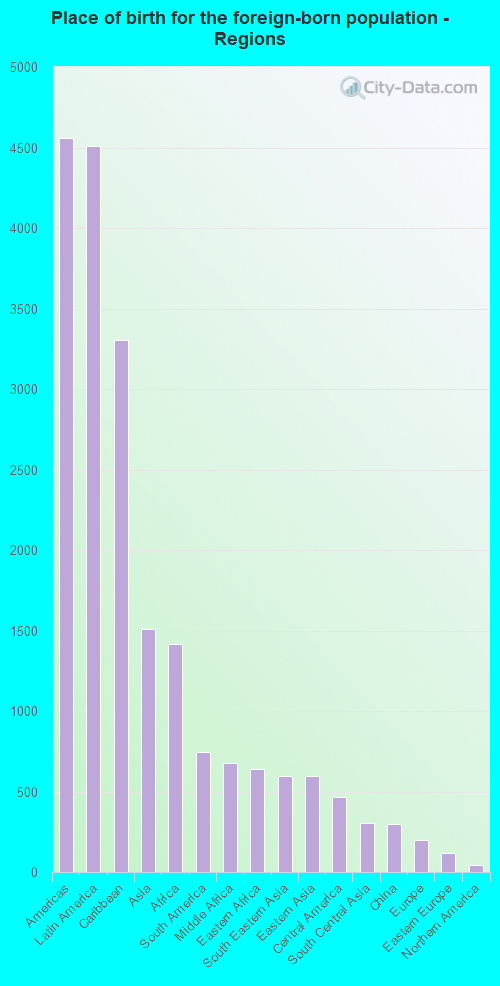
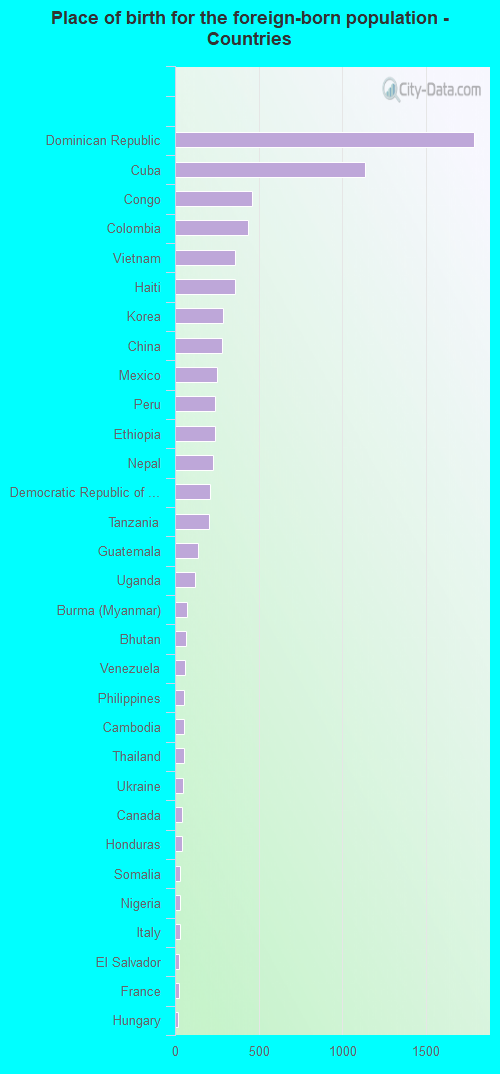
According to 2022 data, the most numerous races in Lancaster, PA are White alone (22,335 residents), Black alone (8,238 residents), and Hispanic (23,704 residents). 68.2% of Lancaster residents speak English at home. 13.2% of Lancaster, PA residents are foreign-born (7.5% born in Latin America, 2.5% born in Asia, 2.4% born in Africa), which is 47.0% greater than the foreign-born rate of 7.0% across the entire state of Pennsylvania.
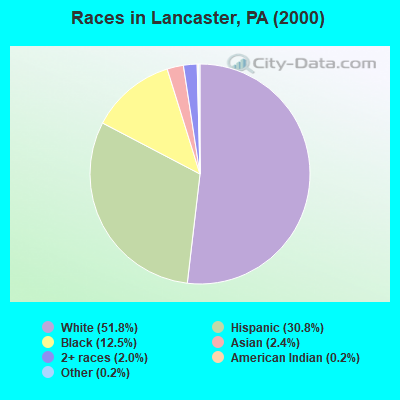
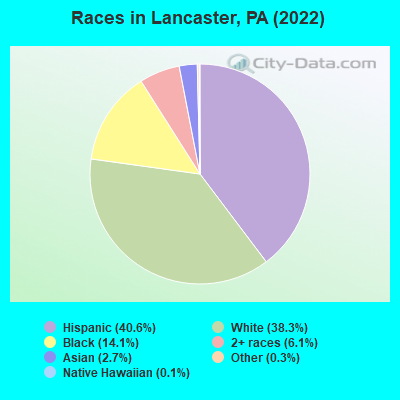
Race distribution in Lancaster
2000 2022
29,196 51.8% White alone 17,331 30.8% Hispanic 7,067 12.5% Black alone 1,367 2.4% Asian alone 1,150 2.0% Two or more races 88 0.2% Other race alone 129 0.2% American Indian alone 20 0.04% Native Hawaiian and Other
23,704 40.6% Hispanic 22,335 38.3% White alone 8,238 14.1% Black alone 3,585 6.1% Two or more races 1,586 2.7% Asian alone 176 0.3% Other race alone 59 0.1% Native Hawaiian and Other 5 0.01% American Indian alone
2000 2022
10,322,455 84.1% White alone 1,202,437 9.8% Black alone 394,088 3.2% Hispanic 218,296 1.8% Asian alone 113,097 0.9% Two or more races 13,086 0.1% Other race alone 14,904 0.1% American Indian alone 2,691 0.02% Native Hawaiian and Other
9,487,228 73.1% White alone 1,311,581 10.1% Black alone 1,115,997 8.6% Hispanic 493,942 3.8% Two or more races 487,124 3.8% Asian alone 63,582 0.5% Other race alone 10,130 0.08% American Indian alone 2,424 0.02% Native Hawaiian and Other
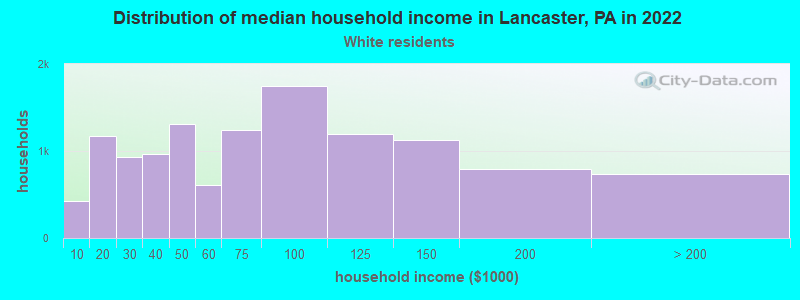
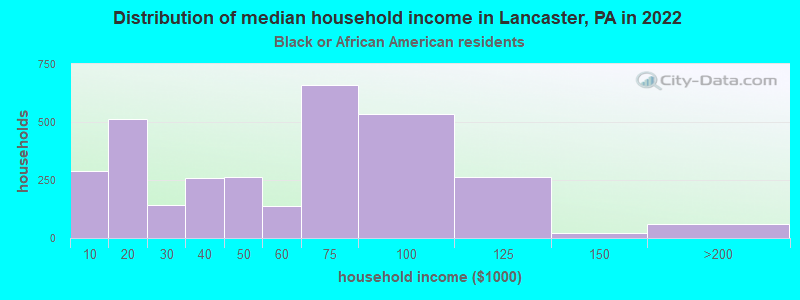
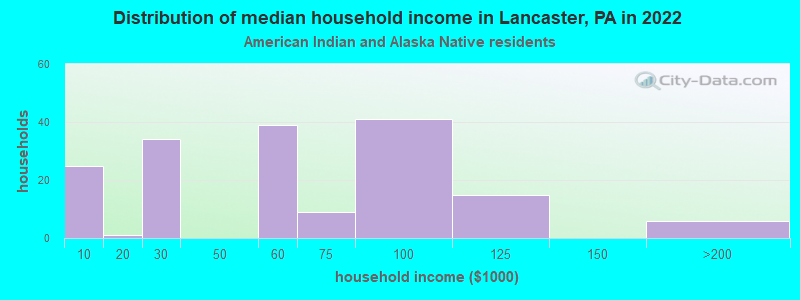
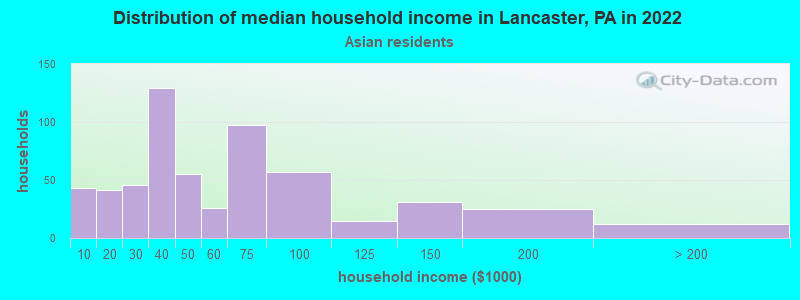
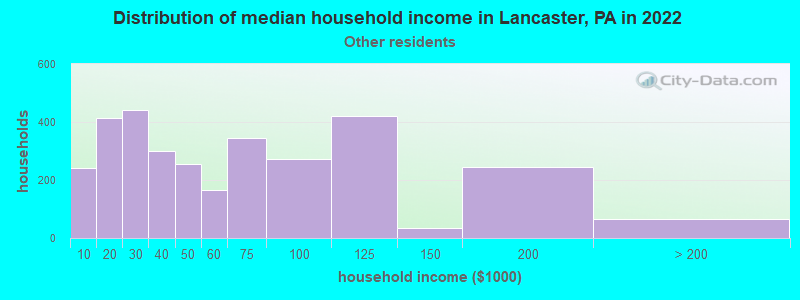
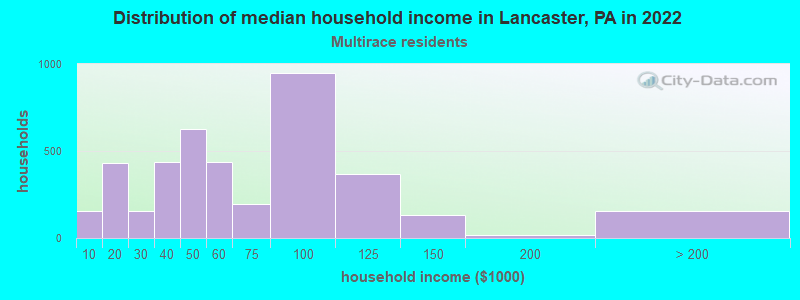
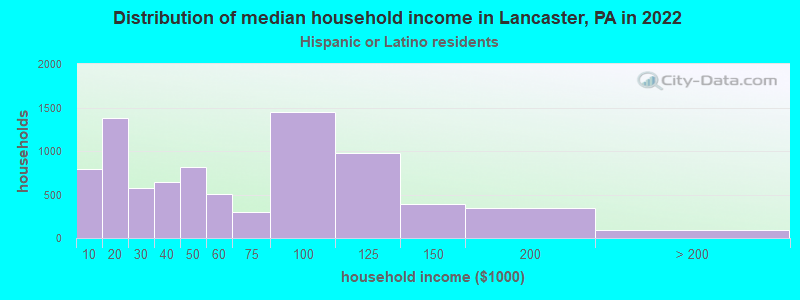
Income and house value in Lancaster Median household income in 2022 $72,622 White non-Hispanic householders$48,098 Black householders$46,679 American Indian and Alaska Native householders$51,467 Asian householders$57,566 Some other race householders$50,047 Two or more races householders$50,807 Hispanic or Latino race householdersMedian 2022 house value $198,562 White Non-Hispanic householders$181,970 Black or African American householders$354,148 American Indian or Alaska Native householders $210,802 Asian householders$149,601 Native Hawaiian and other Pacific Islander householders$174,626 Some other race householders$203,186 Two or more races householders$174,082 Hispanic or Latino householders
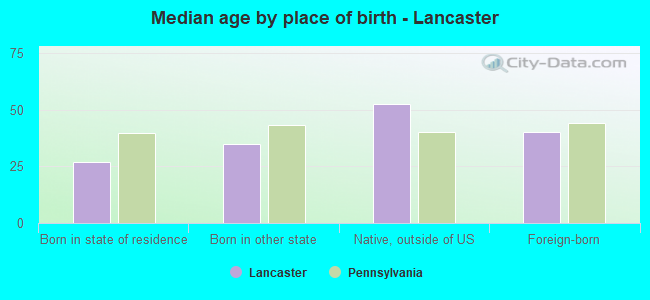
Median age by race in Lancaster
34.3 Median age for White residents34.2 34.9 28.4 Median age for Black or African American residents28.4 27.6 37.4 Median age for American Indian / Alaska Native residents53.7 24.9 30.7 Median age for Asian residents26.1 37.7 29.9 Median age for Native Hawaiian / Pacific Islander residents-760,416,665.9 36.2 33.2 Median age for Other race residents30.5 36.7 26.0 Median age for Two or more races residents27.7 24.7 34.8 Median age for White alone residents34.9 35.3 30.0 Median age for Hispanic or Latino residents27.5 32.9
Owner/renter occupied households by race in Lancaster
House owners and renters - White residents 6,743 54.7% Owner occupied5,591 45.3% Renter occupiedHouse owners and renters - Black or African American residents 1,423 47.6% Owner occupied1,566 52.4% Renter occupiedHouse owners and renters - American Indian / Alaska Native residents 26 13.1% Owner occupied171 86.9% Renter occupiedHouse owners and renters - Asian residents 257 46.5% Owner occupied295 53.5% Renter occupiedHouse owners and renters - Native Hawaiian / Pacific Islander residents 25 100.0% Renter occupiedHouse owners and renters - Other race residents 1,054 40.7% Owner occupied1,537 59.3% Renter occupiedHouse owners and renters - Two or more races residents 1,328 31.0% Owner occupied2,950 69.0% Renter occupiedHouse owners and renters - White alone residents 5,916 58.3% Owner occupied4,225 41.7% Renter occupiedHouse owners and renters - Hispanic or Latino residents 2,828 35.7% Owner occupied5,092 64.3% Renter occupied
Language usage in Lancaster
English speakers - Total 68.2% of residents of Lancaster speak English at home.
24.1% of residents speak Spanish at home 7,760 59.2% Speak English very well5,355 40.8% Speak English less than very well5.7% of residents speak other language at home 1,091 34.9% Speak English very well2,034 65.1% Speak English less than very well
English speakers - Born in the United States 79.4% of residents of Lancaster speak English at home.
23.9% of residents speak Spanish at home 2,439 89.7% Speak English very well280 10.3% Speak English less than very well0.8% of residents speak other language at home 82 93.2% Speak English very well6 6.8% Speak English less than very well
English speakers - Native, born elsewhere 13.1% of residents of Lancaster speak English at home.
87.7% of residents speak Spanish at home 1,507 39.9% Speak English very well2,271 60.1% Speak English less than very well0.1% of residents speak other language at home 6 100.0% Speak English very well
English speakers - Foreign-born 13.4% of residents of Lancaster speak English at home.
41.4% of residents speak Spanish at home 731 28.5% Speak English very well1,835 71.5% Speak English less than very well38.5% of residents speak other language at home 720 30.2% Speak English very well1,665 69.8% Speak English less than very well
White (Caucasian) - Speak only English Native:
86.1% (22,569)Foreign-born:
20.5% (143)
White (Caucasian) - Speak another language Native:
14.0% (3,672)Foreign-born:
69.9% (487)
Black or African American - Speak only English Native:
97.8% (8,733)Foreign-born:
15.3% (227)
Black or African American - Speak another language Native:
3.1% (276)Foreign-born:
80.9% (1,203)
American Indian / Alaska Native - Speak another language Native:
35.9% (101)Foreign-born:
100.0% (32)
Asian - Speak only English Native:
58.2% (126)Foreign-born:
16.9% (213)
Asian - Speak another language Native:
35.4% (76)Foreign-born:
83.2% (1,046)
Native Hawaiian / Pacific Islander - Speak only English Native:
100.0% (34)Foreign-born:
100.0% (10)
Other race - Speak only English Native:
25.3% (1,607)Foreign-born:
2.2% (29)
Other race - Speak another language Native:
74.4% (4,725)Foreign-born:
85.2% (1,116)
Two or more races - Speak only English Native:
61.1% (5,837)Foreign-born:
15.9% (270)
Two or more races - Speak another language Native:
35.1% (3,357)Foreign-born:
81.7% (1,392)
White alone - Speak only English Native:
96.0% (20,232)Foreign-born:
46.8% (121)
White alone - Speak another language Native:
3.4% (710)Foreign-born:
52.3% (135)
Hispanic or Latino - Speak only English Native:
45.4% (8,415)Foreign-born:
7.9% (243)
Hispanic or Latino - Speak another language Native:
52.8% (9,780)Foreign-born:
91.9% (2,825)
Foreign-born residents in Lancaster 7,705 residents are foreign born (7.5% Latin America , 2.5% Asia , 2.4% Africa ).
This city:
13.2%Pennsylvania:
7.3%
Marital status for residents in Lancaster Marital status - White (Caucasian) population 15 years and over
Males 49.4% Never married38.5% Now married1.2% Separated0.9% Widowed10.0% DivorcedFemales 46.1% Never married33.4% Now married3.1% Separated5.0% Widowed12.4% DivorcedWomen who gave birth in the past 12 months Now married:
76.8% (345)Unmarried:
23.2% (105)
Women who did not give birth in the past 12 months Now married:
29.4% (2,525)Unmarried:
70.6% (6,069)
Marital status - Black or African American population 15 years and over
Males 55.5% Never married35.3% Now married2.3% Separated0.3% Widowed6.6% DivorcedFemales 58.5% Never married28.3% Now married1.8% Separated4.9% Widowed6.4% DivorcedWomen who gave birth in the past 12 months Now married:
54.8% (176)Unmarried:
45.2% (145)
Women who did not give birth in the past 12 months Now married:
20.9% (524)Unmarried:
79.1% (1,988)
Marital status - American Indian / Alaska Native population 15 years and over
Males 42.0% Never married40.6% Now married0.0% Separated0.0% Widowed17.4% DivorcedFemales 62.1% Never married5.6% Now married9.7% Separated0.0% Widowed22.6% DivorcedWomen who gave birth in the past 12 months Now married:
0.0% (0)Unmarried:
100.0% (53)
Women who did not give birth in the past 12 months Now married:
0.0% (0)Unmarried:
100.0% (107)
Marital status - Asian population 15 years and over
Males 60.9% Never married28.6% Now married2.2% Separated0.0% Widowed8.3% DivorcedFemales 60.4% Never married28.4% Now married4.6% Separated1.9% Widowed4.7% DivorcedWomen who gave birth in the past 12 months Now married:
46.9% (24)Unmarried:
53.1% (28)
Women who did not give birth in the past 12 months Now married:
30.2% (180)Unmarried:
69.8% (416)
Marital status - Native Hawaiian / Pacific Islander population 15 years and over
Males 0.0% Never married100.0% Now married0.0% Separated0.0% Widowed0.0% DivorcedFemales 97.8% Never married2.2% Now married0.0% Separated0.0% Widowed0.0% DivorcedWomen who did not give birth in the past 12 months Now married:
0.0% (0)Unmarried:
100.0% (46)
Marital status - Other race population 15 years and over
Males 43.4% Never married43.2% Now married4.0% Separated0.7% Widowed8.8% DivorcedFemales 47.7% Never married38.8% Now married3.3% Separated2.3% Widowed7.9% DivorcedWomen who gave birth in the past 12 months Now married:
64.8% (92)Unmarried:
35.2% (50)
Women who did not give birth in the past 12 months Now married:
30.8% (628)Unmarried:
69.2% (1,411)
Marital status - Two or more races population 15 years and over
Males 60.0% Never married24.3% Now married3.1% Separated1.2% Widowed11.3% DivorcedFemales 55.1% Never married27.5% Now married1.8% Separated1.8% Widowed13.7% DivorcedWomen who gave birth in the past 12 months Now married:
32.3% (45)Unmarried:
67.7% (94)
Women who did not give birth in the past 12 months Now married:
25.4% (804)Unmarried:
74.6% (2,356)
Marital status - White alone, not Hispanic / Latino population 15 years and over
Males 52.2% Never married35.2% Now married1.3% Separated1.0% Widowed10.3% DivorcedFemales 46.2% Never married33.6% Now married1.6% Separated5.4% Widowed13.2% DivorcedWomen who gave birth in the past 12 months Now married:
78.8% (232)Unmarried:
21.2% (62)
Women who did not give birth in the past 12 months Now married:
29.0% (2,001)Unmarried:
71.0% (4,904)
Marital status - Hispanic or Latino population 15 years and over
Males 45.6% Never married41.8% Now married2.8% Separated0.5% Widowed9.3% DivorcedFemales 49.3% Never married33.2% Now married4.9% Separated2.4% Widowed10.2% DivorcedWomen who gave birth in the past 12 months Now married:
59.4% (232)Unmarried:
40.6% (158)
Women who did not give birth in the past 12 months Now married:
29.3% (1,668)Unmarried:
70.7% (4,033)
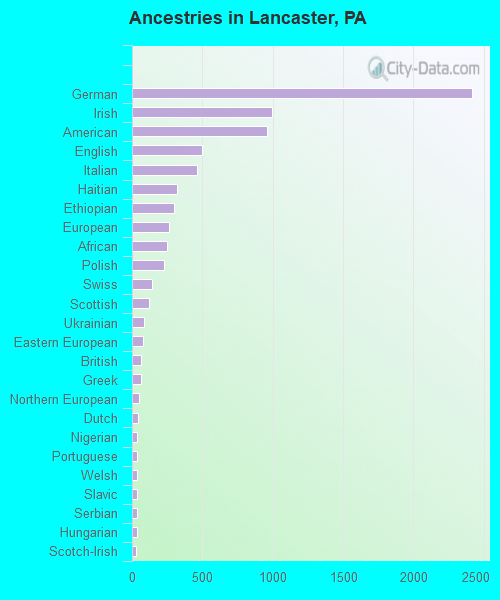
Ancestries in Lancaster
2,416 9.1% German998 3.8% Irish958 3.6% American498 1.9% English459 1.7% Italian322 1.2% Haitian299 1.1% Ethiopian262 1.0% European247 0.9% African227 0.9% Polish141 0.5% Swiss121 0.5% Scottish87 0.3% Ukrainian79 0.3% Eastern European64 0.2% British64 0.2% Greek48 0.2% Northern European44 0.2% Dutch39 0.1% Nigerian39 0.1% Portuguese39 0.1% Welsh38 0.1% Slavic36 0.1% Serbian34 0.1% Hungarian31 0.1% Scotch-Irish22 0.08% Swedish20 0.08% Jamaican19 0.07% Norwegian19 0.07% French Canadian19 0.07% French18 0.07% Pennsylvania German15 0.06% Slovak14 0.05% Russian14 0.05% Turkish11 0.04% Canadian9 0.03% Palestinian8 0.03% Finnish8 0.03% Romanian7 0.03% Croatian4 0.02% Yugoslavian3 0.01% Israeli2 0.01% Scandinavian2 0.01% Dutch West Indian
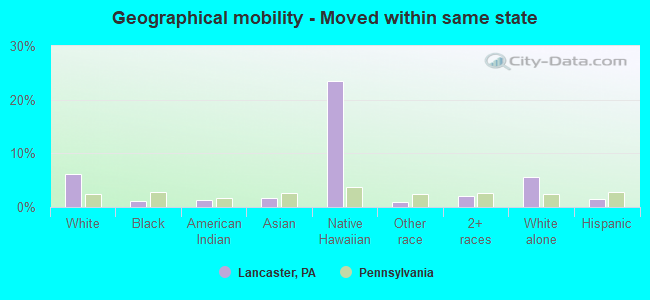
Geographical mobility in Lancaster Same house 1 year ago 23,604 82.8% White (Caucasian)9,325 85.4% Black or African American335 94.4% American Indian / Alaska Native1,221 79.6% Asian48 78.4% Native Hawaiian / Pacific Islander6,841 81.4% Other race10,355 85.9% Two or more races18,204 82.4% White alone, not Hispanic / Latino19,728 84.7% Hispanic or LatinoMoved within same county 2,240 7.9% White / Caucasian1,080 9.9% Black or African American11 3.0% American Indian / Alaska Native207 13.5% Asian1,388 16.5% Other race1,084 9.0% Two or more races1,855 8.4% White alone, not Hispanic / Latino2,528 10.9% Hispanic or LatinoMoved within same state 1,755 6.2% White / Caucasian129 1.2% Black or African American5 1.4% American Indian / Alaska Native25 1.6% Asian14 23.5% Native Hawaiian / Pacific Islander84 1.0% Other race246 2.0% Two or more races1,222 5.5% White alone, not Hispanic / Latino352 1.5% Hispanic or LatinoMoved from different state 907 3.2% White / Caucasian458 4.2% Black or African American29 1.9% Asian174 2.1% Other race255 2.1% Two or more races788 3.6% White alone, not Hispanic / Latino539 2.3% Hispanic or LatinoMoved from abroad 34 0.1% White56 0.5% Black or African American68 4.5% Asian34 0.4% Other race7 0.1% Two or more races35 0.1% Hispanic or Latino
Children Nativity (place of birth) in Lancaster
Children under 6 years - Living with two parents Both parents native 1,571 100.0% NativeBoth parents foreign-born 265 89.2% Native32 10.8% Foreign-bornOne native, one foreign-born parent 115 100.0% NativeChildren under 6 years - Living with one parent Native parent 2,123 100.0% NativeForeign-born parent 206 88.8% Native26 11.2% Foreign-bornChildren 6 to 17 years - Living with two parents Both parents native 3,146 96.8% Native103 3.2% Foreign-bornBoth parents foreign-born 266 52.0% Native246 48.0% Foreign-bornOne native, one foreign-born parent 138 100.0% NativeChildren 6 to 17 years - Living with one parent Native parent 3,780 100.0% NativeForeign-born parent 601 54.3% Native504 45.7% Foreign-born
Grandparents responsible for own grandchildren in Lancaster
Grandparents (30 to 59 years) White / Caucasian 43 28.2% Responsible for grandchildren108 71.8% Not responsible for grandchildrenBlack or African American 203 72.4% Responsible for grandchildren77 27.6% Not responsible for grandchildrenAsian 29 100.0% Not responsible for grandchildrenOther race 29 12.6% Responsible for grandchildren198 87.4% Not responsible for grandchildrenTwo or more races 61 100.0% Not responsible for grandchildrenWhite alone, not Hispanic / Latino 14 22.9% Responsible for grandchildren45 77.1% Not responsible for grandchildrenHispanic or Latino 55 13.5% Responsible for grandchildren352 86.5% Not responsible for grandchildrenGrandparents (60 years and over) White / Caucasian 52 42.2% Responsible for grandchildren71 57.8% Not responsible for grandchildrenBlack or African American 21 48.3% Responsible for grandchildren22 51.7% Not responsible for grandchildrenAsian 5 100.0% Not responsible for grandchildrenOther race 24 100.0% Not responsible for grandchildrenTwo or more races 46 33.0% Responsible for grandchildren93 67.0% Not responsible for grandchildrenWhite alone, not Hispanic / Latino 32 38.1% Responsible for grandchildren51 61.9% Not responsible for grandchildrenHispanic or Latino 52 35.5% Responsible for grandchildren95 64.5% Not responsible for grandchildren