Races in Leavenworth, Kansas (KS) Detailed Stats
Data:
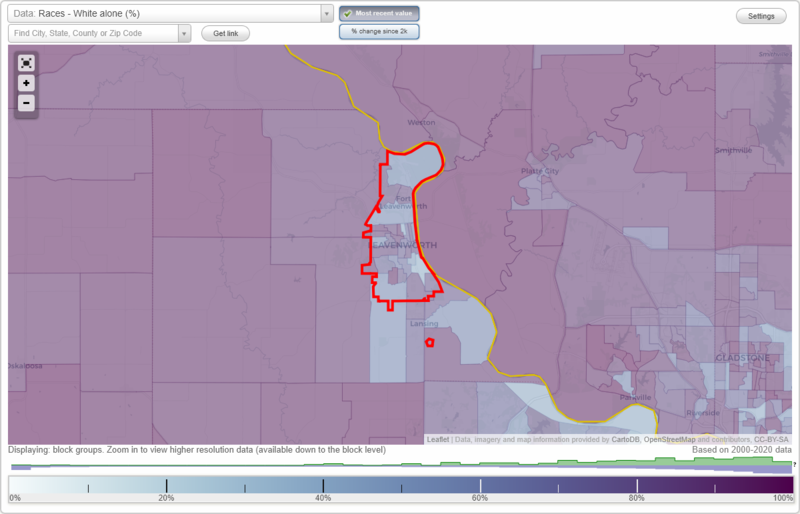
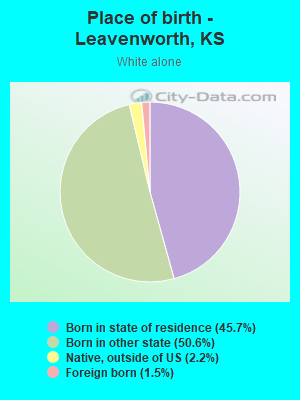
Races - White alone (%)
Races - White alone (% change since 2000)
Races - Black alone (%)
Races - Black alone (% change since 2000)
Races - American Indian alone (%)
Races - American Indian alone (% change since 2000)
Races - Asian alone (%)
Races - Asian alone (% change since 2000)
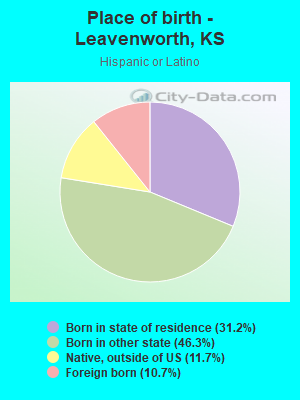
Races - Hispanic (%)
Races - Hispanic (% change since 2000)
Races - Native Hawaiian and Other Pacific Islander alone (%)
Races - Native Hawaiian and Other Pacific Islander alone (% change since 2000)
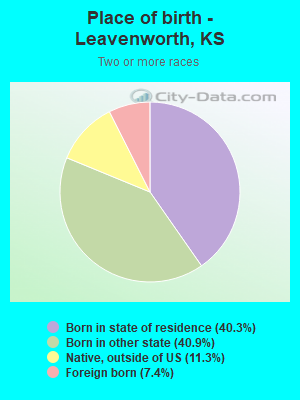
Races - Two or more races(%)
Races - Two or more races(% change since 2000)
Races - Other race alone (%)
Races - Other race alone (% change since 2000)
Racial diversity
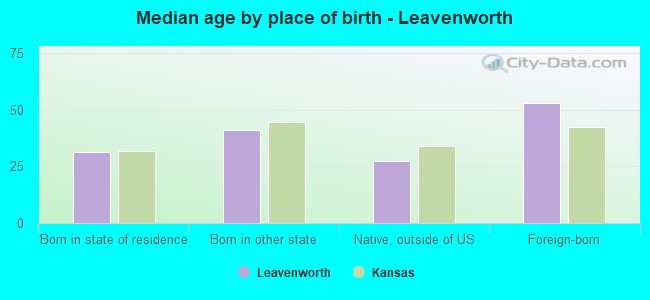
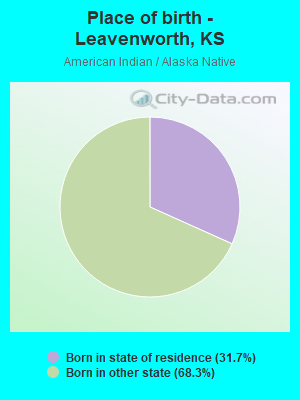
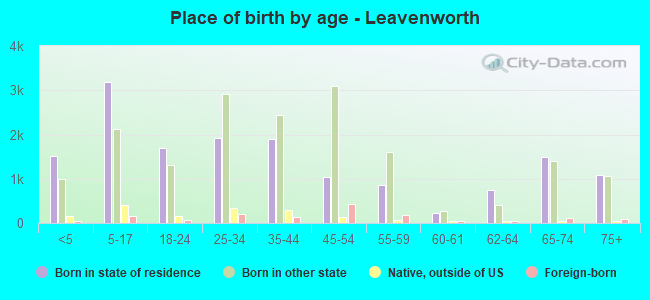
Place of birth - Born in state of residence (%)
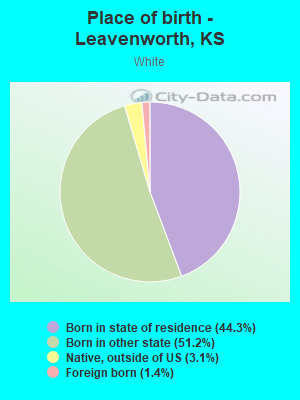
Place of birth - Born in state of residence (%) - White
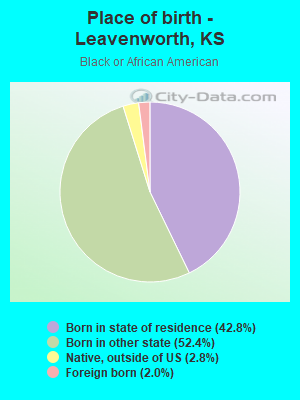
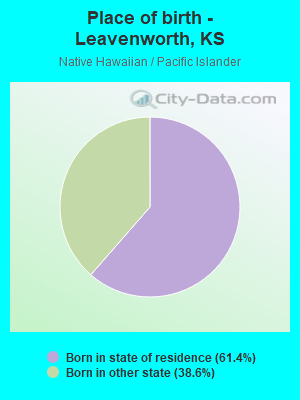
Place of birth - Born in state of residence (%) - Black or African American
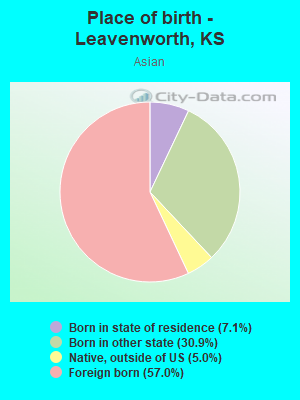
Place of birth - Born in state of residence (%) - Asian
Place of birth - Born in state of residence (%) - Hispanic or Latino
Place of birth - Born in state of residence (%) - American Indian and Alaska Native
Place of birth - Born in state of residence (%) - Multirace
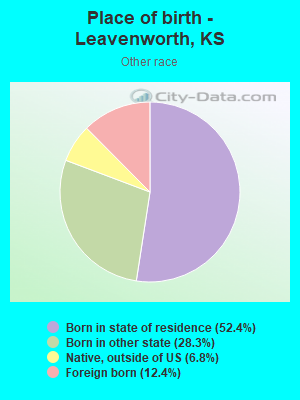
Place of birth - Born in state of residence (%) - Other Race
Place of birth - Born in other state (%)
Place of birth - Born in other state (%) - White
Place of birth - Born in other state (%) - Black or African American
Place of birth - Born in other state (%) - Asian
Place of birth - Born in other state (%) - Hispanic or Latino
Place of birth - Born in other state (%) - American Indian and Alaska Native
Place of birth - Born in other state (%) - Multirace
Place of birth - Born in other state (%) - Other Race
Place of birth - Native, outside of US (%)
Place of birth - Native, outside of US (%) - White
Place of birth - Native, outside of US (%) - Black or African American
Place of birth - Native, outside of US (%) - Asian
Place of birth - Native, outside of US (%) - Hispanic or Latino
Place of birth - Native, outside of US (%) - American Indian and Alaska Native
Place of birth - Native, outside of US (%) - Multirace
Place of birth - Native, outside of US (%) - Other Race
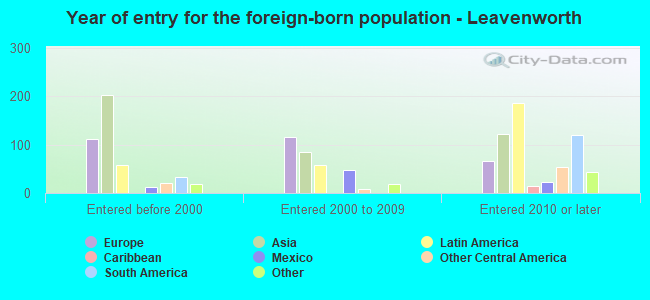
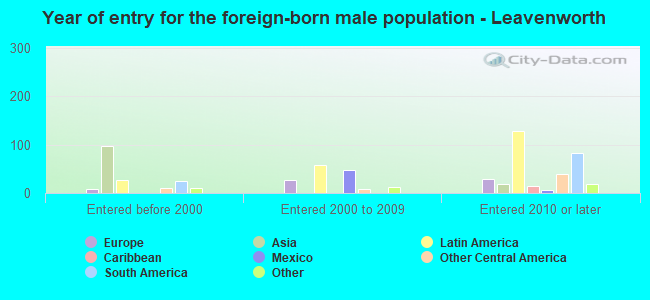
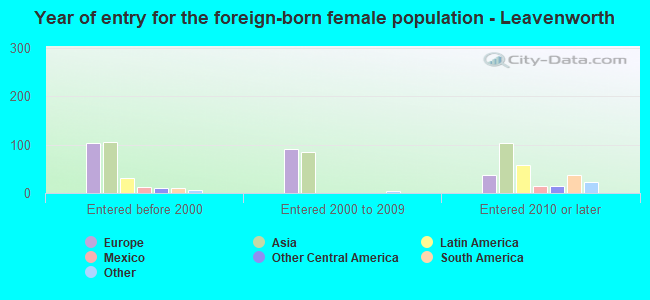
Place of birth - Foreign born (%)
Place of birth - Foreign born (%) - White
Place of birth - Foreign born (%) - Black or African American
Place of birth - Foreign born (%) - Asian
Place of birth - Foreign born (%) - Hispanic or Latino
Place of birth - Foreign born (%) - American Indian and Alaska Native
Place of birth - Foreign born (%) - Multirace
Place of birth - Foreign born (%) - Other Race
Residents speaking English at home (%)
Residents speaking English at home - Born in the United States (%)
Residents speaking English at home - Native, born elsewhere (%)
Residents speaking English at home - Foreign born (%)
Residents speaking Spanish at home (%)
Residents speaking Spanish at home - Born in the United States (%)
Residents speaking Spanish at home - Native, born elsewhere (%)
Residents speaking Spanish at home - Foreign born (%)
Residents speaking other language at home (%)
Residents speaking other language at home - Born in the United States (%)
Residents speaking other language at home - Native, born elsewhere (%)
Residents speaking other language at home - Foreign born (%)
Marital status - Never married (%)
Marital status - Now married (%)
Marital status - Separated (%)
Marital status - Widowed (%)
Marital status - Divorced (%)
Ancestries Reported - Arab (%)
Ancestries Reported - Czech (%)
Ancestries Reported - Danish (%)
Ancestries Reported - Dutch (%)
Ancestries Reported - English (%)
Ancestries Reported - French (%)
Ancestries Reported - French Canadian (%)
Ancestries Reported - German (%)
Ancestries Reported - Greek (%)
Ancestries Reported - Hungarian (%)
Ancestries Reported - Irish (%)
Ancestries Reported - Italian (%)
Ancestries Reported - Lithuanian (%)
Ancestries Reported - Norwegian (%)
Ancestries Reported - Polish (%)
Ancestries Reported - Portuguese (%)
Ancestries Reported - Russian (%)
Ancestries Reported - Scotch-Irish (%)
Ancestries Reported - Scottish (%)
Ancestries Reported - Slovak (%)
Ancestries Reported - Subsaharan African (%)
Ancestries Reported - Swedish (%)
Ancestries Reported - Swiss (%)
Ancestries Reported - Ukrainian (%)
Ancestries Reported - United States (%)
Ancestries Reported - Welsh (%)
Ancestries Reported - West Indian (%)
Ancestries Reported - Other (%)
Geographical mobility - Same house 1 year ago (%)
Geographical mobility - Same house 1 year ago (%) - White
Geographical mobility - Same house 1 year ago (%) - Black or African American
Geographical mobility - Same house 1 year ago (%) - Asian
Geographical mobility - Same house 1 year ago (%) - Hispanic or Latino
Geographical mobility - Same house 1 year ago (%) - American Indian and Alaska Native
Geographical mobility - Same house 1 year ago (%) - Multirace
Geographical mobility - Same house 1 year ago (%) - Other Race
Geographical mobility - Moved within same county (%)
Geographical mobility - Moved within same county (%) - White
Geographical mobility - Moved within same county (%) - Black or African American
Geographical mobility - Moved within same county (%) - Asian
Geographical mobility - Moved within same county (%) - Hispanic or Latino
Geographical mobility - Moved within same county (%) - American Indian and Alaska Native
Geographical mobility - Moved within same county (%) - Multirace
Geographical mobility - Moved within same county (%) - Other Race
Geographical mobility - Moved from different county within same state (%)
Geographical mobility - Moved from different county within same state (%) - White
Geographical mobility - Moved from different county within same state (%) - Black or African American
Geographical mobility - Moved from different county within same state (%) - Asian
Geographical mobility - Moved from different county within same state (%) - Hispanic or Latino
Geographical mobility - Moved from different county within same state (%) - American Indian and Alaska Native
Geographical mobility - Moved from different county within same state (%) - Multirace
Geographical mobility - Moved from different county within same state (%) - Other Race
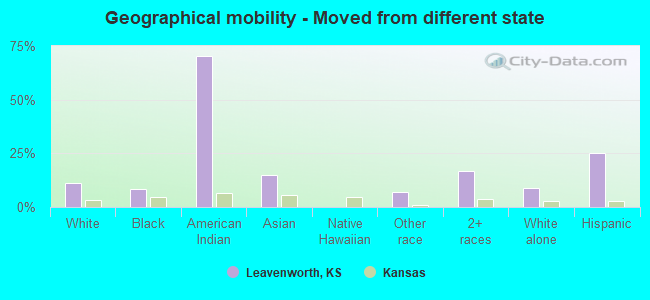
Geographical mobility - Moved from different state (%)
Geographical mobility - Moved from different state (%) - White
Geographical mobility - Moved from different state (%) - Black or African American
Geographical mobility - Moved from different state (%) - Asian
Geographical mobility - Moved from different state (%) - Hispanic or Latino
Geographical mobility - Moved from different state (%) - American Indian and Alaska Native
Geographical mobility - Moved from different state (%) - Multirace
Geographical mobility - Moved from different state (%) - Other Race
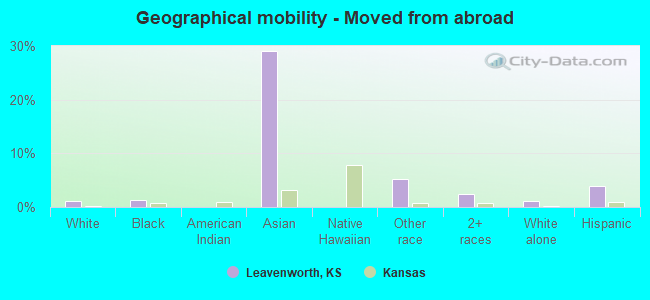
Geographical mobility - Moved from abroad (%)
Geographical mobility - Moved from abroad (%) - White
Geographical mobility - Moved from abroad (%) - Black or African American
Geographical mobility - Moved from abroad (%) - Asian
Geographical mobility - Moved from abroad (%) - Hispanic or Latino
Geographical mobility - Moved from abroad (%) - American Indian and Alaska Native
Geographical mobility - Moved from abroad (%) - Multirace
Geographical mobility - Moved from abroad (%) - Other Race
Place of birth for the foreign-born population - Ireland (%)
Place of birth for the foreign-born population - Denmark (%)
Place of birth for the foreign-born population - Norway (%)
Place of birth for the foreign-born population - Sweden (%)
Place of birth for the foreign-born population - United Kingdom (%)
Place of birth for the foreign-born population - England (%)
Place of birth for the foreign-born population - Scotland (%)
Place of birth for the foreign-born population - Other Northern Europe (%)
Place of birth for the foreign-born population - Austria (%)
Place of birth for the foreign-born population - Belgium (%)
Place of birth for the foreign-born population - France (%)
Place of birth for the foreign-born population - Germany (%)
Place of birth for the foreign-born population - Netherlands (%)
Place of birth for the foreign-born population - Switzerland (%)
Place of birth for the foreign-born population - Other Western Europe (%)
Place of birth for the foreign-born population - Greece (%)
Place of birth for the foreign-born population - Italy (%)
Place of birth for the foreign-born population - Portugal (%)
Place of birth for the foreign-born population - Spain (%)
Place of birth for the foreign-born population - Other Southern Europe (%)
Place of birth for the foreign-born population - Albania (%)
Place of birth for the foreign-born population - Belarus (%)
Place of birth for the foreign-born population - Bosnia and Herzegovina (%)
Place of birth for the foreign-born population - Bulgaria (%)
Place of birth for the foreign-born population - Croatia (%)
Place of birth for the foreign-born population - Czechoslovakia (%)
Place of birth for the foreign-born population - Hungary (%)
Place of birth for the foreign-born population - Latvia (%)
Place of birth for the foreign-born population - Lithuania (%)
Place of birth for the foreign-born population - North Macedonia (Macedonia) (%)
Place of birth for the foreign-born population - Moldova (%)
Place of birth for the foreign-born population - Poland (%)
Place of birth for the foreign-born population - Romania (%)
Place of birth for the foreign-born population - Russia (%)
Place of birth for the foreign-born population - Serbia (%)
Place of birth for the foreign-born population - Ukraine (%)
Place of birth for the foreign-born population - Other Eastern Europe (%)
Place of birth for the foreign-born population - China (%)
Place of birth for the foreign-born population - Hong Kong (%)
Place of birth for the foreign-born population - Taiwan (%)
Place of birth for the foreign-born population - Japan (%)
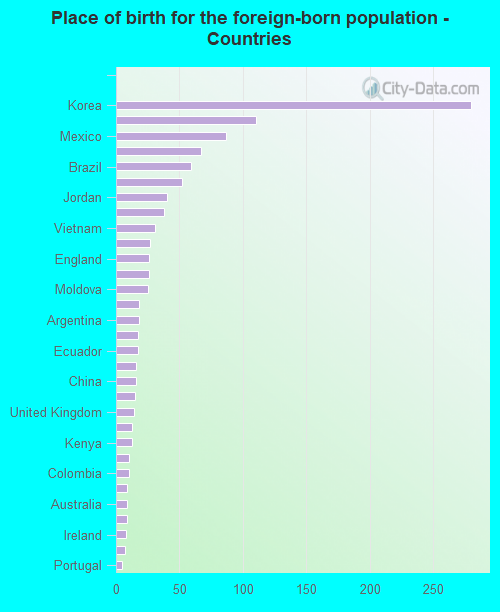
Place of birth for the foreign-born population - Korea (%)
Place of birth for the foreign-born population - Other Eastern Asia (%)
Place of birth for the foreign-born population - Afghanistan (%)
Place of birth for the foreign-born population - Bangladesh (%)
Place of birth for the foreign-born population - India (%)
Place of birth for the foreign-born population - Iran (%)
Place of birth for the foreign-born population - Kazakhstan (%)
Place of birth for the foreign-born population - Nepal (%)
Place of birth for the foreign-born population - Pakistan (%)
Place of birth for the foreign-born population - Sri Lanka (%)
Place of birth for the foreign-born population - Uzbekistan (%)
Place of birth for the foreign-born population - Other South Central Asia (%)
Place of birth for the foreign-born population - Burma (%)
Place of birth for the foreign-born population - Cambodia (%)
Place of birth for the foreign-born population - Indonesia (%)
Place of birth for the foreign-born population - Laos (%)
Place of birth for the foreign-born population - Malaysia (%)
Place of birth for the foreign-born population - Philippines (%)
Place of birth for the foreign-born population - Singapore (%)
Place of birth for the foreign-born population - Thailand (%)
Place of birth for the foreign-born population - Vietnam (%)
Place of birth for the foreign-born population - Other South Eastern Asia (%)
Place of birth for the foreign-born population - Armenia (%)
Place of birth for the foreign-born population - Iraq (%)
Place of birth for the foreign-born population - Israel (%)
Place of birth for the foreign-born population - Jordan (%)
Place of birth for the foreign-born population - Kuwait (%)
Place of birth for the foreign-born population - Lebanon (%)
Place of birth for the foreign-born population - Saudi Arabia (%)
Place of birth for the foreign-born population - Syria (%)
Place of birth for the foreign-born population - Turkey (%)
Place of birth for the foreign-born population - Yemen (%)
Place of birth for the foreign-born population - Other Western Asia (%)
Place of birth for the foreign-born population - Eritrea (%)
Place of birth for the foreign-born population - Ethiopia (%)
Place of birth for the foreign-born population - Kenya (%)
Place of birth for the foreign-born population - Somalia (%)
Place of birth for the foreign-born population - Uganda (%)
Place of birth for the foreign-born population - Zimbabwe (%)
Place of birth for the foreign-born population - Other Eastern Africa (%)
Place of birth for the foreign-born population - Cameroon (%)
Place of birth for the foreign-born population - Congo (%)
Place of birth for the foreign-born population - Democratic Republic of Congo (Zaire) (%)
Place of birth for the foreign-born population - Other Middle Africa (%)
Place of birth for the foreign-born population - Egypt (%)
Place of birth for the foreign-born population - Morocco (%)
Place of birth for the foreign-born population - Sudan (%)
Place of birth for the foreign-born population - Other Northern Africa (%)
Place of birth for the foreign-born population - South Africa (%)
Place of birth for the foreign-born population - Other Southern Africa (%)
Place of birth for the foreign-born population - Cabo Verde (%)
Place of birth for the foreign-born population - Ghana (%)
Place of birth for the foreign-born population - Liberia (%)
Place of birth for the foreign-born population - Nigeria (%)
Place of birth for the foreign-born population - Senegal (%)
Place of birth for the foreign-born population - Sierra Leone (%)
Place of birth for the foreign-born population - Other Western Africa (%)
Place of birth for the foreign-born population - Australia (%)
Place of birth for the foreign-born population - New Zealand (%)
Place of birth for the foreign-born population - Fiji (%)
Place of birth for the foreign-born population - Micronesia (%)
Place of birth for the foreign-born population - Bahamas (%)
Place of birth for the foreign-born population - Barbados (%)
Place of birth for the foreign-born population - Cuba (%)
Place of birth for the foreign-born population - Dominica (%)
Place of birth for the foreign-born population - Dominican Republic (%)
Place of birth for the foreign-born population - Grenada (%)
Place of birth for the foreign-born population - Haiti (%)
Place of birth for the foreign-born population - Jamaica (%)
Place of birth for the foreign-born population - St. Vincent and the Grenadines (%)
Place of birth for the foreign-born population - Trinidad and Tobago (%)
Place of birth for the foreign-born population - West Indies (%)
Place of birth for the foreign-born population - Other Caribbean (%)
Place of birth for the foreign-born population - Belize (%)
Place of birth for the foreign-born population - Costa Rica (%)
Place of birth for the foreign-born population - El Salvador (%)
Place of birth for the foreign-born population - Guatemala (%)
Place of birth for the foreign-born population - Honduras (%)
Place of birth for the foreign-born population - Mexico (%)
Place of birth for the foreign-born population - Nicaragua (%)
Place of birth for the foreign-born population - Panama (%)
Place of birth for the foreign-born population - Other Central America (%)
Place of birth for the foreign-born population - Argentina (%)
Place of birth for the foreign-born population - Bolivia (%)
Place of birth for the foreign-born population - Brazil (%)
Place of birth for the foreign-born population - Chile (%)
Place of birth for the foreign-born population - Colombia (%)
Place of birth for the foreign-born population - Ecuador (%)
Place of birth for the foreign-born population - Guyana (%)
Place of birth for the foreign-born population - Peru (%)
Place of birth for the foreign-born population - Uruguay (%)
Place of birth for the foreign-born population - Venezuela (%)
Place of birth for the foreign-born population - Other South America (%)
Place of birth for the foreign-born population - Canada (%)
Place of birth for the foreign-born population - Other Northern America (%)
Place of birth for the foreign-born population - Other (%)
Latest news about races in Leavenworth, KS collected exclusively by city-data.com from local newspapers, TV, and radio stations
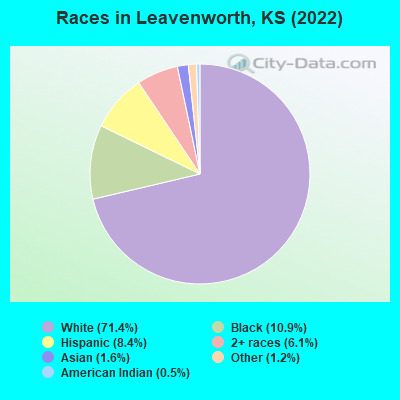
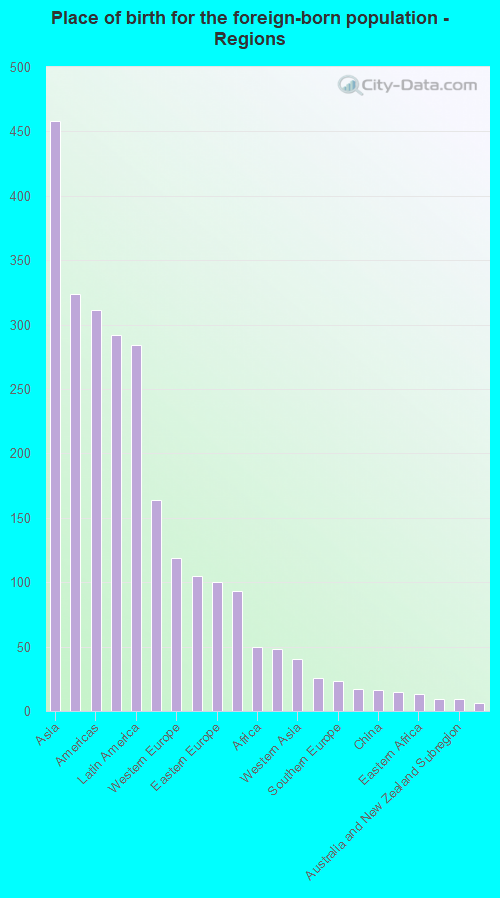
According to 2022 data, the most numerous races in Leavenworth, KS are White alone (26,839 residents), Hispanic (3,169 residents), and Black alone (4,103 residents). 93.6% of Leavenworth residents speak English at home. 3.0% of Leavenworth, KS residents are foreign-born (1.2% born in Asia, 0.8% born in Europe, 0.7% born in Latin America), which is 134.4% less than the foreign-born rate of 7.0% across the entire state of Kansas.
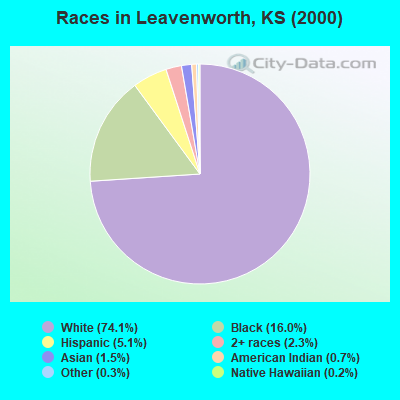
Race distribution in Leavenworth
2000 2022
2,233,997 83.1% White alone 188,252 7.0% Hispanic 151,407 5.6% Black alone 46,301 1.7% Asian alone 42,508 1.6% Two or more races 22,322 0.8% American Indian alone 2,477 0.09% Other race alone 1,154 0.04% Native Hawaiian and Other
2,147,943 73.1% White alone 381,746 13.0% Hispanic 147,666 5.0% Black alone 145,362 4.9% Two or more races 85,085 2.9% Asian alone 13,263 0.5% Other race alone 12,065 0.4% American Indian alone 4,020 0.1% Native Hawaiian and Other
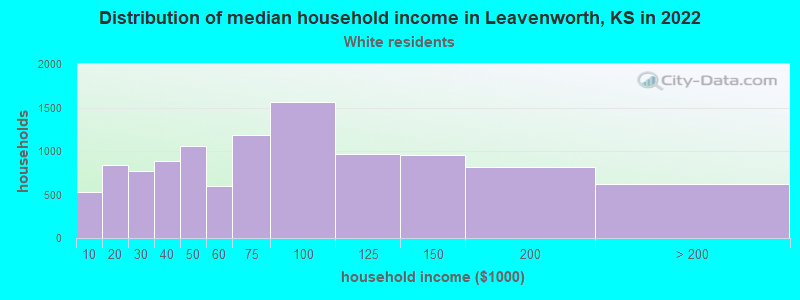
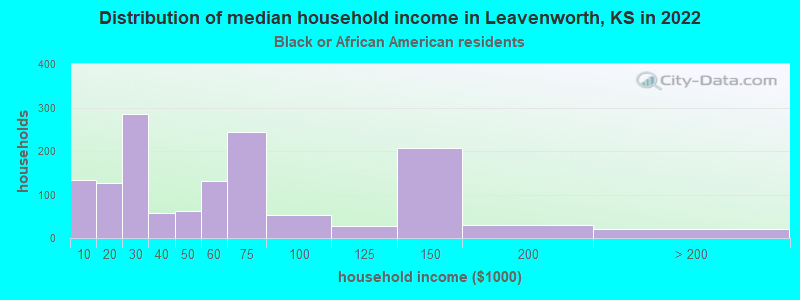
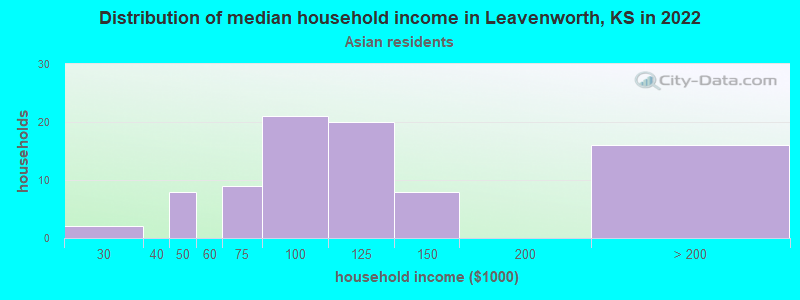
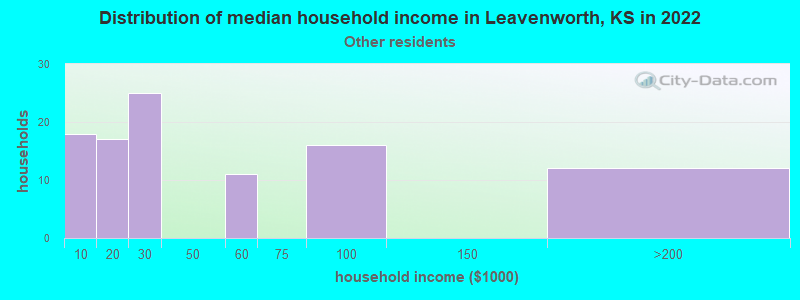
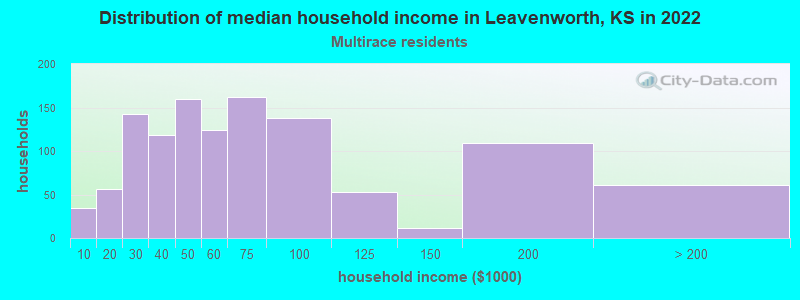
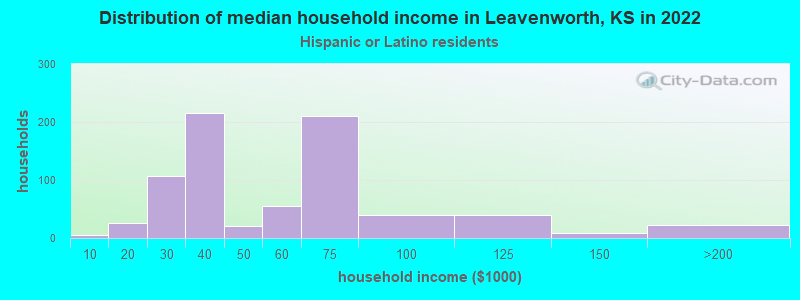
Income and house value in Leavenworth Median household income in 2022 $65,886 White non-Hispanic householders$50,021 Black householdersover $200,000 Asian householders$64,614 Two or more races householders$87,262 Hispanic or Latino race householdersMedian 2022 house value $181,875 White Non-Hispanic householders$170,164 Black or African American householders$227,045 American Indian or Alaska Native householders $143,397 Asian householders$128,579 Some other race householders$190,240 Two or more races householders$144,353 Hispanic or Latino householders
Median age by race in Leavenworth
37.5 Median age for White residents36.3 39.2 31.5 Median age for Black or African American residents34.8 26.7 27.1 Median age for American Indian / Alaska Native residents36.7 5.8 50.6 Median age for Asian residents45.4 72.4 -627,039,626.4 Median age for Native Hawaiian / Pacific Islander residents-669,240,668.6 -666,666,666.0 18.9 Median age for Other race residents14.9 16.7 40.6 Median age for Two or more races residents39.6 38.9 38.0 Median age for White alone residents36.8 40.0 32.5 Median age for Hispanic or Latino residents28.3 29.4
Owner/renter occupied households by race in Leavenworth
House owners and renters - White residents 6,789 68.2% Owner occupied3,166 31.8% Renter occupiedHouse owners and renters - Black or African American residents 116 8.7% Owner occupied1,216 91.3% Renter occupiedHouse owners and renters - American Indian / Alaska Native residents 12 27.0% Owner occupied31 73.0% Renter occupiedHouse owners and renters - Asian residents 56 61.3% Owner occupied36 38.7% Renter occupiedHouse owners and renters - Other race residents 11 12.0% Owner occupied84 88.0% Renter occupiedHouse owners and renters - Two or more races residents 489 48.7% Owner occupied515 51.3% Renter occupiedHouse owners and renters - White alone residents 6,654 68.0% Owner occupied3,138 32.0% Renter occupiedHouse owners and renters - Hispanic or Latino residents 283 47.8% Owner occupied310 52.2% Renter occupied
Language usage in Leavenworth
English speakers - Total 93.6% of residents of Leavenworth speak English at home.
3.1% of residents speak Spanish at home 766 71.0% Speak English very well313 29.0% Speak English less than very well3.2% of residents speak other language at home 901 80.7% Speak English very well215 19.3% Speak English less than very well
English speakers - Born in the United States 96.3% of residents of Leavenworth speak English at home.
1.8% of residents speak Spanish at home 256 77.8% Speak English very well73 22.2% Speak English less than very well1.8% of residents speak other language at home 302 89.6% Speak English very well35 10.4% Speak English less than very well
English speakers - Native, born elsewhere 70.4% of residents of Leavenworth speak English at home.
21.2% of residents speak Spanish at home 133 48.9% Speak English very well139 51.1% Speak English less than very well9.5% of residents speak other language at home 77 63.1% Speak English very well45 36.9% Speak English less than very well
English speakers - Foreign-born 24.6% of residents of Leavenworth speak English at home.
19.3% of residents speak Spanish at home 111 52.1% Speak English very well102 47.9% Speak English less than very well56.0% of residents speak other language at home 476 77.0% Speak English very well142 23.0% Speak English less than very well
White (Caucasian) - Speak only English Native:
97.2% (24,699)Foreign-born:
30.3% (121)
White (Caucasian) - Speak another language Native:
3.0% (755)Foreign-born:
70.0% (280)
Black or African American - Speak only English Native:
96.4% (3,517)Foreign-born:
67.2% (49)
Black or African American - Speak another language Native:
3.6% (130)Foreign-born:
37.2% (27)
Asian - Speak only English Native:
70.2% (166)Foreign-born:
9.1% (30)
Asian - Speak another language Native:
31.8% (75)Foreign-born:
91.2% (300)
Other race - Speak another language Native:
28.2% (259)Foreign-born:
96.6% (145)
Two or more races - Speak only English Native:
78.4% (2,550)Foreign-born:
11.9% (29)
Two or more races - Speak another language Native:
14.5% (471)Foreign-born:
79.6% (194)
White alone - Speak only English Native:
98.2% (24,290)Foreign-born:
29.3% (114)
White alone - Speak another language Native:
1.8% (451)Foreign-born:
72.6% (283)
Hispanic or Latino - Speak only English Native:
70.0% (1,723)Foreign-born:
9.0% (21)
Hispanic or Latino - Speak another language Native:
30.2% (744)Foreign-born:
91.4% (211)
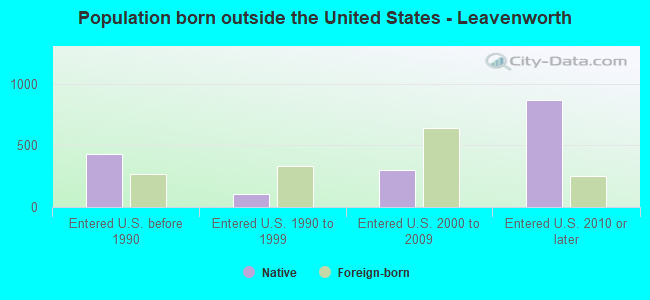
Foreign-born residents in Leavenworth 1,122 residents are foreign born (1.2% Asia , 0.8% Europe , 0.7% Latin America ).
This city:
3.0%Kansas:
7.1%
Marital status for residents in Leavenworth Marital status - White (Caucasian) population 15 years and over
Males 30.8% Never married49.3% Now married4.0% Separated1.6% Widowed14.3% DivorcedFemales 22.8% Never married53.8% Now married1.3% Separated9.0% Widowed13.0% DivorcedWomen who gave birth in the past 12 months Now married:
74.9% (317)Unmarried:
25.1% (106)
Women who did not give birth in the past 12 months Now married:
49.3% (2,510)Unmarried:
50.7% (2,587)
Marital status - Black or African American population 15 years and over
Males 49.9% Never married30.9% Now married7.2% Separated1.7% Widowed10.3% DivorcedFemales 30.6% Never married23.5% Now married0.0% Separated6.4% Widowed39.5% DivorcedWomen who gave birth in the past 12 months Now married:
0.0% (0)Unmarried:
100.0% (65)
Women who did not give birth in the past 12 months Now married:
22.4% (138)Unmarried:
77.6% (478)
Marital status - American Indian / Alaska Native population 15 years and over
Males 69.3% Never married22.8% Now married7.9% Separated0.0% Widowed0.0% DivorcedFemales 38.5% Never married15.4% Now married0.0% Separated23.1% Widowed23.1% DivorcedWomen who did not give birth in the past 12 months Now married:
28.6% (5)Unmarried:
71.4% (11)
Marital status - Asian population 15 years and over
Males 37.2% Never married62.8% Now married0.0% Separated0.0% Widowed0.0% DivorcedFemales 12.9% Never married81.4% Now married0.0% Separated1.9% Widowed3.8% DivorcedWomen who did not give birth in the past 12 months Now married:
67.6% (71)Unmarried:
32.4% (34)
Marital status - Other race population 15 years and over
Males 19.8% Never married56.8% Now married2.6% Separated9.4% Widowed11.5% DivorcedFemales 61.9% Never married31.8% Now married0.0% Separated0.0% Widowed6.2% DivorcedWomen who did not give birth in the past 12 months Now married:
22.5% (71)Unmarried:
77.5% (243)
Marital status - Two or more races population 15 years and over
Males 22.3% Never married52.1% Now married7.5% Separated3.7% Widowed14.4% DivorcedFemales 36.0% Never married30.1% Now married1.5% Separated14.8% Widowed17.5% DivorcedWomen who gave birth in the past 12 months Now married:
0.0% (0)Unmarried:
100.0% (254)
Women who did not give birth in the past 12 months Now married:
49.4% (308)Unmarried:
50.6% (316)
Marital status - White alone, not Hispanic / Latino population 15 years and over
Males 30.6% Never married50.3% Now married3.4% Separated1.6% Widowed14.0% DivorcedFemales 22.9% Never married53.5% Now married1.4% Separated9.3% Widowed12.9% DivorcedWomen who gave birth in the past 12 months Now married:
70.1% (252)Unmarried:
29.9% (108)
Women who did not give birth in the past 12 months Now married:
49.9% (2,492)Unmarried:
50.1% (2,500)
Marital status - Hispanic or Latino population 15 years and over
Males 28.8% Never married45.8% Now married7.6% Separated0.9% Widowed17.0% DivorcedFemales 30.4% Never married50.9% Now married0.0% Separated4.7% Widowed14.0% DivorcedWomen who gave birth in the past 12 months Now married:
100.0% (76)Unmarried:
0.0% (0)
Women who did not give birth in the past 12 months Now married:
38.6% (215)Unmarried:
61.4% (341)
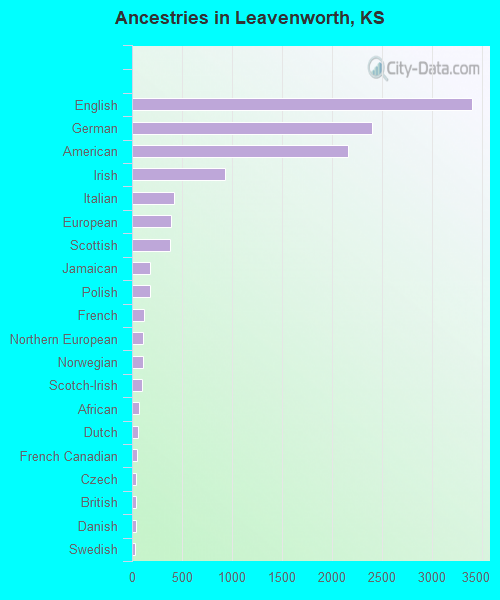
Ancestries in Leavenworth
3,404 21.6% English2,398 15.2% German2,165 13.7% American929 5.9% Irish422 2.7% Italian390 2.5% European381 2.4% Scottish182 1.2% Jamaican176 1.1% Polish117 0.7% French114 0.7% Northern European106 0.7% Norwegian98 0.6% Scotch-Irish73 0.5% African64 0.4% Dutch49 0.3% French Canadian45 0.3% Czech42 0.3% British36 0.2% Danish34 0.2% Swedish30 0.2% Scandinavian28 0.2% Welsh26 0.2% Finnish24 0.2% Jordanian22 0.1% Portuguese21 0.1% Moroccan20 0.1% Eastern European20 0.1% Russian20 0.1% Slovak19 0.1% Canadian19 0.1% Haitian14 0.09% Ukrainian10 0.06% Croatian8 0.05% Hungarian6 0.04% Romanian6 0.04% Nigerian5 0.03% Armenian5 0.03% Austrian5 0.03% Brazilian5 0.03% Iranian
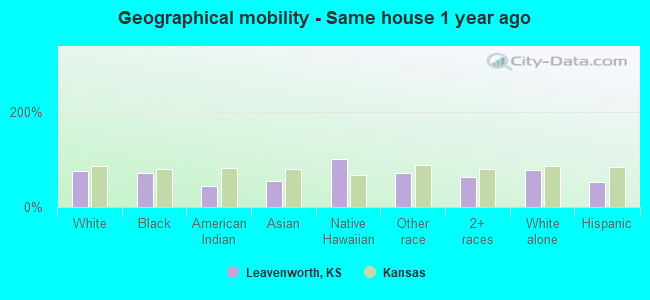
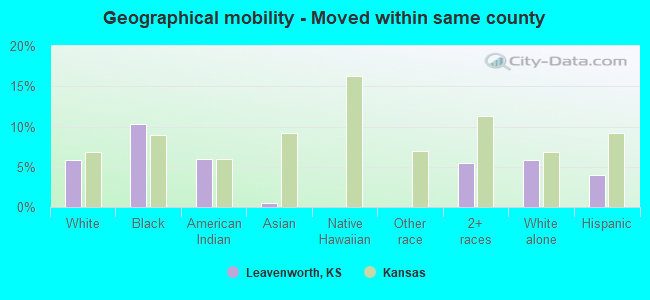
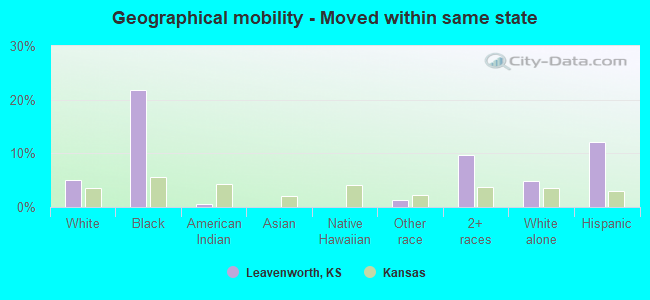
Geographical mobility in Leavenworth Same house 1 year ago 20,759 75.2% White (Caucasian)2,974 72.2% Black or African American95 43.3% American Indian / Alaska Native322 55.4% Asian24 100.0% Native Hawaiian / Pacific Islander848 72.0% Other race2,783 63.0% Two or more races20,397 76.9% White alone, not Hispanic / Latino1,571 51.6% Hispanic or LatinoMoved within same county 1,597 5.8% White / Caucasian423 10.3% Black or African American13 5.9% American Indian / Alaska Native3 0.5% Asian243 5.5% Two or more races1,557 5.9% White alone, not Hispanic / Latino122 4.0% Hispanic or LatinoMoved within same state 1,407 5.1% White / Caucasian900 21.9% Black or African American1 0.5% American Indian / Alaska Native15 1.3% Other race431 9.8% Two or more races1,300 4.9% White alone, not Hispanic / Latino366 12.0% Hispanic or LatinoMoved from different state 3,038 11.0% White / Caucasian349 8.5% Black or African American154 70.2% American Indian / Alaska Native88 15.1% Asian82 6.9% Other race734 16.6% Two or more races2,313 8.7% White alone, not Hispanic / Latino763 25.1% Hispanic or LatinoMoved from abroad 299 1.1% White55 1.3% Black or African American169 29.1% Asian61 5.2% Other race107 2.4% Two or more races297 1.1% White alone, not Hispanic / Latino118 3.9% Hispanic or Latino
Children Nativity (place of birth) in Leavenworth
Children under 6 years - Living with two parents Both parents native 2,072 100.0% NativeBoth parents foreign-born 12 100.0% NativeOne native, one foreign-born parent 120 100.0% NativeChildren under 6 years - Living with one parent Native parent 822 100.0% NativeChildren 6 to 17 years - Living with two parents Both parents native 3,151 99.6% Native14 0.4% Foreign-bornBoth parents foreign-born 67 46.6% Native77 53.4% Foreign-bornOne native, one foreign-born parent 299 98.1% Native6 1.9% Foreign-bornChildren 6 to 17 years - Living with one parent Native parent 1,293 100.0% NativeForeign-born parent 47 50.2% Native47 49.8% Foreign-born
Grandparents responsible for own grandchildren in Leavenworth
Grandparents (30 to 59 years) White / Caucasian 62 14.7% Responsible for grandchildren362 85.3% Not responsible for grandchildrenBlack or African American 84 34.6% Responsible for grandchildren159 65.4% Not responsible for grandchildrenTwo or more races 9 34.0% Responsible for grandchildren17 66.0% Not responsible for grandchildrenWhite alone, not Hispanic / Latino 62 14.7% Responsible for grandchildren362 85.3% Not responsible for grandchildrenGrandparents (60 years and over) White / Caucasian 132 83.5% Responsible for grandchildren26 16.5% Not responsible for grandchildrenBlack or African American 5 100.0% Not responsible for grandchildrenTwo or more races 43 37.4% Responsible for grandchildren72 62.6% Not responsible for grandchildrenWhite alone, not Hispanic / Latino 132 83.5% Responsible for grandchildren26 16.5% Not responsible for grandchildren