Races in Levittown, Pennsylvania (PA) Detailed Stats
Data:
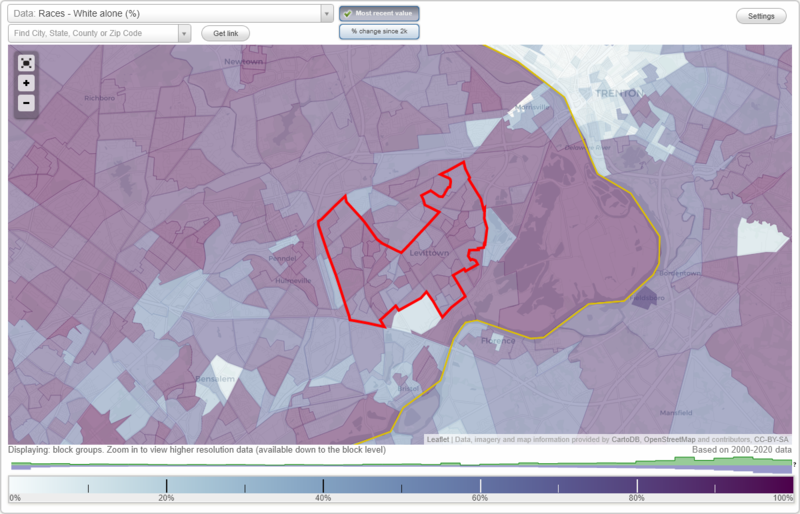
Races - White alone (%)
Races - White alone (% change since 2000)
Races - Black alone (%)
Races - Black alone (% change since 2000)
Races - American Indian alone (%)
Races - American Indian alone (% change since 2000)
Races - Asian alone (%)
Races - Asian alone (% change since 2000)
Races - Hispanic (%)
Races - Hispanic (% change since 2000)
Races - Native Hawaiian and Other Pacific Islander alone (%)
Races - Native Hawaiian and Other Pacific Islander alone (% change since 2000)
Races - Two or more races(%)
Races - Two or more races(% change since 2000)
Races - Other race alone (%)
Races - Other race alone (% change since 2000)
Racial diversity
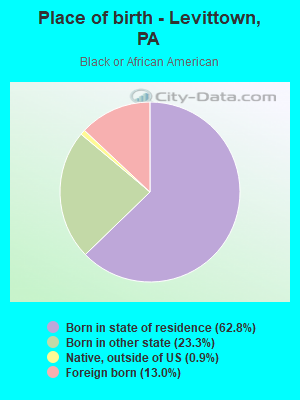
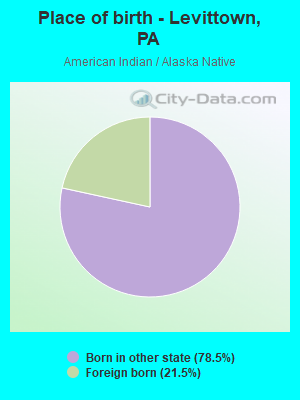
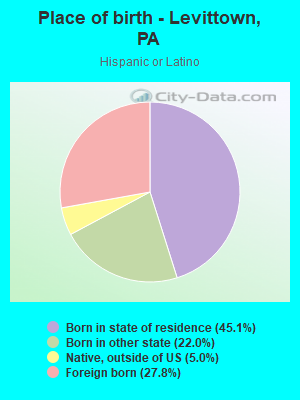
Place of birth - Born in state of residence (%)
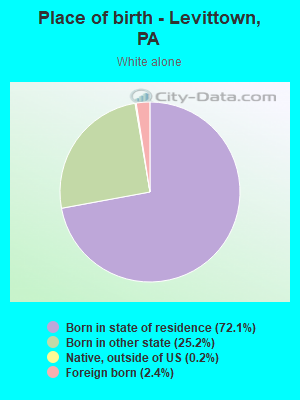
Place of birth - Born in state of residence (%) - White
Place of birth - Born in state of residence (%) - Black or African American
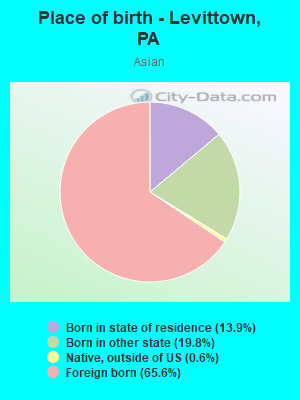
Place of birth - Born in state of residence (%) - Asian
Place of birth - Born in state of residence (%) - Hispanic or Latino
Place of birth - Born in state of residence (%) - American Indian and Alaska Native
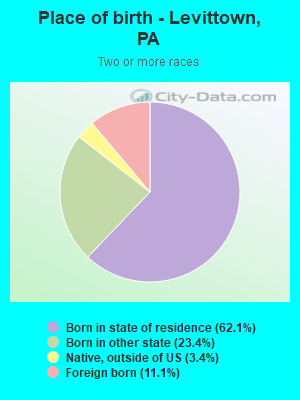
Place of birth - Born in state of residence (%) - Multirace
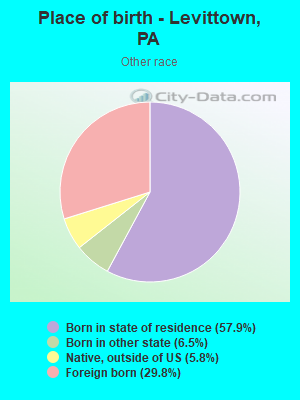
Place of birth - Born in state of residence (%) - Other Race
Place of birth - Born in other state (%)
Place of birth - Born in other state (%) - White
Place of birth - Born in other state (%) - Black or African American
Place of birth - Born in other state (%) - Asian
Place of birth - Born in other state (%) - Hispanic or Latino
Place of birth - Born in other state (%) - American Indian and Alaska Native
Place of birth - Born in other state (%) - Multirace
Place of birth - Born in other state (%) - Other Race
Place of birth - Native, outside of US (%)
Place of birth - Native, outside of US (%) - White
Place of birth - Native, outside of US (%) - Black or African American
Place of birth - Native, outside of US (%) - Asian
Place of birth - Native, outside of US (%) - Hispanic or Latino
Place of birth - Native, outside of US (%) - American Indian and Alaska Native
Place of birth - Native, outside of US (%) - Multirace
Place of birth - Native, outside of US (%) - Other Race
Place of birth - Foreign born (%)
Place of birth - Foreign born (%) - White
Place of birth - Foreign born (%) - Black or African American
Place of birth - Foreign born (%) - Asian
Place of birth - Foreign born (%) - Hispanic or Latino
Place of birth - Foreign born (%) - American Indian and Alaska Native
Place of birth - Foreign born (%) - Multirace
Place of birth - Foreign born (%) - Other Race
Residents speaking English at home (%)
Residents speaking English at home - Born in the United States (%)
Residents speaking English at home - Native, born elsewhere (%)
Residents speaking English at home - Foreign born (%)
Residents speaking Spanish at home (%)
Residents speaking Spanish at home - Born in the United States (%)
Residents speaking Spanish at home - Native, born elsewhere (%)
Residents speaking Spanish at home - Foreign born (%)
Residents speaking other language at home (%)
Residents speaking other language at home - Born in the United States (%)
Residents speaking other language at home - Native, born elsewhere (%)
Residents speaking other language at home - Foreign born (%)
Marital status - Never married (%)
Marital status - Now married (%)
Marital status - Separated (%)
Marital status - Widowed (%)
Marital status - Divorced (%)
Ancestries Reported - Arab (%)
Ancestries Reported - Czech (%)
Ancestries Reported - Danish (%)
Ancestries Reported - Dutch (%)
Ancestries Reported - English (%)
Ancestries Reported - French (%)
Ancestries Reported - French Canadian (%)
Ancestries Reported - German (%)
Ancestries Reported - Greek (%)
Ancestries Reported - Hungarian (%)
Ancestries Reported - Irish (%)
Ancestries Reported - Italian (%)
Ancestries Reported - Lithuanian (%)
Ancestries Reported - Norwegian (%)
Ancestries Reported - Polish (%)
Ancestries Reported - Portuguese (%)
Ancestries Reported - Russian (%)
Ancestries Reported - Scotch-Irish (%)
Ancestries Reported - Scottish (%)
Ancestries Reported - Slovak (%)
Ancestries Reported - Subsaharan African (%)
Ancestries Reported - Swedish (%)
Ancestries Reported - Swiss (%)
Ancestries Reported - Ukrainian (%)
Ancestries Reported - United States (%)
Ancestries Reported - Welsh (%)
Ancestries Reported - West Indian (%)
Ancestries Reported - Other (%)
Geographical mobility - Same house 1 year ago (%)
Geographical mobility - Same house 1 year ago (%) - White
Geographical mobility - Same house 1 year ago (%) - Black or African American
Geographical mobility - Same house 1 year ago (%) - Asian
Geographical mobility - Same house 1 year ago (%) - Hispanic or Latino
Geographical mobility - Same house 1 year ago (%) - American Indian and Alaska Native
Geographical mobility - Same house 1 year ago (%) - Multirace
Geographical mobility - Same house 1 year ago (%) - Other Race
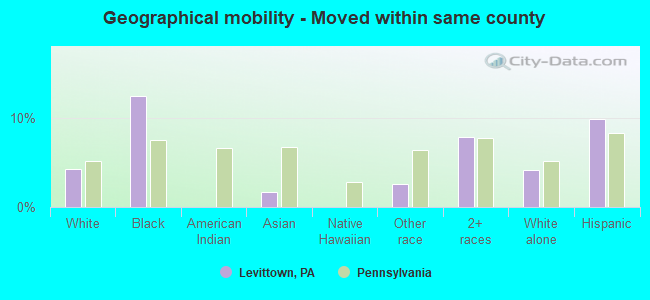
Geographical mobility - Moved within same county (%)
Geographical mobility - Moved within same county (%) - White
Geographical mobility - Moved within same county (%) - Black or African American
Geographical mobility - Moved within same county (%) - Asian
Geographical mobility - Moved within same county (%) - Hispanic or Latino
Geographical mobility - Moved within same county (%) - American Indian and Alaska Native
Geographical mobility - Moved within same county (%) - Multirace
Geographical mobility - Moved within same county (%) - Other Race
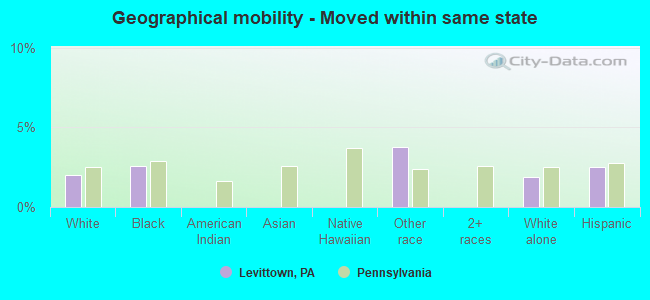
Geographical mobility - Moved from different county within same state (%)
Geographical mobility - Moved from different county within same state (%) - White
Geographical mobility - Moved from different county within same state (%) - Black or African American
Geographical mobility - Moved from different county within same state (%) - Asian
Geographical mobility - Moved from different county within same state (%) - Hispanic or Latino
Geographical mobility - Moved from different county within same state (%) - American Indian and Alaska Native
Geographical mobility - Moved from different county within same state (%) - Multirace
Geographical mobility - Moved from different county within same state (%) - Other Race
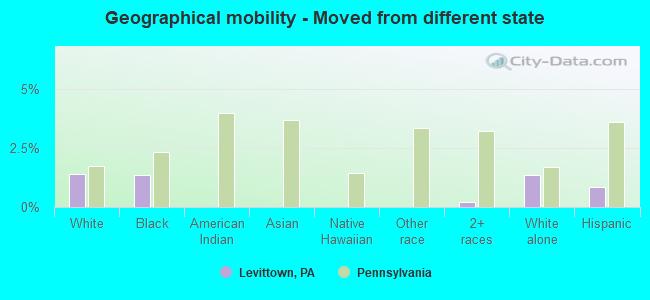
Geographical mobility - Moved from different state (%)
Geographical mobility - Moved from different state (%) - White
Geographical mobility - Moved from different state (%) - Black or African American
Geographical mobility - Moved from different state (%) - Asian
Geographical mobility - Moved from different state (%) - Hispanic or Latino
Geographical mobility - Moved from different state (%) - American Indian and Alaska Native
Geographical mobility - Moved from different state (%) - Multirace
Geographical mobility - Moved from different state (%) - Other Race
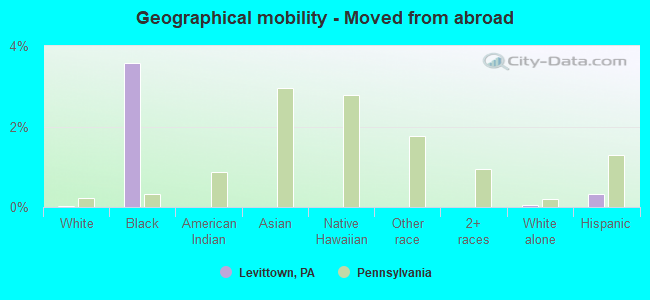
Geographical mobility - Moved from abroad (%)
Geographical mobility - Moved from abroad (%) - White
Geographical mobility - Moved from abroad (%) - Black or African American
Geographical mobility - Moved from abroad (%) - Asian
Geographical mobility - Moved from abroad (%) - Hispanic or Latino
Geographical mobility - Moved from abroad (%) - American Indian and Alaska Native
Geographical mobility - Moved from abroad (%) - Multirace
Geographical mobility - Moved from abroad (%) - Other Race
Place of birth for the foreign-born population - Ireland (%)
Place of birth for the foreign-born population - Denmark (%)
Place of birth for the foreign-born population - Norway (%)
Place of birth for the foreign-born population - Sweden (%)
Place of birth for the foreign-born population - United Kingdom (%)
Place of birth for the foreign-born population - England (%)
Place of birth for the foreign-born population - Scotland (%)
Place of birth for the foreign-born population - Other Northern Europe (%)
Place of birth for the foreign-born population - Austria (%)
Place of birth for the foreign-born population - Belgium (%)
Place of birth for the foreign-born population - France (%)
Place of birth for the foreign-born population - Germany (%)
Place of birth for the foreign-born population - Netherlands (%)
Place of birth for the foreign-born population - Switzerland (%)
Place of birth for the foreign-born population - Other Western Europe (%)
Place of birth for the foreign-born population - Greece (%)
Place of birth for the foreign-born population - Italy (%)
Place of birth for the foreign-born population - Portugal (%)
Place of birth for the foreign-born population - Spain (%)
Place of birth for the foreign-born population - Other Southern Europe (%)
Place of birth for the foreign-born population - Albania (%)
Place of birth for the foreign-born population - Belarus (%)
Place of birth for the foreign-born population - Bosnia and Herzegovina (%)
Place of birth for the foreign-born population - Bulgaria (%)
Place of birth for the foreign-born population - Croatia (%)
Place of birth for the foreign-born population - Czechoslovakia (%)
Place of birth for the foreign-born population - Hungary (%)
Place of birth for the foreign-born population - Latvia (%)
Place of birth for the foreign-born population - Lithuania (%)
Place of birth for the foreign-born population - North Macedonia (Macedonia) (%)
Place of birth for the foreign-born population - Moldova (%)
Place of birth for the foreign-born population - Poland (%)
Place of birth for the foreign-born population - Romania (%)
Place of birth for the foreign-born population - Russia (%)
Place of birth for the foreign-born population - Serbia (%)
Place of birth for the foreign-born population - Ukraine (%)
Place of birth for the foreign-born population - Other Eastern Europe (%)
Place of birth for the foreign-born population - China (%)
Place of birth for the foreign-born population - Hong Kong (%)
Place of birth for the foreign-born population - Taiwan (%)
Place of birth for the foreign-born population - Japan (%)
Place of birth for the foreign-born population - Korea (%)
Place of birth for the foreign-born population - Other Eastern Asia (%)
Place of birth for the foreign-born population - Afghanistan (%)
Place of birth for the foreign-born population - Bangladesh (%)
Place of birth for the foreign-born population - India (%)
Place of birth for the foreign-born population - Iran (%)
Place of birth for the foreign-born population - Kazakhstan (%)
Place of birth for the foreign-born population - Nepal (%)
Place of birth for the foreign-born population - Pakistan (%)
Place of birth for the foreign-born population - Sri Lanka (%)
Place of birth for the foreign-born population - Uzbekistan (%)
Place of birth for the foreign-born population - Other South Central Asia (%)
Place of birth for the foreign-born population - Burma (%)
Place of birth for the foreign-born population - Cambodia (%)
Place of birth for the foreign-born population - Indonesia (%)
Place of birth for the foreign-born population - Laos (%)
Place of birth for the foreign-born population - Malaysia (%)
Place of birth for the foreign-born population - Philippines (%)
Place of birth for the foreign-born population - Singapore (%)
Place of birth for the foreign-born population - Thailand (%)
Place of birth for the foreign-born population - Vietnam (%)
Place of birth for the foreign-born population - Other South Eastern Asia (%)
Place of birth for the foreign-born population - Armenia (%)
Place of birth for the foreign-born population - Iraq (%)
Place of birth for the foreign-born population - Israel (%)
Place of birth for the foreign-born population - Jordan (%)
Place of birth for the foreign-born population - Kuwait (%)
Place of birth for the foreign-born population - Lebanon (%)
Place of birth for the foreign-born population - Saudi Arabia (%)
Place of birth for the foreign-born population - Syria (%)
Place of birth for the foreign-born population - Turkey (%)
Place of birth for the foreign-born population - Yemen (%)
Place of birth for the foreign-born population - Other Western Asia (%)
Place of birth for the foreign-born population - Eritrea (%)
Place of birth for the foreign-born population - Ethiopia (%)
Place of birth for the foreign-born population - Kenya (%)
Place of birth for the foreign-born population - Somalia (%)
Place of birth for the foreign-born population - Uganda (%)
Place of birth for the foreign-born population - Zimbabwe (%)
Place of birth for the foreign-born population - Other Eastern Africa (%)
Place of birth for the foreign-born population - Cameroon (%)
Place of birth for the foreign-born population - Congo (%)
Place of birth for the foreign-born population - Democratic Republic of Congo (Zaire) (%)
Place of birth for the foreign-born population - Other Middle Africa (%)
Place of birth for the foreign-born population - Egypt (%)
Place of birth for the foreign-born population - Morocco (%)
Place of birth for the foreign-born population - Sudan (%)
Place of birth for the foreign-born population - Other Northern Africa (%)
Place of birth for the foreign-born population - South Africa (%)
Place of birth for the foreign-born population - Other Southern Africa (%)
Place of birth for the foreign-born population - Cabo Verde (%)
Place of birth for the foreign-born population - Ghana (%)
Place of birth for the foreign-born population - Liberia (%)
Place of birth for the foreign-born population - Nigeria (%)
Place of birth for the foreign-born population - Senegal (%)
Place of birth for the foreign-born population - Sierra Leone (%)
Place of birth for the foreign-born population - Other Western Africa (%)
Place of birth for the foreign-born population - Australia (%)
Place of birth for the foreign-born population - New Zealand (%)
Place of birth for the foreign-born population - Fiji (%)
Place of birth for the foreign-born population - Micronesia (%)
Place of birth for the foreign-born population - Bahamas (%)
Place of birth for the foreign-born population - Barbados (%)
Place of birth for the foreign-born population - Cuba (%)
Place of birth for the foreign-born population - Dominica (%)
Place of birth for the foreign-born population - Dominican Republic (%)
Place of birth for the foreign-born population - Grenada (%)
Place of birth for the foreign-born population - Haiti (%)
Place of birth for the foreign-born population - Jamaica (%)
Place of birth for the foreign-born population - St. Vincent and the Grenadines (%)
Place of birth for the foreign-born population - Trinidad and Tobago (%)
Place of birth for the foreign-born population - West Indies (%)
Place of birth for the foreign-born population - Other Caribbean (%)
Place of birth for the foreign-born population - Belize (%)
Place of birth for the foreign-born population - Costa Rica (%)
Place of birth for the foreign-born population - El Salvador (%)
Place of birth for the foreign-born population - Guatemala (%)
Place of birth for the foreign-born population - Honduras (%)
Place of birth for the foreign-born population - Mexico (%)
Place of birth for the foreign-born population - Nicaragua (%)
Place of birth for the foreign-born population - Panama (%)
Place of birth for the foreign-born population - Other Central America (%)
Place of birth for the foreign-born population - Argentina (%)
Place of birth for the foreign-born population - Bolivia (%)
Place of birth for the foreign-born population - Brazil (%)
Place of birth for the foreign-born population - Chile (%)
Place of birth for the foreign-born population - Colombia (%)
Place of birth for the foreign-born population - Ecuador (%)
Place of birth for the foreign-born population - Guyana (%)
Place of birth for the foreign-born population - Peru (%)
Place of birth for the foreign-born population - Uruguay (%)
Place of birth for the foreign-born population - Venezuela (%)
Place of birth for the foreign-born population - Other South America (%)
Place of birth for the foreign-born population - Canada (%)
Place of birth for the foreign-born population - Other Northern America (%)
Place of birth for the foreign-born population - Other (%)
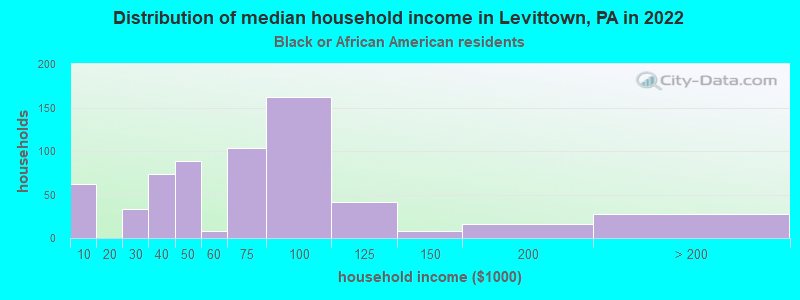
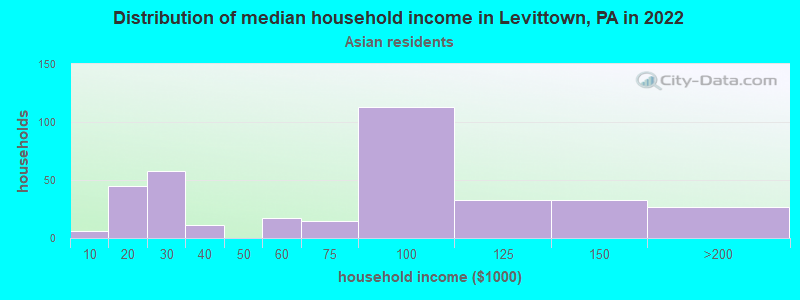
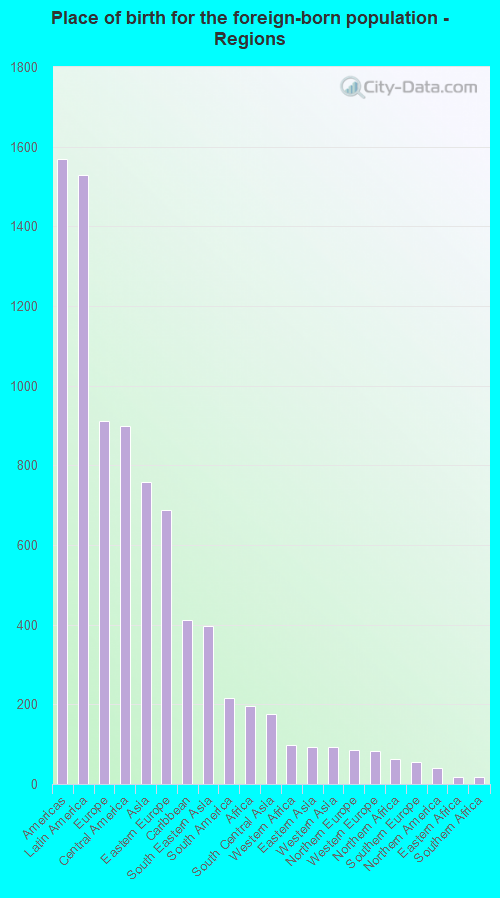
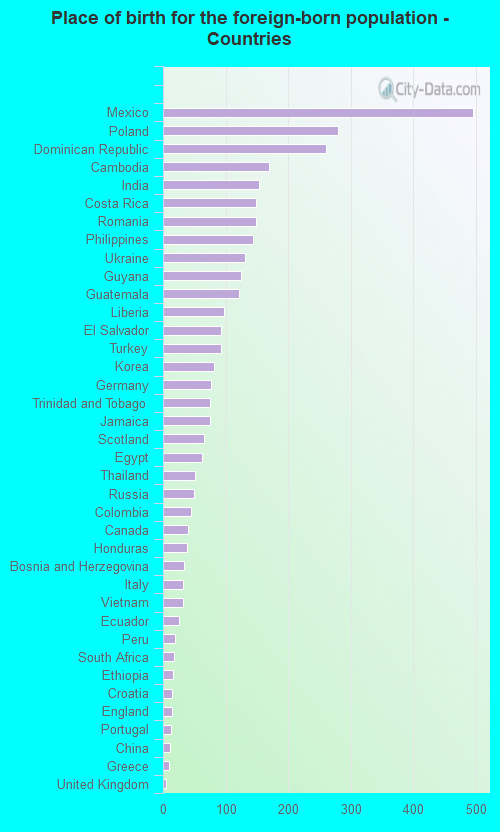
According to 2022 data, the most numerous races in Levittown, PA are White alone (40,008 residents), Black alone (1,620 residents), and Hispanic (5,346 residents). 88.8% of Levittown residents speak English at home. 6.7% of Levittown, PA residents are foreign-born (2.9% born in Latin America, 1.7% born in Europe, 1.4% born in Asia), which is 4.2% less than the foreign-born rate of 7.0% across the entire state of Pennsylvania.
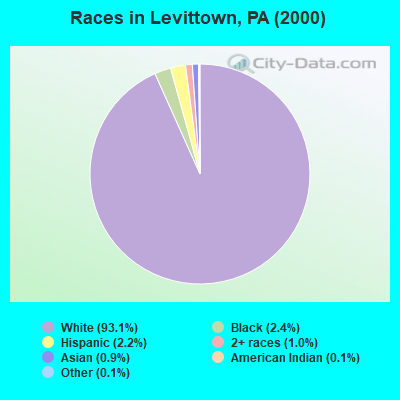
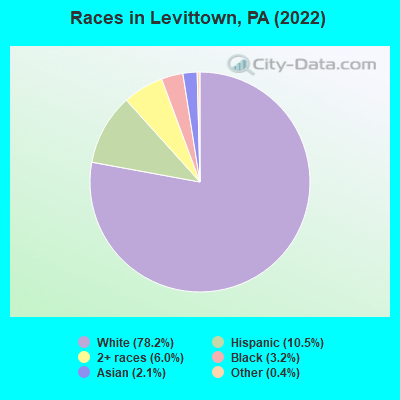
Race distribution in Levittown
2000 2022
10,322,455 84.1% White alone 1,202,437 9.8% Black alone 394,088 3.2% Hispanic 218,296 1.8% Asian alone 113,097 0.9% Two or more races 13,086 0.1% Other race alone 14,904 0.1% American Indian alone 2,691 0.02% Native Hawaiian and Other
9,487,228 73.1% White alone 1,311,581 10.1% Black alone 1,115,997 8.6% Hispanic 493,942 3.8% Two or more races 487,124 3.8% Asian alone 63,582 0.5% Other race alone 10,130 0.08% American Indian alone 2,424 0.02% Native Hawaiian and Other
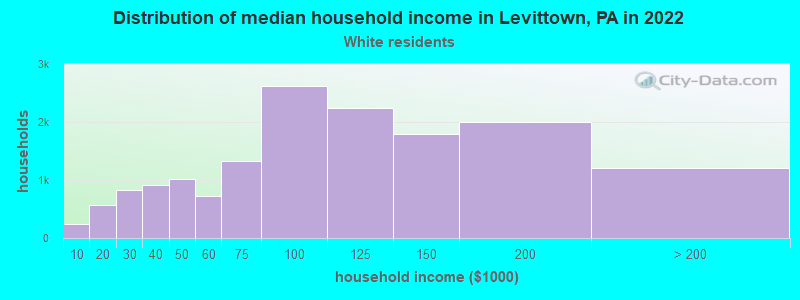
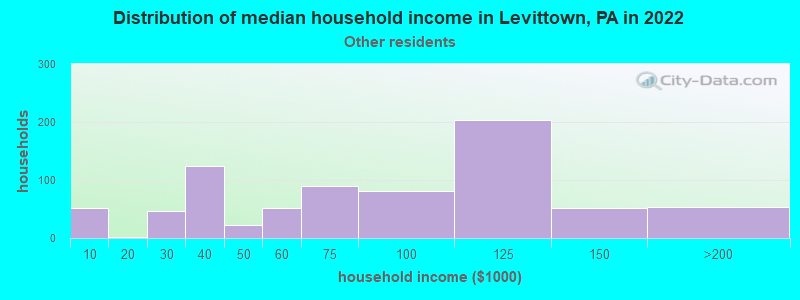
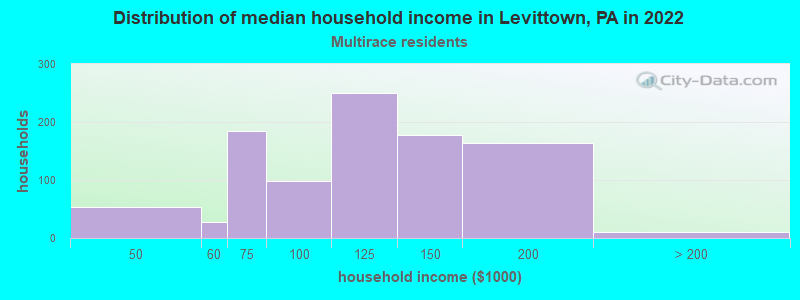
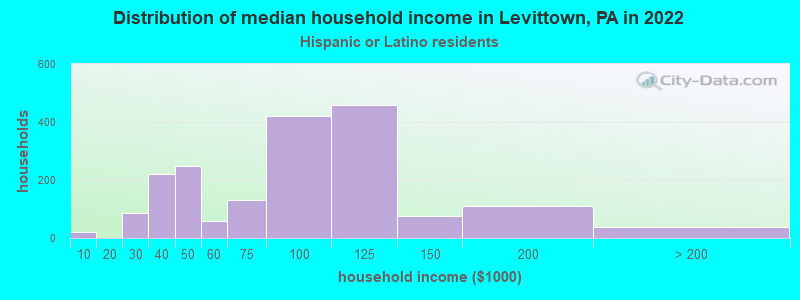
Income and house value in Levittown Median household income in 2022 $95,398 White non-Hispanic householders$79,787 Black householders$97,414 Asian householders$79,091 Some other race householders$112,431 Two or more races householders$85,468 Hispanic or Latino race householdersMedian 2022 house value $306,369 White Non-Hispanic householders$344,163 Black or African American householders$305,297 American Indian or Alaska Native householders $333,441 Asian householders$288,679 Some other race householders$422,163 Two or more races householders$302,885 Hispanic or Latino householders
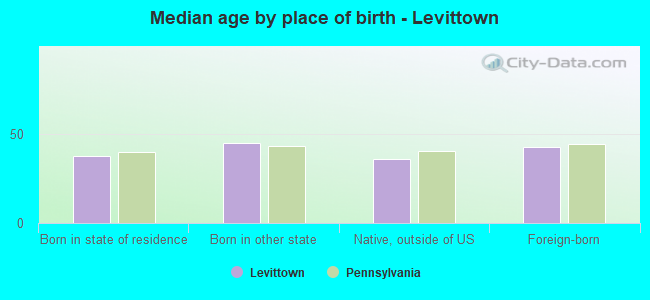
Median age by race in Levittown
42.1 Median age for White residents40.9 43.6 36.8 Median age for Black or African American residents40.8 33.8 -674,382,715.4 Median age for American Indian / Alaska Native residents-668,138,336.3 -858,283,432.3 43.0 Median age for Asian residents28.4 49.5 -680,432,644.4 Median age for Native Hawaiian / Pacific Islander residents-649,523,808.9 -747,474,746.7 28.4 Median age for Other race residents27.7 30.7 32.2 Median age for Two or more races residents42.7 28.2 42.7 Median age for White alone residents40.7 44.3 34.5 Median age for Hispanic or Latino residents36.8 29.9
Owner/renter occupied households by race in Levittown
House owners and renters - White residents 13,779 89.0% Owner occupied1,699 11.0% Renter occupiedHouse owners and renters - Black or African American residents 214 38.5% Owner occupied343 61.5% Renter occupiedHouse owners and renters - Asian residents 207 58.4% Owner occupied148 41.6% Renter occupiedHouse owners and renters - Native Hawaiian / Pacific Islander residents 1 100.0% Owner occupiedHouse owners and renters - Other race residents 627 84.1% Owner occupied119 15.9% Renter occupiedHouse owners and renters - Two or more races residents 1,046 100.0% Owner occupiedHouse owners and renters - White alone residents 13,415 88.9% Owner occupied1,683 11.1% Renter occupiedHouse owners and renters - Hispanic or Latino residents 1,561 86.8% Owner occupied238 13.2% Renter occupied
Language usage in Levittown
English speakers - Total 88.8% of residents of Levittown speak English at home.
6.7% of residents speak Spanish at home 2,170 66.7% Speak English very well1,082 33.3% Speak English less than very well4.7% of residents speak other language at home 1,150 50.7% Speak English very well1,119 49.3% Speak English less than very well
English speakers - Born in the United States 93.0% of residents of Levittown speak English at home.
4.7% of residents speak Spanish at home 434 78.2% Speak English very well121 21.8% Speak English less than very well2.3% of residents speak other language at home 244 91.7% Speak English very well22 8.3% Speak English less than very well
English speakers - Native, born elsewhere 50.1% of residents of Levittown speak English at home.
39.4% of residents speak Spanish at home 100 52.1% Speak English very well92 47.9% Speak English less than very well0.4% of residents speak other language at home 2 100.0% Speak English very well
English speakers - Foreign-born 21.1% of residents of Levittown speak English at home.
33.5% of residents speak Spanish at home 473 42.1% Speak English very well651 57.9% Speak English less than very well46.6% of residents speak other language at home 496 31.8% Speak English very well1,066 68.2% Speak English less than very well
White (Caucasian) - Speak only English Native:
97.4% (36,844)Foreign-born:
20.2% (233)
White (Caucasian) - Speak another language Native:
2.5% (936)Foreign-born:
80.1% (923)
Black or African American - Speak only English Native:
96.2% (1,482)Foreign-born:
23.8% (59)
Black or African American - Speak another language Native:
3.1% (48)Foreign-born:
96.0% (236)
American Indian / Alaska Native - Speak only English Native:
84.4% (26)Foreign-born:
71.9% (5)
Asian - Speak only English Native:
62.6% (230)Foreign-born:
21.9% (154)
Asian - Speak another language Native:
38.6% (142)Foreign-born:
78.3% (549)
Other race - Speak only English Native:
28.8% (449)Foreign-born:
55.2% (474)
Other race - Speak another language Native:
79.3% (1,238)Foreign-born:
60.4% (519)
Two or more races - Speak only English Native:
86.8% (3,541)Foreign-born:
7.0% (37)
Two or more races - Speak another language Native:
13.3% (544)Foreign-born:
95.9% (508)
White alone - Speak only English Native:
98.3% (36,384)Foreign-born:
21.7% (213)
White alone - Speak another language Native:
1.8% (652)Foreign-born:
78.6% (770)
Hispanic or Latino - Speak only English Native:
47.1% (1,641)Foreign-born:
27.1% (389)
Hispanic or Latino - Speak another language Native:
53.7% (1,869)Foreign-born:
75.6% (1,087)
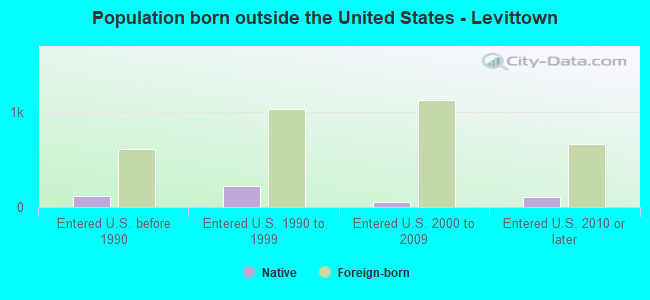
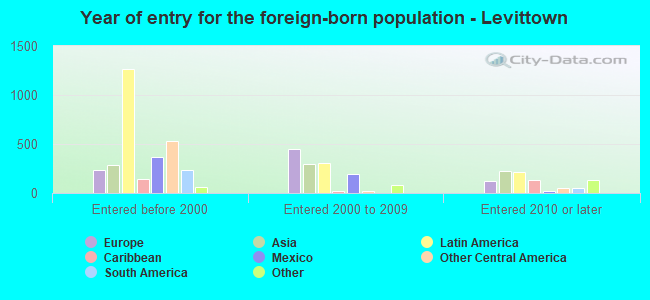
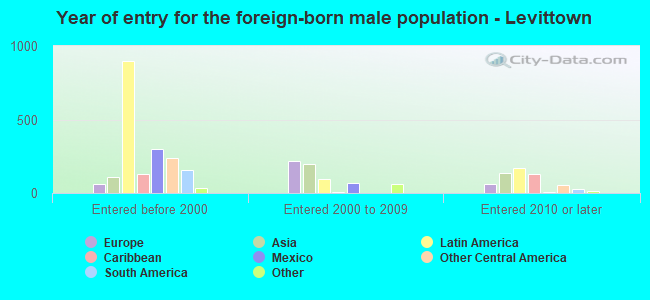
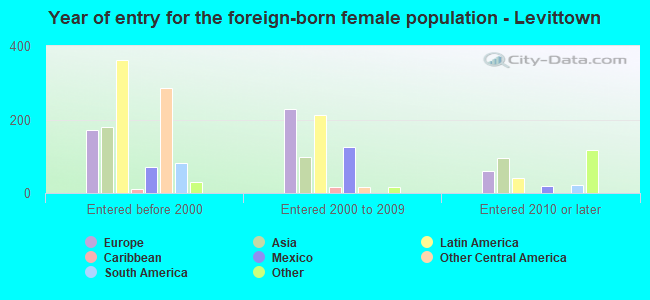
Foreign-born residents in Levittown 3,435 residents are foreign born (2.9% Latin America , 1.7% Europe , 1.4% Asia ).
This city:
6.7%Pennsylvania:
7.3%
Marital status for residents in Levittown Marital status - White (Caucasian) population 15 years and over
Males 38.3% Never married49.4% Now married1.4% Separated3.5% Widowed7.4% DivorcedFemales 29.1% Never married48.6% Now married1.5% Separated8.5% Widowed12.3% DivorcedWomen who gave birth in the past 12 months Now married:
65.1% (323)Unmarried:
34.9% (173)
Women who did not give birth in the past 12 months Now married:
40.3% (3,397)Unmarried:
59.7% (5,041)
Marital status - Black or African American population 15 years and over
Males 39.8% Never married37.6% Now married8.9% Separated1.3% Widowed12.3% DivorcedFemales 56.5% Never married32.7% Now married0.0% Separated8.8% Widowed2.0% DivorcedWomen who gave birth in the past 12 months Now married:
0.0% (0)Unmarried:
100.0% (13)
Women who did not give birth in the past 12 months Now married:
33.5% (183)Unmarried:
66.5% (364)
Marital status - Asian population 15 years and over
Males 52.4% Never married47.6% Now married0.0% Separated0.0% Widowed0.0% DivorcedFemales 17.2% Never married53.5% Now married4.3% Separated24.9% Widowed0.0% DivorcedWomen who gave birth in the past 12 months Now married:
100.0% (14)Unmarried:
0.0% (0)
Women who did not give birth in the past 12 months Now married:
40.5% (54)Unmarried:
59.5% (79)
Marital status - Other race population 15 years and over
Males 42.4% Never married52.0% Now married5.4% Separated0.0% Widowed0.1% DivorcedFemales 37.8% Never married37.8% Now married2.7% Separated8.4% Widowed13.3% DivorcedWomen who gave birth in the past 12 months Now married:
100.0% (67)Unmarried:
0.0% (0)
Women who did not give birth in the past 12 months Now married:
37.2% (368)Unmarried:
62.8% (622)
Marital status - Two or more races population 15 years and over
Males 41.5% Never married55.7% Now married0.4% Separated1.2% Widowed1.2% DivorcedFemales 49.3% Never married36.5% Now married0.0% Separated8.3% Widowed6.0% DivorcedWomen who gave birth in the past 12 months Now married:
100.0% (12)Unmarried:
0.0% (0)
Women who did not give birth in the past 12 months Now married:
33.3% (527)Unmarried:
66.7% (1,058)
Marital status - White alone, not Hispanic / Latino population 15 years and over
Males 38.4% Never married49.5% Now married1.3% Separated3.4% Widowed7.3% DivorcedFemales 29.2% Never married48.7% Now married1.3% Separated8.6% Widowed12.3% DivorcedWomen who gave birth in the past 12 months Now married:
64.3% (315)Unmarried:
35.7% (175)
Women who did not give birth in the past 12 months Now married:
39.4% (3,179)Unmarried:
60.6% (4,894)
Marital status - Hispanic or Latino population 15 years and over
Males 39.9% Never married54.6% Now married1.4% Separated1.3% Widowed2.8% DivorcedFemales 34.9% Never married46.7% Now married4.0% Separated5.5% Widowed8.8% DivorcedWomen who gave birth in the past 12 months Now married:
100.0% (72)Unmarried:
0.0% (0)
Women who did not give birth in the past 12 months Now married:
45.1% (693)Unmarried:
54.9% (845)
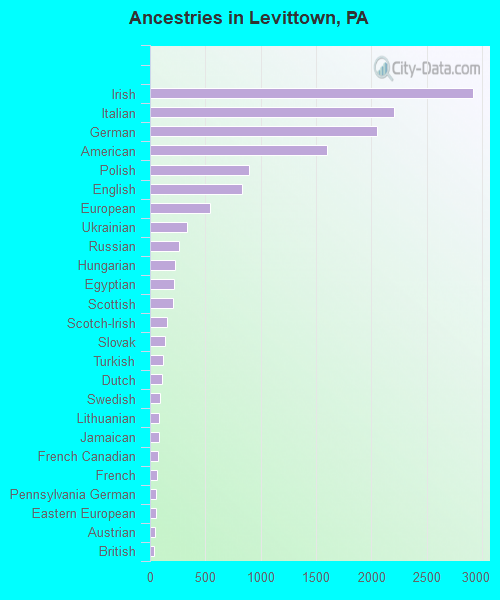
Ancestries in Levittown
2,918 15.3% Irish2,206 11.6% Italian2,056 10.8% German1,604 8.4% American895 4.7% Polish830 4.4% English545 2.9% European332 1.7% Ukrainian261 1.4% Russian227 1.2% Hungarian218 1.1% Egyptian212 1.1% Scottish156 0.8% Scotch-Irish133 0.7% Slovak117 0.6% Turkish109 0.6% Dutch94 0.5% Swedish81 0.4% Lithuanian77 0.4% Jamaican68 0.4% French Canadian60 0.3% French55 0.3% Pennsylvania German53 0.3% Eastern European45 0.2% Austrian35 0.2% British34 0.2% Yugoslavian32 0.2% Norwegian26 0.1% Welsh25 0.1% Czech24 0.1% Canadian24 0.1% Guyanese24 0.1% Romanian24 0.1% Croatian23 0.1% Ethiopian20 0.1% Finnish20 0.1% Nigerian19 0.10% Lebanese17 0.09% Swiss16 0.08% Brazilian5 0.03% African3 0.02% Greek
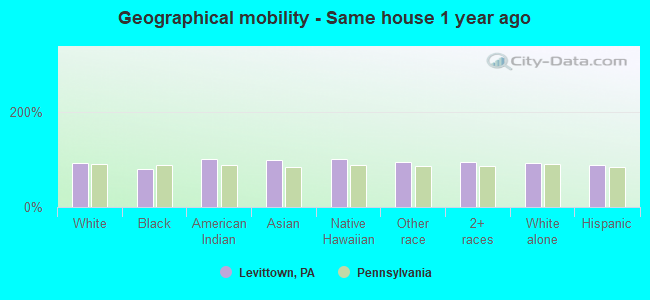
Geographical mobility in Levittown Same house 1 year ago 37,471 92.1% White (Caucasian)1,479 78.9% Black or African American38 99.6% American Indian / Alaska Native1,101 98.0% Asian1 100.0% Native Hawaiian / Pacific Islander2,216 94.4% Other race4,554 93.6% Two or more races36,563 92.5% White alone, not Hispanic / Latino4,628 87.4% Hispanic or LatinoMoved within same county 1,745 4.3% White / Caucasian232 12.4% Black or African American19 1.7% Asian60 2.6% Other race379 7.8% Two or more races1,627 4.1% White alone, not Hispanic / Latino518 9.8% Hispanic or LatinoMoved within same state 828 2.0% White / Caucasian49 2.6% Black or African American89 3.8% Other race737 1.9% White alone, not Hispanic / Latino134 2.5% Hispanic or LatinoMoved from different state 574 1.4% White / Caucasian26 1.4% Black or African American11 0.2% Two or more races539 1.4% White alone, not Hispanic / Latino44 0.8% Hispanic or LatinoMoved from abroad 15 0.0% White67 3.6% Black or African American17 0.0% White alone, not Hispanic / Latino16 0.3% Hispanic or Latino
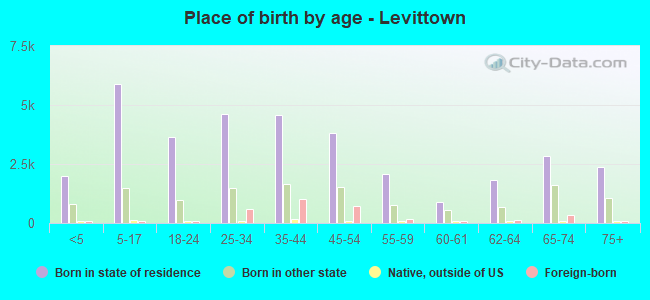
Children Nativity (place of birth) in Levittown
Children under 6 years - Living with two parents Both parents native 1,702 100.0% NativeBoth parents foreign-born 231 95.9% Native10 4.1% Foreign-bornOne native, one foreign-born parent 170 100.0% NativeChildren under 6 years - Living with one parent Native parent 653 100.0% NativeForeign-born parent 50 59.9% Native33 40.1% Foreign-bornChildren 6 to 17 years - Living with two parents Both parents native 3,350 99.6% Native15 0.4% Foreign-bornBoth parents foreign-born 378 95.9% Native16 4.1% Foreign-bornOne native, one foreign-born parent 326 100.0% NativeChildren 6 to 17 years - Living with one parent Native parent 2,222 100.0% NativeForeign-born parent 419 48.7% Native442 51.3% Foreign-born
Grandparents responsible for own grandchildren in Levittown
Grandparents (30 to 59 years) White / Caucasian 239 44.7% Responsible for grandchildren295 55.3% Not responsible for grandchildrenOther race 14 100.0% Not responsible for grandchildrenTwo or more races 48 100.0% Responsible for grandchildrenWhite alone, not Hispanic / Latino 239 48.3% Responsible for grandchildren256 51.7% Not responsible for grandchildrenHispanic or Latino 101 100.0% Not responsible for grandchildrenGrandparents (60 years and over) White / Caucasian 151 16.9% Responsible for grandchildren743 83.1% Not responsible for grandchildrenOther race 31 100.0% Not responsible for grandchildrenTwo or more races 7 100.0% Not responsible for grandchildrenWhite alone, not Hispanic / Latino 151 17.1% Responsible for grandchildren733 82.9% Not responsible for grandchildrenHispanic or Latino 54 100.0% Not responsible for grandchildren