Races in Litchfield, New Hampshire (NH) Detailed Stats
Ancestries, Foreign-born residents, place of birth

Recent posts about races in Litchfield, New Hampshire on our local forum with over 2,400,000 registered users:
 | New Hampshire - Who Puts Voting Ballot in Box ? (25 replies) |
| Londonderry vs Bedford (8 replies) |
| Boston commuter looking into southern NH (42 replies) |
| Litchfield (2 replies) |
| Southern girl moving to NH (10 replies) |
| Any NH towns similar to the Litchfield Hills towns in CT? (5 replies) |
3.8% of Litchfield, NH residents are foreign-born (2.0% born in North America, 0.8% born in Europe, 0.7% born in Africa), which is 33.3% less than the foreign-born rate of 5.0% across the entire state of New Hampshire.
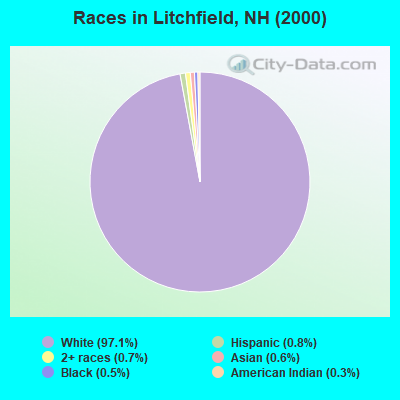
Race distribution in Litchfield

- 7,14797.1%White alone
- 610.8%Hispanic
- 510.7%Two or more races
- 420.6%Asian alone
- 350.5%Black alone
- 210.3%American Indian alone
- 30.04%Other race alone
2000
2022
-
- 1,175,25295.1%White alone
- 20,4891.7%Hispanic
- 15,8031.3%Asian alone
- 11,6060.9%Two or more races
- 8,3540.7%Black alone
- 2,6980.2%American Indian alone
- 1,2540.1%Other race alone
- 3300.03%Native Hawaiian and Other
Pacific Islander alone

-
- 1,208,10186.6%White alone
- 63,4794.5%Hispanic
- 60,7244.4%Two or more races
- 36,5192.6%Asian alone
- 17,9311.3%Black alone
- 6,6150.5%Other race alone
- 1,0140.07%American Indian alone
- 8480.06%Native Hawaiian and Other
Pacific Islander alone

Income and house value in Litchfield
- Median household income in 2022
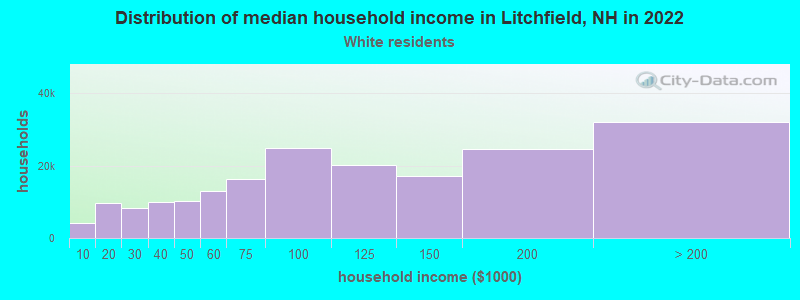
- $132,183White non-Hispanic householders
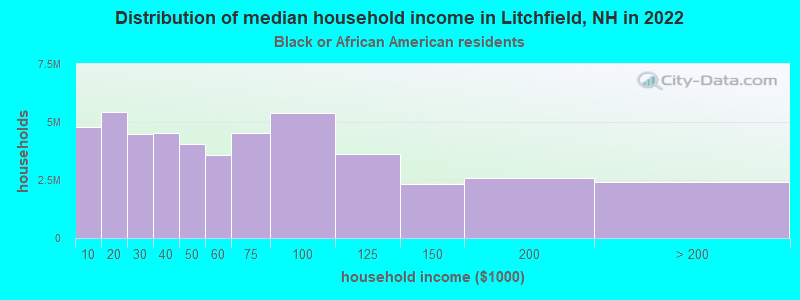
- $134,263Black householders
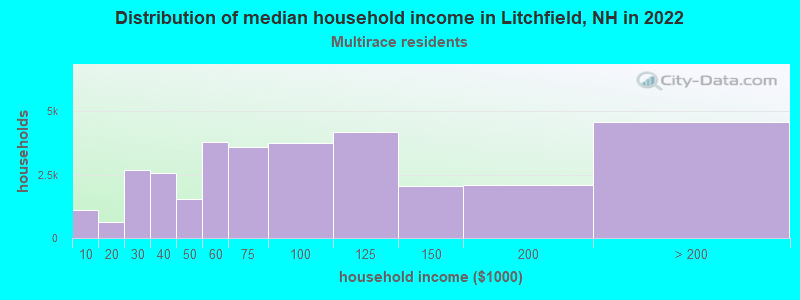
- over $200,000Two or more races householders
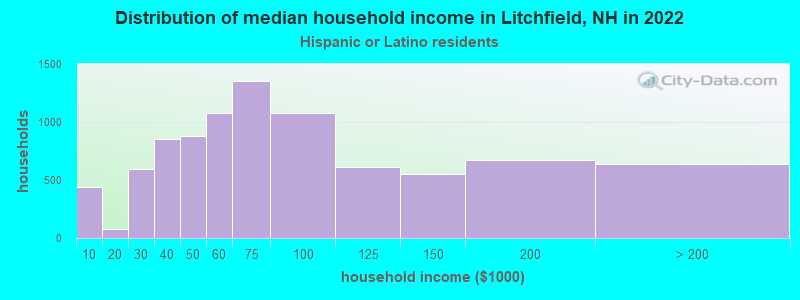
- $59,358Hispanic or Latino race householders
- Median 2022 house value
- $464,640White Non-Hispanic householders
- $537,719Black or African American householders
- $536,516Two or more races householders
- $421,935Hispanic or Latino householders
Household income for White non-Hispanic householders
Household income for Black householders
Household income for Two or more races householders
Household income for Hispanic or Latino race householders
Foreign-born residents in Litchfield
276 residents are foreign born (2.0% North America, 0.8% Europe, 0.7% Africa).
| This city: | 3.8% |
| New Hampshire: | 4.4% |
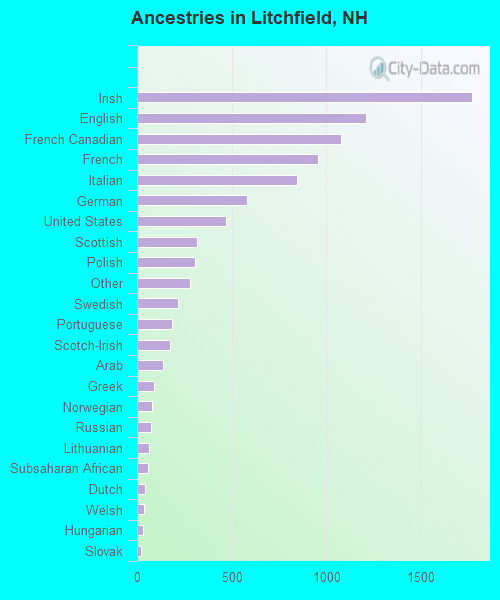
Ancestries in Litchfield

- 1,77219.6%Irish
- 1,20913.4%English
- 1,07711.9%French Canadian
- 95710.6%French
- 8459.3%Italian
- 5826.4%German
- 4705.2%United States
- 3173.5%Scottish
- 3053.4%Polish
- 2803.1%Other
- 2172.4%Swedish
- 1832.0%Portuguese
- 1761.9%Scotch-Irish
- 1381.5%Arab
- 881.0%Greek
- 770.9%Norwegian
- 720.8%Russian
- 630.7%Lithuanian
- 570.6%Subsaharan African
- 430.5%Dutch
- 360.4%Welsh
- 320.4%Hungarian
- 200.2%Slovak
- 120.1%Swiss
- 110.1%Czech
- 80.09%Danish
Zip codes: 03052.