Races in Livermore, Maine (ME) Detailed Stats
Ancestries, Foreign-born residents, place of birth

Recent posts about races in Livermore, Maine on our local forum with over 2,400,000 registered users:
 | Does Dixfield pass the smell test? (8 replies) |
| Possible move to Androscoggin County (5 replies) |
| State Highways and Snow Treatment (9 replies) |
| Calais (11 replies) |
| Moving to Maine - cost of well and septic inspections (10 replies) |
0.7% of Livermore, ME residents are foreign-born , which is 321.2% less than the foreign-born rate of 3.0% across the entire state of Maine.
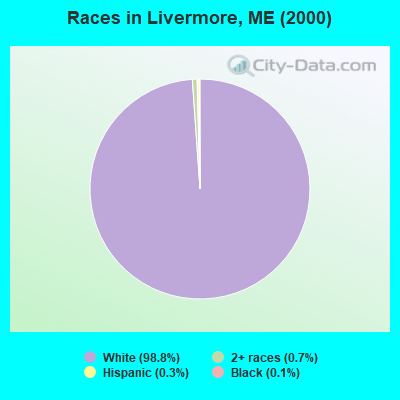
Race distribution in Livermore

- 2,08198.8%White alone
- 140.7%Two or more races
- 70.3%Hispanic
- 30.1%Black alone
- 10.05%American Indian alone
2000
2022
-
- 1,230,29796.5%White alone
- 11,7310.9%Two or more races
- 9,3600.7%Hispanic
- 9,0140.7%Asian alone
- 6,4400.5%Black alone
- 6,9110.5%American Indian alone
- 8360.07%Other race alone
- 3340.03%Native Hawaiian and Other
Pacific Islander alone

-
- 1,249,23390.2%White alone
- 58,3574.2%Two or more races
- 28,7172.1%Hispanic
- 21,5831.6%Black alone
- 16,1511.2%Asian alone
- 5,8730.4%Other race alone
- 5,2050.4%American Indian alone
- 2210.02%Native Hawaiian and Other
Pacific Islander alone

Income and house value in Livermore
- Median household income in 2022
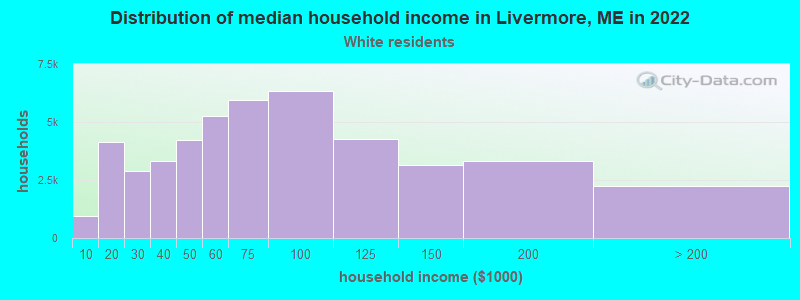
- $73,238White non-Hispanic householders
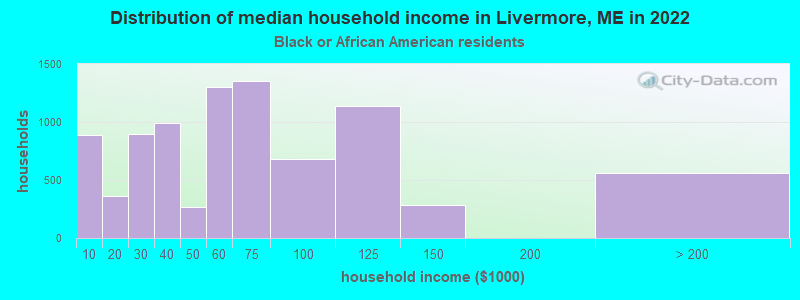
- $36,717Black householders
- $28,468Two or more races householders
- $11,473Hispanic or Latino race householders
- Median 2022 house value
- $234,855White Non-Hispanic householders
- $271,756Hispanic or Latino householders
Household income for White non-Hispanic householders
Household income for Black householders
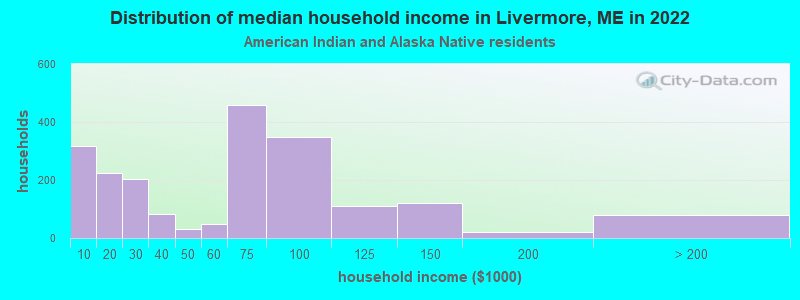
Household income for American Indian and Alaska Native householders
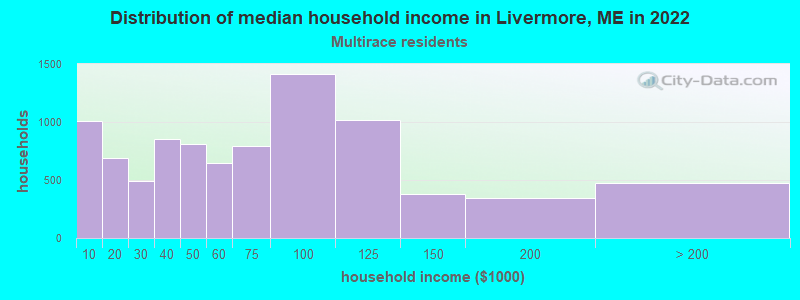
Household income for Two or more races householders
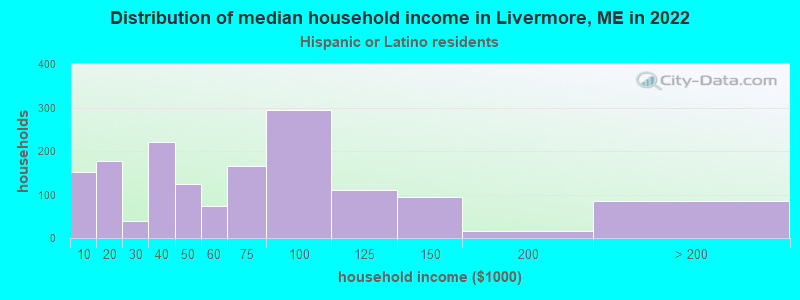
Household income for Hispanic or Latino race householders
Foreign-born residents in Livermore
15 residents are foreign born
| This city: | 0.7% |
| Maine: | 2.9% |
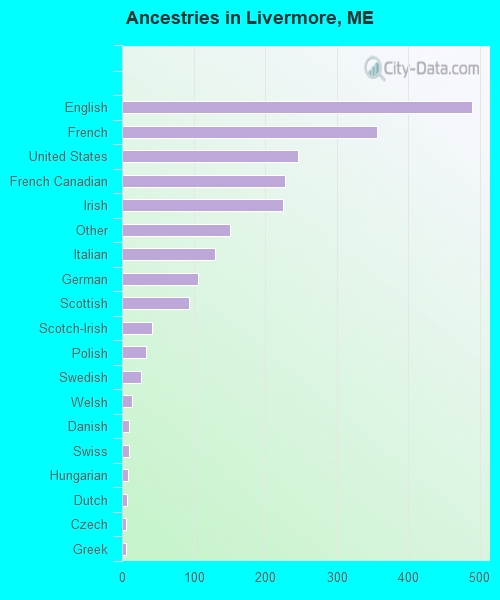
Ancestries in Livermore

- 48822.3%English
- 35616.3%French
- 24611.2%United States
- 22710.4%French Canadian
- 22510.3%Irish
- 1516.9%Other
- 1305.9%Italian
- 1064.8%German
- 934.2%Scottish
- 421.9%Scotch-Irish
- 341.6%Polish
- 271.2%Swedish
- 140.6%Welsh
- 100.5%Danish
- 100.5%Swiss
- 90.4%Hungarian
- 70.3%Dutch
- 50.2%Czech
- 50.2%Greek
- 40.2%Portuguese
Zip codes: 04253.