Races in Lockhart, Texas (TX) Detailed Stats
Data:
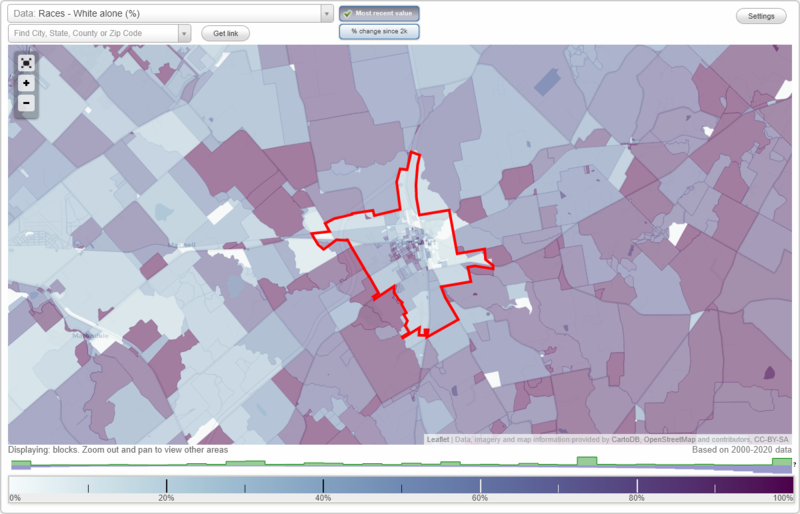
Races - White alone (%)
Races - White alone (% change since 2000)
Races - Black alone (%)
Races - Black alone (% change since 2000)
Races - American Indian alone (%)
Races - American Indian alone (% change since 2000)
Races - Asian alone (%)
Races - Asian alone (% change since 2000)
Races - Hispanic (%)
Races - Hispanic (% change since 2000)
Races - Native Hawaiian and Other Pacific Islander alone (%)
Races - Native Hawaiian and Other Pacific Islander alone (% change since 2000)
Races - Two or more races(%)
Races - Two or more races(% change since 2000)
Races - Other race alone (%)
Races - Other race alone (% change since 2000)
Racial diversity
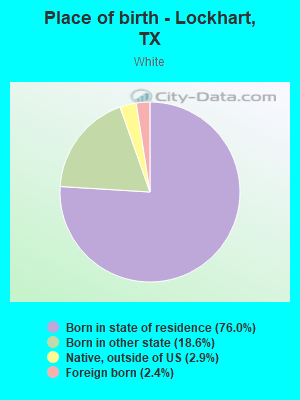
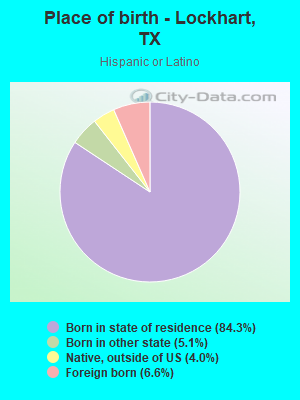
Place of birth - Born in state of residence (%)
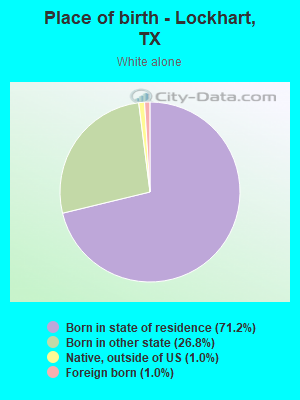
Place of birth - Born in state of residence (%) - White
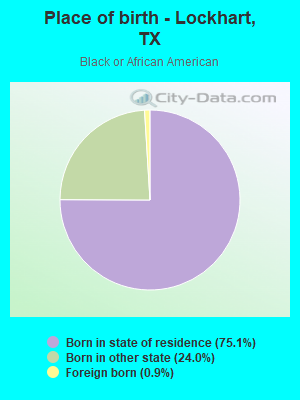
Place of birth - Born in state of residence (%) - Black or African American
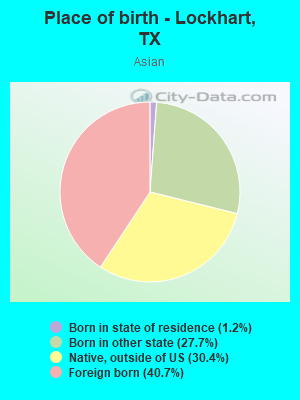
Place of birth - Born in state of residence (%) - Asian
Place of birth - Born in state of residence (%) - Hispanic or Latino
Place of birth - Born in state of residence (%) - American Indian and Alaska Native
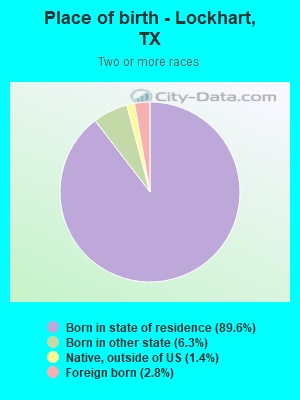
Place of birth - Born in state of residence (%) - Multirace
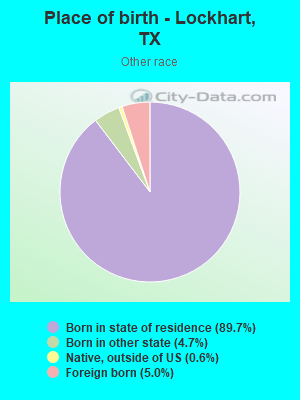
Place of birth - Born in state of residence (%) - Other Race
Place of birth - Born in other state (%)
Place of birth - Born in other state (%) - White
Place of birth - Born in other state (%) - Black or African American
Place of birth - Born in other state (%) - Asian
Place of birth - Born in other state (%) - Hispanic or Latino
Place of birth - Born in other state (%) - American Indian and Alaska Native
Place of birth - Born in other state (%) - Multirace
Place of birth - Born in other state (%) - Other Race
Place of birth - Native, outside of US (%)
Place of birth - Native, outside of US (%) - White
Place of birth - Native, outside of US (%) - Black or African American
Place of birth - Native, outside of US (%) - Asian
Place of birth - Native, outside of US (%) - Hispanic or Latino
Place of birth - Native, outside of US (%) - American Indian and Alaska Native
Place of birth - Native, outside of US (%) - Multirace
Place of birth - Native, outside of US (%) - Other Race
Place of birth - Foreign born (%)
Place of birth - Foreign born (%) - White
Place of birth - Foreign born (%) - Black or African American
Place of birth - Foreign born (%) - Asian
Place of birth - Foreign born (%) - Hispanic or Latino
Place of birth - Foreign born (%) - American Indian and Alaska Native
Place of birth - Foreign born (%) - Multirace
Place of birth - Foreign born (%) - Other Race
Residents speaking English at home (%)
Residents speaking English at home - Born in the United States (%)
Residents speaking English at home - Native, born elsewhere (%)
Residents speaking English at home - Foreign born (%)
Residents speaking Spanish at home (%)
Residents speaking Spanish at home - Born in the United States (%)
Residents speaking Spanish at home - Native, born elsewhere (%)
Residents speaking Spanish at home - Foreign born (%)
Residents speaking other language at home (%)
Residents speaking other language at home - Born in the United States (%)
Residents speaking other language at home - Native, born elsewhere (%)
Residents speaking other language at home - Foreign born (%)
Marital status - Never married (%)
Marital status - Now married (%)
Marital status - Separated (%)
Marital status - Widowed (%)
Marital status - Divorced (%)
Ancestries Reported - Arab (%)
Ancestries Reported - Czech (%)
Ancestries Reported - Danish (%)
Ancestries Reported - Dutch (%)
Ancestries Reported - English (%)
Ancestries Reported - French (%)
Ancestries Reported - French Canadian (%)
Ancestries Reported - German (%)
Ancestries Reported - Greek (%)
Ancestries Reported - Hungarian (%)
Ancestries Reported - Irish (%)
Ancestries Reported - Italian (%)
Ancestries Reported - Lithuanian (%)
Ancestries Reported - Norwegian (%)
Ancestries Reported - Polish (%)
Ancestries Reported - Portuguese (%)
Ancestries Reported - Russian (%)
Ancestries Reported - Scotch-Irish (%)
Ancestries Reported - Scottish (%)
Ancestries Reported - Slovak (%)
Ancestries Reported - Subsaharan African (%)
Ancestries Reported - Swedish (%)
Ancestries Reported - Swiss (%)
Ancestries Reported - Ukrainian (%)
Ancestries Reported - United States (%)
Ancestries Reported - Welsh (%)
Ancestries Reported - West Indian (%)
Ancestries Reported - Other (%)
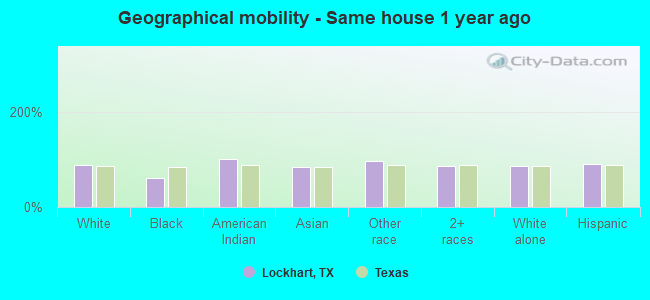
Geographical mobility - Same house 1 year ago (%)
Geographical mobility - Same house 1 year ago (%) - White
Geographical mobility - Same house 1 year ago (%) - Black or African American
Geographical mobility - Same house 1 year ago (%) - Asian
Geographical mobility - Same house 1 year ago (%) - Hispanic or Latino
Geographical mobility - Same house 1 year ago (%) - American Indian and Alaska Native
Geographical mobility - Same house 1 year ago (%) - Multirace
Geographical mobility - Same house 1 year ago (%) - Other Race
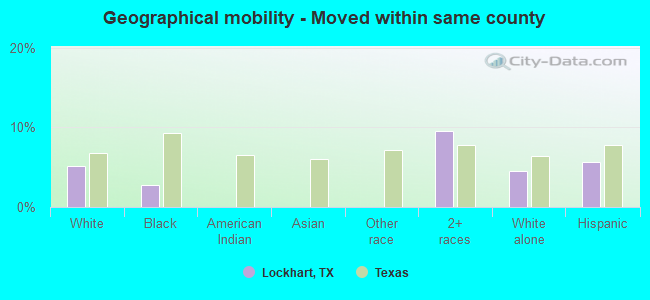
Geographical mobility - Moved within same county (%)
Geographical mobility - Moved within same county (%) - White
Geographical mobility - Moved within same county (%) - Black or African American
Geographical mobility - Moved within same county (%) - Asian
Geographical mobility - Moved within same county (%) - Hispanic or Latino
Geographical mobility - Moved within same county (%) - American Indian and Alaska Native
Geographical mobility - Moved within same county (%) - Multirace
Geographical mobility - Moved within same county (%) - Other Race
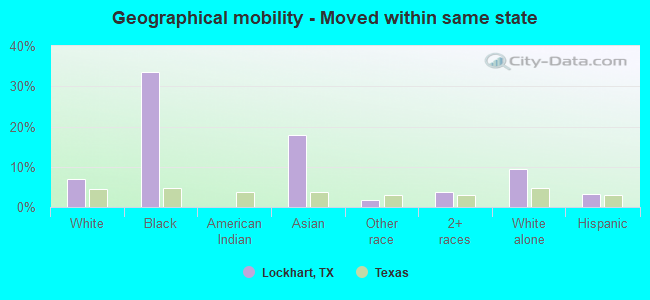
Geographical mobility - Moved from different county within same state (%)
Geographical mobility - Moved from different county within same state (%) - White
Geographical mobility - Moved from different county within same state (%) - Black or African American
Geographical mobility - Moved from different county within same state (%) - Asian
Geographical mobility - Moved from different county within same state (%) - Hispanic or Latino
Geographical mobility - Moved from different county within same state (%) - American Indian and Alaska Native
Geographical mobility - Moved from different county within same state (%) - Multirace
Geographical mobility - Moved from different county within same state (%) - Other Race
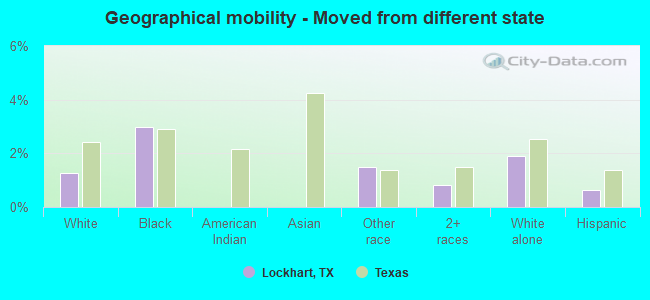
Geographical mobility - Moved from different state (%)
Geographical mobility - Moved from different state (%) - White
Geographical mobility - Moved from different state (%) - Black or African American
Geographical mobility - Moved from different state (%) - Asian
Geographical mobility - Moved from different state (%) - Hispanic or Latino
Geographical mobility - Moved from different state (%) - American Indian and Alaska Native
Geographical mobility - Moved from different state (%) - Multirace
Geographical mobility - Moved from different state (%) - Other Race
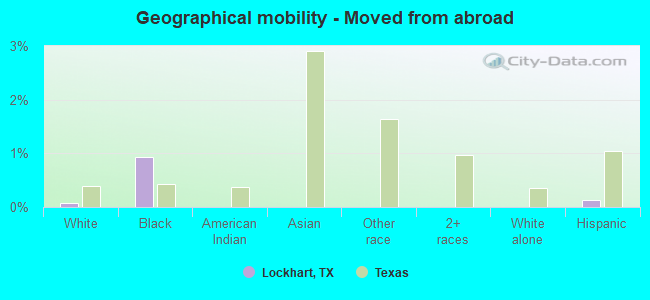
Geographical mobility - Moved from abroad (%)
Geographical mobility - Moved from abroad (%) - White
Geographical mobility - Moved from abroad (%) - Black or African American
Geographical mobility - Moved from abroad (%) - Asian
Geographical mobility - Moved from abroad (%) - Hispanic or Latino
Geographical mobility - Moved from abroad (%) - American Indian and Alaska Native
Geographical mobility - Moved from abroad (%) - Multirace
Geographical mobility - Moved from abroad (%) - Other Race
Place of birth for the foreign-born population - Ireland (%)
Place of birth for the foreign-born population - Denmark (%)
Place of birth for the foreign-born population - Norway (%)
Place of birth for the foreign-born population - Sweden (%)
Place of birth for the foreign-born population - United Kingdom (%)
Place of birth for the foreign-born population - England (%)
Place of birth for the foreign-born population - Scotland (%)
Place of birth for the foreign-born population - Other Northern Europe (%)
Place of birth for the foreign-born population - Austria (%)
Place of birth for the foreign-born population - Belgium (%)
Place of birth for the foreign-born population - France (%)
Place of birth for the foreign-born population - Germany (%)
Place of birth for the foreign-born population - Netherlands (%)
Place of birth for the foreign-born population - Switzerland (%)
Place of birth for the foreign-born population - Other Western Europe (%)
Place of birth for the foreign-born population - Greece (%)
Place of birth for the foreign-born population - Italy (%)
Place of birth for the foreign-born population - Portugal (%)
Place of birth for the foreign-born population - Spain (%)
Place of birth for the foreign-born population - Other Southern Europe (%)
Place of birth for the foreign-born population - Albania (%)
Place of birth for the foreign-born population - Belarus (%)
Place of birth for the foreign-born population - Bosnia and Herzegovina (%)
Place of birth for the foreign-born population - Bulgaria (%)
Place of birth for the foreign-born population - Croatia (%)
Place of birth for the foreign-born population - Czechoslovakia (%)
Place of birth for the foreign-born population - Hungary (%)
Place of birth for the foreign-born population - Latvia (%)
Place of birth for the foreign-born population - Lithuania (%)
Place of birth for the foreign-born population - North Macedonia (Macedonia) (%)
Place of birth for the foreign-born population - Moldova (%)
Place of birth for the foreign-born population - Poland (%)
Place of birth for the foreign-born population - Romania (%)
Place of birth for the foreign-born population - Russia (%)
Place of birth for the foreign-born population - Serbia (%)
Place of birth for the foreign-born population - Ukraine (%)
Place of birth for the foreign-born population - Other Eastern Europe (%)
Place of birth for the foreign-born population - China (%)
Place of birth for the foreign-born population - Hong Kong (%)
Place of birth for the foreign-born population - Taiwan (%)
Place of birth for the foreign-born population - Japan (%)
Place of birth for the foreign-born population - Korea (%)
Place of birth for the foreign-born population - Other Eastern Asia (%)
Place of birth for the foreign-born population - Afghanistan (%)
Place of birth for the foreign-born population - Bangladesh (%)
Place of birth for the foreign-born population - India (%)
Place of birth for the foreign-born population - Iran (%)
Place of birth for the foreign-born population - Kazakhstan (%)
Place of birth for the foreign-born population - Nepal (%)
Place of birth for the foreign-born population - Pakistan (%)
Place of birth for the foreign-born population - Sri Lanka (%)
Place of birth for the foreign-born population - Uzbekistan (%)
Place of birth for the foreign-born population - Other South Central Asia (%)
Place of birth for the foreign-born population - Burma (%)
Place of birth for the foreign-born population - Cambodia (%)
Place of birth for the foreign-born population - Indonesia (%)
Place of birth for the foreign-born population - Laos (%)
Place of birth for the foreign-born population - Malaysia (%)
Place of birth for the foreign-born population - Philippines (%)
Place of birth for the foreign-born population - Singapore (%)
Place of birth for the foreign-born population - Thailand (%)
Place of birth for the foreign-born population - Vietnam (%)
Place of birth for the foreign-born population - Other South Eastern Asia (%)
Place of birth for the foreign-born population - Armenia (%)
Place of birth for the foreign-born population - Iraq (%)
Place of birth for the foreign-born population - Israel (%)
Place of birth for the foreign-born population - Jordan (%)
Place of birth for the foreign-born population - Kuwait (%)
Place of birth for the foreign-born population - Lebanon (%)
Place of birth for the foreign-born population - Saudi Arabia (%)
Place of birth for the foreign-born population - Syria (%)
Place of birth for the foreign-born population - Turkey (%)
Place of birth for the foreign-born population - Yemen (%)
Place of birth for the foreign-born population - Other Western Asia (%)
Place of birth for the foreign-born population - Eritrea (%)
Place of birth for the foreign-born population - Ethiopia (%)
Place of birth for the foreign-born population - Kenya (%)
Place of birth for the foreign-born population - Somalia (%)
Place of birth for the foreign-born population - Uganda (%)
Place of birth for the foreign-born population - Zimbabwe (%)
Place of birth for the foreign-born population - Other Eastern Africa (%)
Place of birth for the foreign-born population - Cameroon (%)
Place of birth for the foreign-born population - Congo (%)
Place of birth for the foreign-born population - Democratic Republic of Congo (Zaire) (%)
Place of birth for the foreign-born population - Other Middle Africa (%)
Place of birth for the foreign-born population - Egypt (%)
Place of birth for the foreign-born population - Morocco (%)
Place of birth for the foreign-born population - Sudan (%)
Place of birth for the foreign-born population - Other Northern Africa (%)
Place of birth for the foreign-born population - South Africa (%)
Place of birth for the foreign-born population - Other Southern Africa (%)
Place of birth for the foreign-born population - Cabo Verde (%)
Place of birth for the foreign-born population - Ghana (%)
Place of birth for the foreign-born population - Liberia (%)
Place of birth for the foreign-born population - Nigeria (%)
Place of birth for the foreign-born population - Senegal (%)
Place of birth for the foreign-born population - Sierra Leone (%)
Place of birth for the foreign-born population - Other Western Africa (%)
Place of birth for the foreign-born population - Australia (%)
Place of birth for the foreign-born population - New Zealand (%)
Place of birth for the foreign-born population - Fiji (%)
Place of birth for the foreign-born population - Micronesia (%)
Place of birth for the foreign-born population - Bahamas (%)
Place of birth for the foreign-born population - Barbados (%)
Place of birth for the foreign-born population - Cuba (%)
Place of birth for the foreign-born population - Dominica (%)
Place of birth for the foreign-born population - Dominican Republic (%)
Place of birth for the foreign-born population - Grenada (%)
Place of birth for the foreign-born population - Haiti (%)
Place of birth for the foreign-born population - Jamaica (%)
Place of birth for the foreign-born population - St. Vincent and the Grenadines (%)
Place of birth for the foreign-born population - Trinidad and Tobago (%)
Place of birth for the foreign-born population - West Indies (%)
Place of birth for the foreign-born population - Other Caribbean (%)
Place of birth for the foreign-born population - Belize (%)
Place of birth for the foreign-born population - Costa Rica (%)
Place of birth for the foreign-born population - El Salvador (%)
Place of birth for the foreign-born population - Guatemala (%)
Place of birth for the foreign-born population - Honduras (%)
Place of birth for the foreign-born population - Mexico (%)
Place of birth for the foreign-born population - Nicaragua (%)
Place of birth for the foreign-born population - Panama (%)
Place of birth for the foreign-born population - Other Central America (%)
Place of birth for the foreign-born population - Argentina (%)
Place of birth for the foreign-born population - Bolivia (%)
Place of birth for the foreign-born population - Brazil (%)
Place of birth for the foreign-born population - Chile (%)
Place of birth for the foreign-born population - Colombia (%)
Place of birth for the foreign-born population - Ecuador (%)
Place of birth for the foreign-born population - Guyana (%)
Place of birth for the foreign-born population - Peru (%)
Place of birth for the foreign-born population - Uruguay (%)
Place of birth for the foreign-born population - Venezuela (%)
Place of birth for the foreign-born population - Other South America (%)
Place of birth for the foreign-born population - Canada (%)
Place of birth for the foreign-born population - Other Northern America (%)
Place of birth for the foreign-born population - Other (%)
Latest news about races in Lockhart, TX collected exclusively by city-data.com from local newspapers, TV, and radio stations
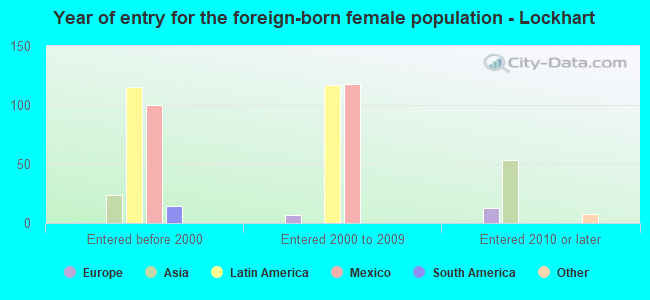
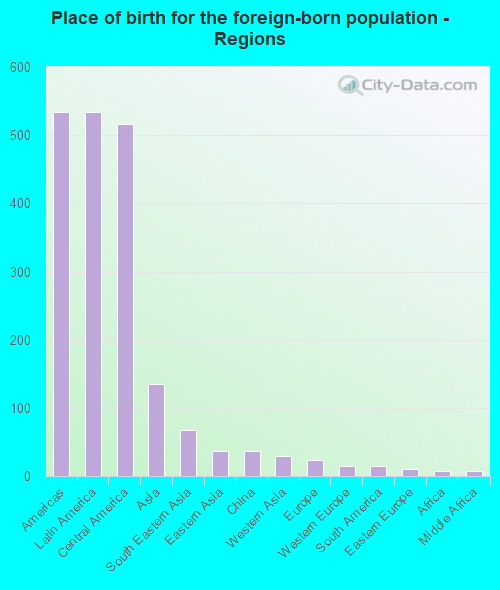
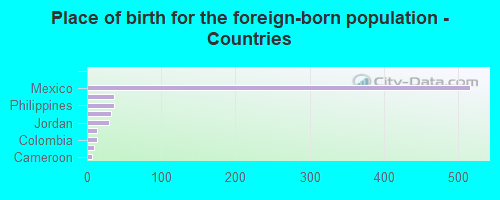
According to 2022 data, the most numerous races in Lockhart, TX are Hispanic (8,108 residents), White alone (5,351 residents), and Black alone (730 residents). 72.7% of Lockhart residents speak English at home. 4.7% of Lockhart, TX residents are foreign-born (3.6% born in Latin America, 0.9% born in Asia), which is 259.7% less than the foreign-born rate of 17.0% across the entire state of Texas.
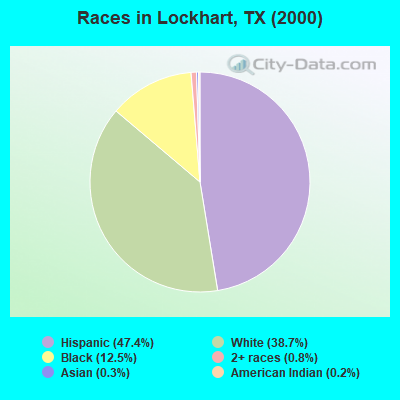
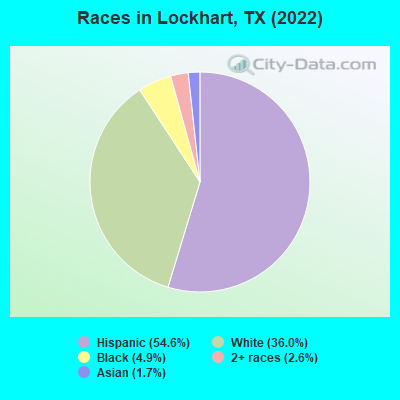
Race distribution in Lockhart
2000 2022
10,933,313 52.4% White alone 6,669,666 32.0% Hispanic 2,364,255 11.3% Black alone 554,445 2.7% Asian alone 230,567 1.1% Two or more races 68,859 0.3% American Indian alone 19,958 0.10% Other race alone 10,757 0.05% Native Hawaiian and Other
12,070,642 40.2% Hispanic 11,683,430 38.9% White alone 3,508,706 11.7% Black alone 1,608,173 5.4% Asian alone 956,560 3.2% Two or more races 125,763 0.4% Other race alone 47,023 0.2% American Indian alone 29,275 0.10% Native Hawaiian and Other
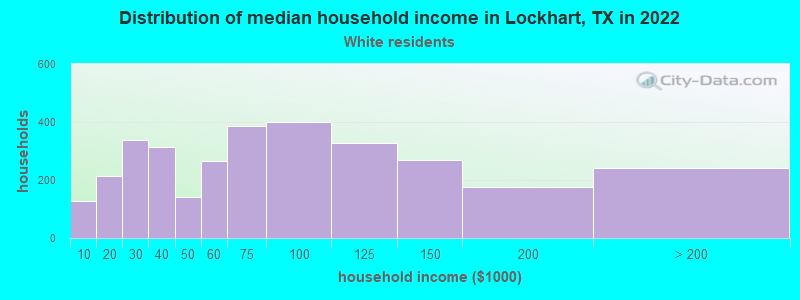
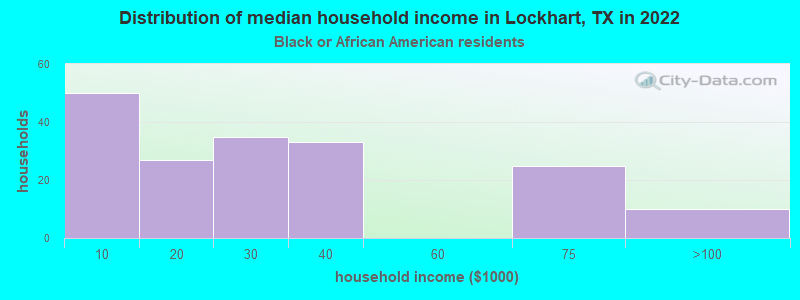
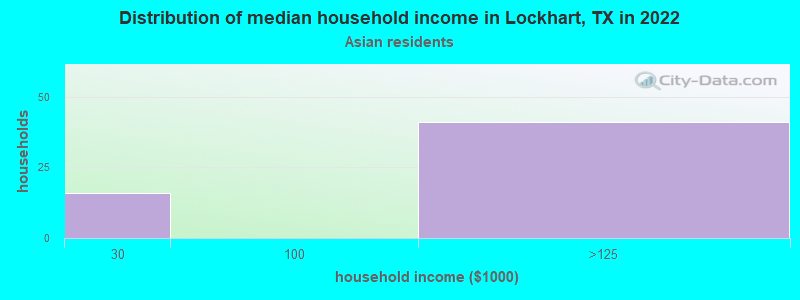
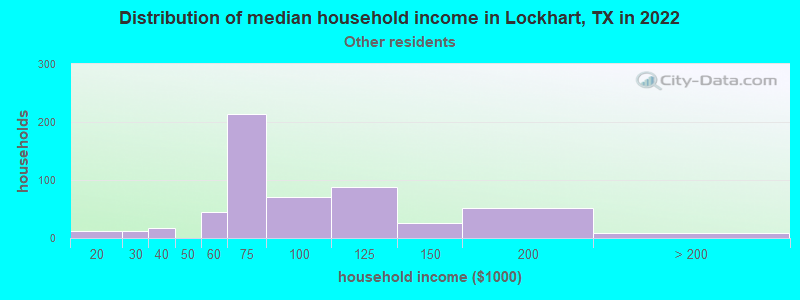
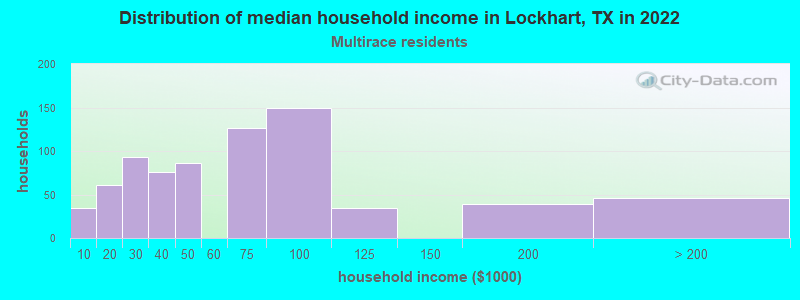
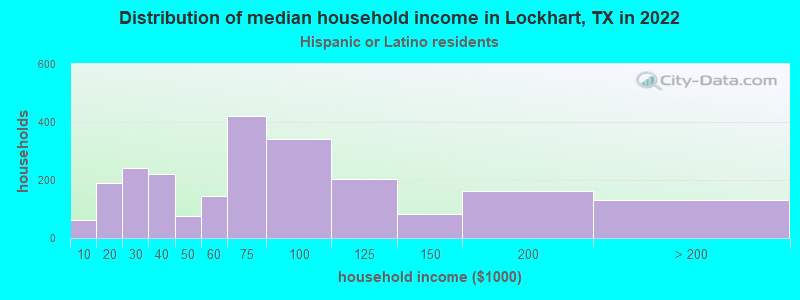
Income and house value in Lockhart Median household income in 2022 $67,609 White non-Hispanic householders$26,160 Black householders$75,082 Some other race householders$62,357 Two or more races householders$70,232 Hispanic or Latino race householdersMedian 2022 house value $294,050 White Non-Hispanic householders$184,612 Black or African American householders$340,951 American Indian or Alaska Native householders$203,573 Some other race householders$170,974 Two or more races householders$197,918 Hispanic or Latino householders
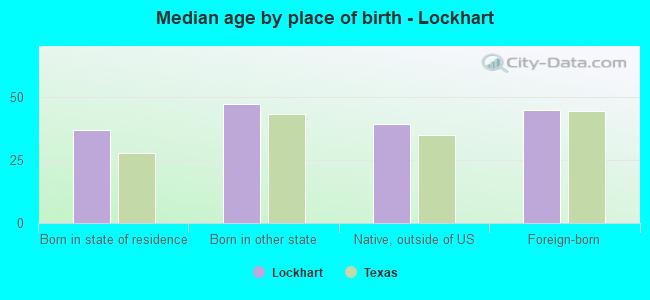
Median age by race in Lockhart
41.9 Median age for White residents42.0 41.8 39.3 Median age for Black or African American residents33.3 42.7 43.8 Median age for American Indian / Alaska Native residents43.4 56.8 45.3 Median age for Asian residents41.4 68.3 -581,560,283.1 Median age for Native Hawaiian / Pacific Islander residents-612,729,233.5 -577,777,777.2 37.4 Median age for Other race residents37.4 37.8 33.3 Median age for Two or more races residents31.5 37.6 48.3 Median age for White alone residents48.8 48.0 33.6 Median age for Hispanic or Latino residents33.3 34.2
Owner/renter occupied households by race in Lockhart
House owners and renters - White residents 2,084 64.5% Owner occupied1,145 35.5% Renter occupiedHouse owners and renters - Black or African American residents 80 45.6% Owner occupied96 54.4% Renter occupiedHouse owners and renters - American Indian / Alaska Native residents 21 100.0% Owner occupiedHouse owners and renters - Asian residents 57 100.0% Renter occupiedHouse owners and renters - Other race residents 394 72.6% Owner occupied148 27.4% Renter occupiedHouse owners and renters - Two or more races residents 382 51.5% Owner occupied360 48.5% Renter occupiedHouse owners and renters - White alone residents 1,583 66.0% Owner occupied814 34.0% Renter occupiedHouse owners and renters - Hispanic or Latino residents 1,349 59.5% Owner occupied920 40.5% Renter occupied
Language usage in Lockhart
English speakers - Total 72.7% of residents of Lockhart speak English at home.
26.1% of residents speak Spanish at home 2,505 67.0% Speak English very well1,233 33.0% Speak English less than very well1.0% of residents speak other language at home 130 94.9% Speak English very well7 5.1% Speak English less than very well
English speakers - Born in the United States 91.9% of residents of Lockhart speak English at home.
6.8% of residents speak Spanish at home 144 100.0% Speak English very well1.2% of residents speak other language at home 25 100.0% Speak English very well
English speakers - Native, born elsewhere 34.9% of residents of Lockhart speak English at home.
61.8% of residents speak Spanish at home 89 31.8% Speak English very well191 68.2% Speak English less than very well
English speakers - Foreign-born 15.2% of residents of Lockhart speak English at home.
69.8% of residents speak Spanish at home 142 29.0% Speak English very well348 71.0% Speak English less than very well14.8% of residents speak other language at home 97 93.3% Speak English very well7 6.7% Speak English less than very well
White (Caucasian) - Speak only English Native:
85.6% (7,202)Foreign-born:
2.7% (6)
White (Caucasian) - Speak another language Native:
12.5% (1,050)Foreign-born:
86.9% (182)
Asian - Speak only English Native:
51.3% (79)Foreign-born:
59.8% (65)
Asian - Speak another language Native:
48.7% (75)Foreign-born:
42.0% (46)
Other race - Speak only English Native:
63.6% (1,020)Foreign-born:
20.5% (18)
Other race - Speak another language Native:
38.3% (614)Foreign-born:
80.7% (72)
Two or more races - Speak only English Native:
59.2% (1,489)Foreign-born:
50.7% (39)
Two or more races - Speak another language Native:
39.1% (983)Foreign-born:
46.8% (36)
White alone - Speak only English Native:
98.6% (5,090)Foreign-born:
13.2% (7)
White alone - Speak another language Native:
1.5% (75)Foreign-born:
86.6% (44)
Hispanic or Latino - Speak only English Native:
57.6% (4,215)Foreign-born:
7.7% (41)
Hispanic or Latino - Speak another language Native:
42.9% (3,143)Foreign-born:
92.4% (492)
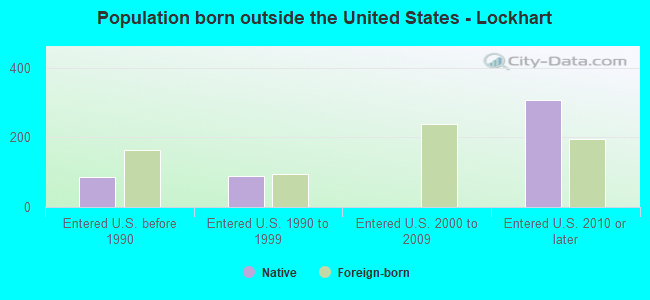
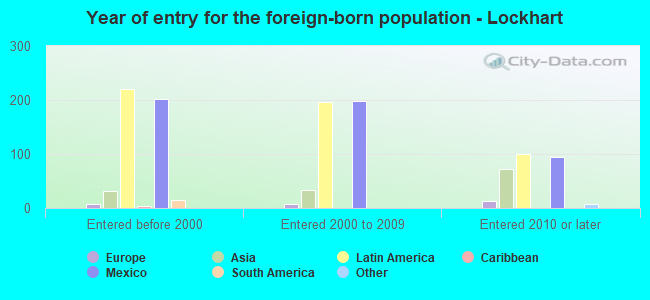
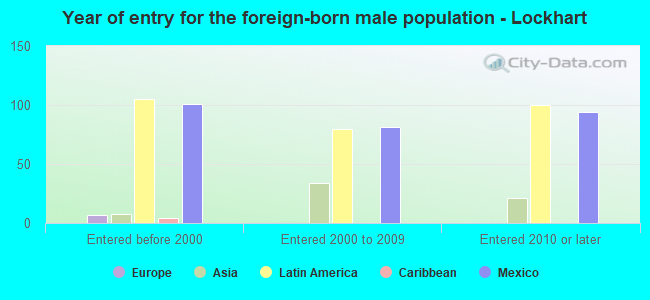
Foreign-born residents in Lockhart 702 residents are foreign born (3.6% Latin America , 0.9% Asia ).
This city:
4.7%Texas:
17.1%
Marital status for residents in Lockhart Marital status - White (Caucasian) population 15 years and over
Males 29.7% Never married57.4% Now married2.2% Separated1.4% Widowed9.2% DivorcedFemales 28.7% Never married44.8% Now married3.0% Separated12.1% Widowed11.3% DivorcedWomen who gave birth in the past 12 months Now married:
63.2% (64)Unmarried:
36.8% (37)
Women who did not give birth in the past 12 months Now married:
44.5% (960)Unmarried:
55.5% (1,197)
Marital status - Black or African American population 15 years and over
Males 22.8% Never married20.6% Now married7.4% Separated0.0% Widowed49.3% DivorcedFemales 51.5% Never married11.7% Now married5.4% Separated22.3% Widowed9.0% DivorcedWomen who gave birth in the past 12 months Now married:
0.0% (0)Unmarried:
100.0% (12)
Women who did not give birth in the past 12 months Now married:
15.4% (49)Unmarried:
84.6% (266)
Marital status - American Indian / Alaska Native population 15 years and over
Males 57.6% Never married42.4% Now married0.0% Separated0.0% Widowed0.0% DivorcedFemales 41.0% Never married59.0% Now married0.0% Separated0.0% Widowed0.0% DivorcedWomen who did not give birth in the past 12 months Now married:
0.0% (0)Unmarried:
100.0% (23)
Marital status - Asian population 15 years and over
Males 100.0% Never married0.0% Now married0.0% Separated0.0% Widowed0.0% DivorcedFemales 2.8% Never married59.4% Now married0.0% Separated16.0% Widowed21.7% DivorcedWomen who did not give birth in the past 12 months Now married:
38.1% (17)Unmarried:
61.9% (28)
Marital status - Other race population 15 years and over
Males 51.4% Never married40.4% Now married0.7% Separated3.8% Widowed3.8% DivorcedFemales 40.6% Never married40.4% Now married0.7% Separated10.9% Widowed7.2% DivorcedWomen who did not give birth in the past 12 months Now married:
38.9% (157)Unmarried:
61.1% (246)
Marital status - Two or more races population 15 years and over
Males 45.6% Never married38.7% Now married6.0% Separated1.5% Widowed8.3% DivorcedFemales 48.1% Never married12.1% Now married4.3% Separated4.8% Widowed30.7% DivorcedWomen who gave birth in the past 12 months Now married:
100.0% (21)Unmarried:
0.0% (0)
Women who did not give birth in the past 12 months Now married:
10.4% (73)Unmarried:
89.6% (633)
Marital status - White alone, not Hispanic / Latino population 15 years and over
Males 26.4% Never married57.8% Now married2.1% Separated2.7% Widowed11.0% DivorcedFemales 27.6% Never married44.5% Now married2.3% Separated14.2% Widowed11.4% DivorcedWomen who gave birth in the past 12 months Now married:
61.6% (53)Unmarried:
38.4% (33)
Women who did not give birth in the past 12 months Now married:
39.9% (534)Unmarried:
60.1% (803)
Marital status - Hispanic or Latino population 15 years and over
Males 40.4% Never married48.9% Now married2.9% Separated1.1% Widowed6.7% DivorcedFemales 36.4% Never married38.2% Now married3.5% Separated8.5% Widowed13.5% DivorcedWomen who gave birth in the past 12 months Now married:
75.0% (41)Unmarried:
25.0% (14)
Women who did not give birth in the past 12 months Now married:
39.7% (840)Unmarried:
60.3% (1,277)
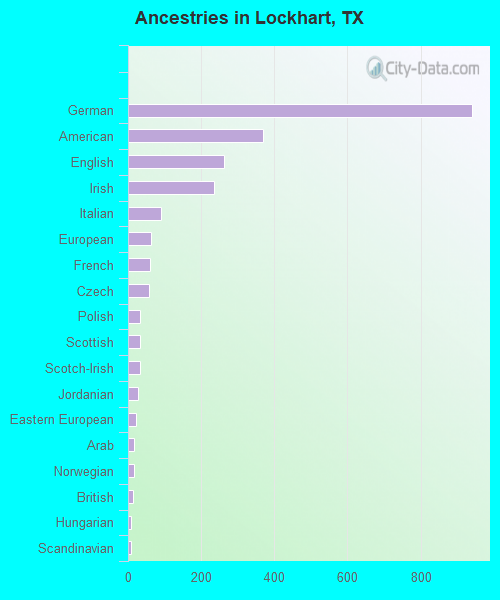
Ancestries in Lockhart
940 10.0% German368 3.9% American262 2.8% English235 2.5% Irish91 1.0% Italian62 0.7% European61 0.6% French57 0.6% Czech34 0.4% Polish33 0.4% Scottish32 0.3% Scotch-Irish28 0.3% Jordanian21 0.2% Eastern European17 0.2% Arab16 0.2% Norwegian15 0.2% British9 0.10% Hungarian9 0.10% Scandinavian7 0.07% Dutch7 0.07% Finnish6 0.06% African6 0.06% Welsh4 0.04% Pennsylvania German1 0.01% Portuguese
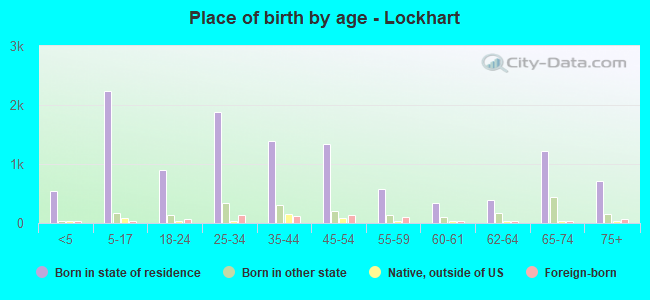
Children Nativity (place of birth) in Lockhart
Children under 6 years - Living with two parents Both parents native 586 100.0% NativeOne native, one foreign-born parent 29 100.0% NativeChildren under 6 years - Living with one parent Native parent 197 100.0% NativeForeign-born parent 35 100.0% NativeChildren 6 to 17 years - Living with two parents Both parents native 1,050 96.4% Native39 3.6% Foreign-bornBoth parents foreign-born 91 100.0% NativeOne native, one foreign-born parent 158 100.0% NativeChildren 6 to 17 years - Living with one parent Native parent 790 100.0% NativeForeign-born parent 21 50.5% Native20 49.5% Foreign-born
Grandparents responsible for own grandchildren in Lockhart
Grandparents (30 to 59 years) White / Caucasian 51 27.6% Responsible for grandchildren133 72.4% Not responsible for grandchildrenAmerican Indian / Alaska Native 51 100.0% Responsible for grandchildrenTwo or more races 25 100.0% Responsible for grandchildrenWhite alone, not Hispanic / Latino 12 15.3% Responsible for grandchildren69 84.7% Not responsible for grandchildrenHispanic or Latino 102 42.8% Responsible for grandchildren136 57.2% Not responsible for grandchildrenGrandparents (60 years and over) White / Caucasian 54 35.7% Responsible for grandchildren97 64.3% Not responsible for grandchildrenTwo or more races 31 49.1% Responsible for grandchildren32 50.9% Not responsible for grandchildrenWhite alone, not Hispanic / Latino 10 23.9% Responsible for grandchildren32 76.1% Not responsible for grandchildrenHispanic or Latino 77 38.8% Responsible for grandchildren122 61.2% Not responsible for grandchildren