Races in Longwood, Florida (FL) Detailed Stats
Data:
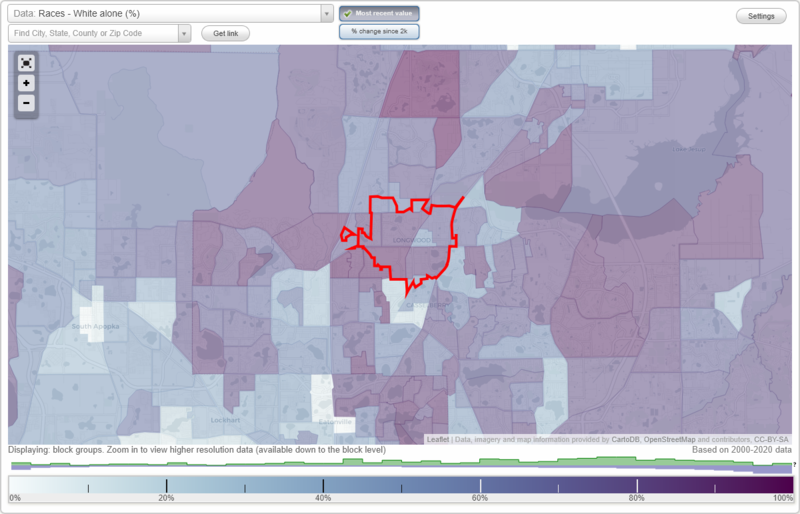
Races - White alone (%)
Races - White alone (% change since 2000)
Races - Black alone (%)
Races - Black alone (% change since 2000)
Races - American Indian alone (%)
Races - American Indian alone (% change since 2000)
Races - Asian alone (%)
Races - Asian alone (% change since 2000)
Races - Hispanic (%)
Races - Hispanic (% change since 2000)
Races - Native Hawaiian and Other Pacific Islander alone (%)
Races - Native Hawaiian and Other Pacific Islander alone (% change since 2000)
Races - Two or more races(%)
Races - Two or more races(% change since 2000)
Races - Other race alone (%)
Races - Other race alone (% change since 2000)
Racial diversity
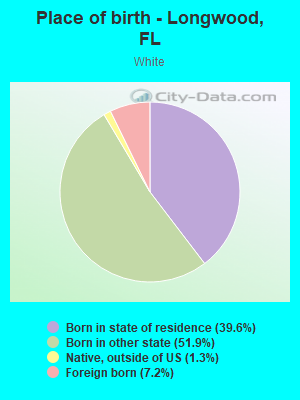
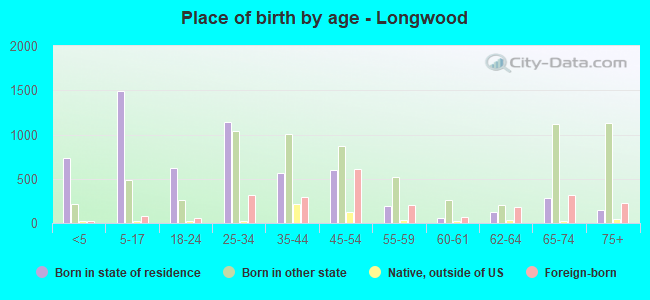
Place of birth - Born in state of residence (%)
Place of birth - Born in state of residence (%) - White
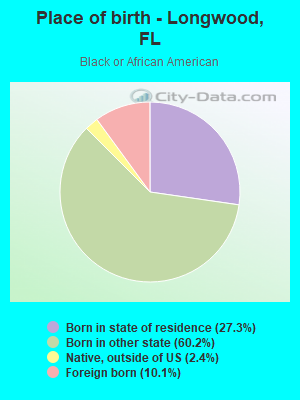
Place of birth - Born in state of residence (%) - Black or African American
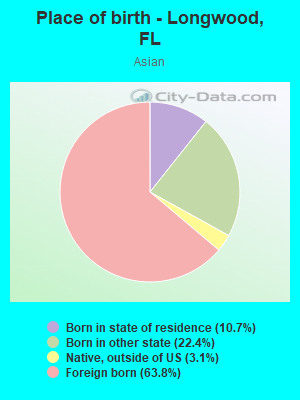
Place of birth - Born in state of residence (%) - Asian
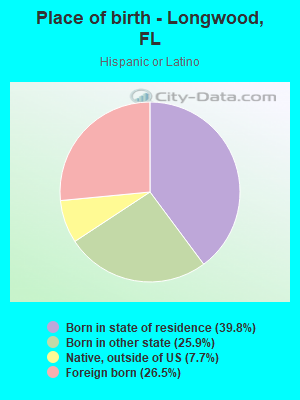
Place of birth - Born in state of residence (%) - Hispanic or Latino
Place of birth - Born in state of residence (%) - American Indian and Alaska Native
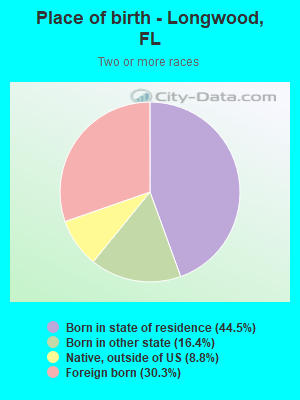
Place of birth - Born in state of residence (%) - Multirace
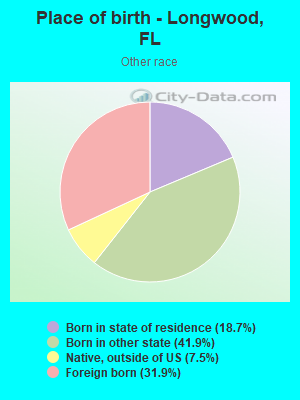
Place of birth - Born in state of residence (%) - Other Race
Place of birth - Born in other state (%)
Place of birth - Born in other state (%) - White
Place of birth - Born in other state (%) - Black or African American
Place of birth - Born in other state (%) - Asian
Place of birth - Born in other state (%) - Hispanic or Latino
Place of birth - Born in other state (%) - American Indian and Alaska Native
Place of birth - Born in other state (%) - Multirace
Place of birth - Born in other state (%) - Other Race
Place of birth - Native, outside of US (%)
Place of birth - Native, outside of US (%) - White
Place of birth - Native, outside of US (%) - Black or African American
Place of birth - Native, outside of US (%) - Asian
Place of birth - Native, outside of US (%) - Hispanic or Latino
Place of birth - Native, outside of US (%) - American Indian and Alaska Native
Place of birth - Native, outside of US (%) - Multirace
Place of birth - Native, outside of US (%) - Other Race
Place of birth - Foreign born (%)
Place of birth - Foreign born (%) - White
Place of birth - Foreign born (%) - Black or African American
Place of birth - Foreign born (%) - Asian
Place of birth - Foreign born (%) - Hispanic or Latino
Place of birth - Foreign born (%) - American Indian and Alaska Native
Place of birth - Foreign born (%) - Multirace
Place of birth - Foreign born (%) - Other Race
Residents speaking English at home (%)
Residents speaking English at home - Born in the United States (%)
Residents speaking English at home - Native, born elsewhere (%)
Residents speaking English at home - Foreign born (%)
Residents speaking Spanish at home (%)
Residents speaking Spanish at home - Born in the United States (%)
Residents speaking Spanish at home - Native, born elsewhere (%)
Residents speaking Spanish at home - Foreign born (%)
Residents speaking other language at home (%)
Residents speaking other language at home - Born in the United States (%)
Residents speaking other language at home - Native, born elsewhere (%)
Residents speaking other language at home - Foreign born (%)
Marital status - Never married (%)
Marital status - Now married (%)
Marital status - Separated (%)
Marital status - Widowed (%)
Marital status - Divorced (%)
Ancestries Reported - Arab (%)
Ancestries Reported - Czech (%)
Ancestries Reported - Danish (%)
Ancestries Reported - Dutch (%)
Ancestries Reported - English (%)
Ancestries Reported - French (%)
Ancestries Reported - French Canadian (%)
Ancestries Reported - German (%)
Ancestries Reported - Greek (%)
Ancestries Reported - Hungarian (%)
Ancestries Reported - Irish (%)
Ancestries Reported - Italian (%)
Ancestries Reported - Lithuanian (%)
Ancestries Reported - Norwegian (%)
Ancestries Reported - Polish (%)
Ancestries Reported - Portuguese (%)
Ancestries Reported - Russian (%)
Ancestries Reported - Scotch-Irish (%)
Ancestries Reported - Scottish (%)
Ancestries Reported - Slovak (%)
Ancestries Reported - Subsaharan African (%)
Ancestries Reported - Swedish (%)
Ancestries Reported - Swiss (%)
Ancestries Reported - Ukrainian (%)
Ancestries Reported - United States (%)
Ancestries Reported - Welsh (%)
Ancestries Reported - West Indian (%)
Ancestries Reported - Other (%)
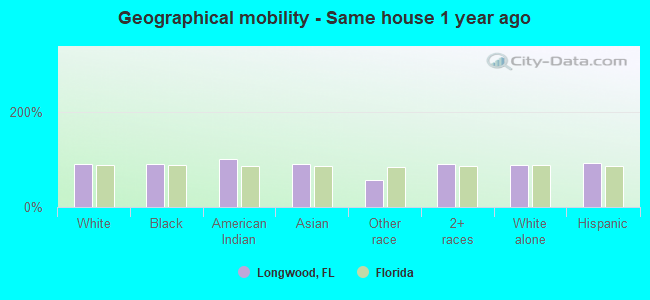
Geographical mobility - Same house 1 year ago (%)
Geographical mobility - Same house 1 year ago (%) - White
Geographical mobility - Same house 1 year ago (%) - Black or African American
Geographical mobility - Same house 1 year ago (%) - Asian
Geographical mobility - Same house 1 year ago (%) - Hispanic or Latino
Geographical mobility - Same house 1 year ago (%) - American Indian and Alaska Native
Geographical mobility - Same house 1 year ago (%) - Multirace
Geographical mobility - Same house 1 year ago (%) - Other Race
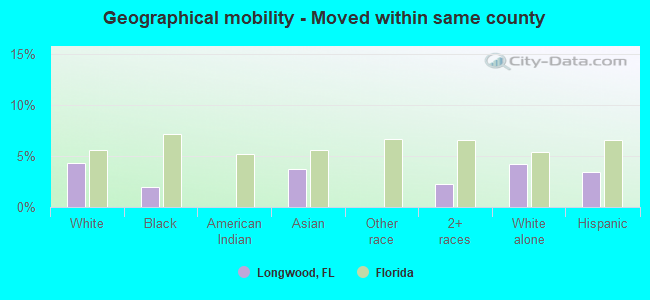
Geographical mobility - Moved within same county (%)
Geographical mobility - Moved within same county (%) - White
Geographical mobility - Moved within same county (%) - Black or African American
Geographical mobility - Moved within same county (%) - Asian
Geographical mobility - Moved within same county (%) - Hispanic or Latino
Geographical mobility - Moved within same county (%) - American Indian and Alaska Native
Geographical mobility - Moved within same county (%) - Multirace
Geographical mobility - Moved within same county (%) - Other Race
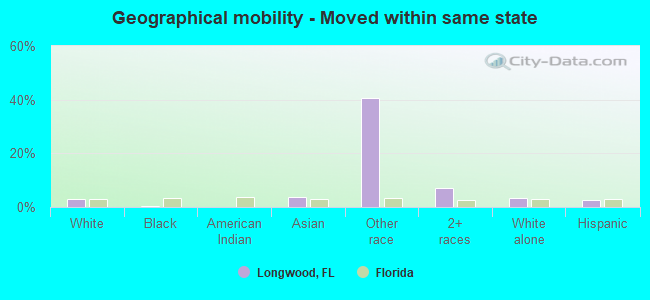
Geographical mobility - Moved from different county within same state (%)
Geographical mobility - Moved from different county within same state (%) - White
Geographical mobility - Moved from different county within same state (%) - Black or African American
Geographical mobility - Moved from different county within same state (%) - Asian
Geographical mobility - Moved from different county within same state (%) - Hispanic or Latino
Geographical mobility - Moved from different county within same state (%) - American Indian and Alaska Native
Geographical mobility - Moved from different county within same state (%) - Multirace
Geographical mobility - Moved from different county within same state (%) - Other Race
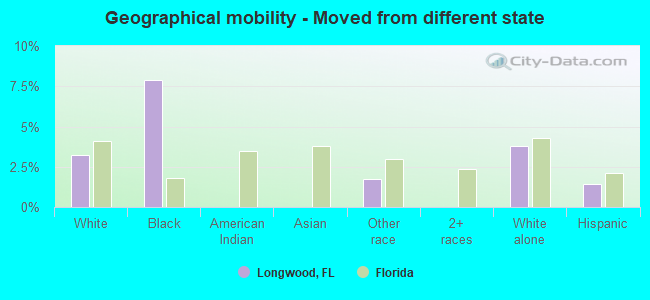
Geographical mobility - Moved from different state (%)
Geographical mobility - Moved from different state (%) - White
Geographical mobility - Moved from different state (%) - Black or African American
Geographical mobility - Moved from different state (%) - Asian
Geographical mobility - Moved from different state (%) - Hispanic or Latino
Geographical mobility - Moved from different state (%) - American Indian and Alaska Native
Geographical mobility - Moved from different state (%) - Multirace
Geographical mobility - Moved from different state (%) - Other Race
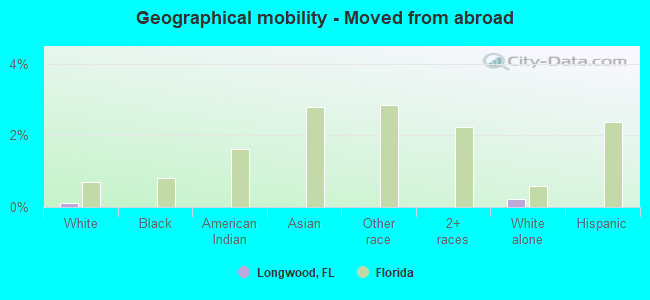
Geographical mobility - Moved from abroad (%)
Geographical mobility - Moved from abroad (%) - White
Geographical mobility - Moved from abroad (%) - Black or African American
Geographical mobility - Moved from abroad (%) - Asian
Geographical mobility - Moved from abroad (%) - Hispanic or Latino
Geographical mobility - Moved from abroad (%) - American Indian and Alaska Native
Geographical mobility - Moved from abroad (%) - Multirace
Geographical mobility - Moved from abroad (%) - Other Race
Place of birth for the foreign-born population - Ireland (%)
Place of birth for the foreign-born population - Denmark (%)
Place of birth for the foreign-born population - Norway (%)
Place of birth for the foreign-born population - Sweden (%)
Place of birth for the foreign-born population - United Kingdom (%)
Place of birth for the foreign-born population - England (%)
Place of birth for the foreign-born population - Scotland (%)
Place of birth for the foreign-born population - Other Northern Europe (%)
Place of birth for the foreign-born population - Austria (%)
Place of birth for the foreign-born population - Belgium (%)
Place of birth for the foreign-born population - France (%)
Place of birth for the foreign-born population - Germany (%)
Place of birth for the foreign-born population - Netherlands (%)
Place of birth for the foreign-born population - Switzerland (%)
Place of birth for the foreign-born population - Other Western Europe (%)
Place of birth for the foreign-born population - Greece (%)
Place of birth for the foreign-born population - Italy (%)
Place of birth for the foreign-born population - Portugal (%)
Place of birth for the foreign-born population - Spain (%)
Place of birth for the foreign-born population - Other Southern Europe (%)
Place of birth for the foreign-born population - Albania (%)
Place of birth for the foreign-born population - Belarus (%)
Place of birth for the foreign-born population - Bosnia and Herzegovina (%)
Place of birth for the foreign-born population - Bulgaria (%)
Place of birth for the foreign-born population - Croatia (%)
Place of birth for the foreign-born population - Czechoslovakia (%)
Place of birth for the foreign-born population - Hungary (%)
Place of birth for the foreign-born population - Latvia (%)
Place of birth for the foreign-born population - Lithuania (%)
Place of birth for the foreign-born population - North Macedonia (Macedonia) (%)
Place of birth for the foreign-born population - Moldova (%)
Place of birth for the foreign-born population - Poland (%)
Place of birth for the foreign-born population - Romania (%)
Place of birth for the foreign-born population - Russia (%)
Place of birth for the foreign-born population - Serbia (%)
Place of birth for the foreign-born population - Ukraine (%)
Place of birth for the foreign-born population - Other Eastern Europe (%)
Place of birth for the foreign-born population - China (%)
Place of birth for the foreign-born population - Hong Kong (%)
Place of birth for the foreign-born population - Taiwan (%)
Place of birth for the foreign-born population - Japan (%)
Place of birth for the foreign-born population - Korea (%)
Place of birth for the foreign-born population - Other Eastern Asia (%)
Place of birth for the foreign-born population - Afghanistan (%)
Place of birth for the foreign-born population - Bangladesh (%)
Place of birth for the foreign-born population - India (%)
Place of birth for the foreign-born population - Iran (%)
Place of birth for the foreign-born population - Kazakhstan (%)
Place of birth for the foreign-born population - Nepal (%)
Place of birth for the foreign-born population - Pakistan (%)
Place of birth for the foreign-born population - Sri Lanka (%)
Place of birth for the foreign-born population - Uzbekistan (%)
Place of birth for the foreign-born population - Other South Central Asia (%)
Place of birth for the foreign-born population - Burma (%)
Place of birth for the foreign-born population - Cambodia (%)
Place of birth for the foreign-born population - Indonesia (%)
Place of birth for the foreign-born population - Laos (%)
Place of birth for the foreign-born population - Malaysia (%)
Place of birth for the foreign-born population - Philippines (%)
Place of birth for the foreign-born population - Singapore (%)
Place of birth for the foreign-born population - Thailand (%)
Place of birth for the foreign-born population - Vietnam (%)
Place of birth for the foreign-born population - Other South Eastern Asia (%)
Place of birth for the foreign-born population - Armenia (%)
Place of birth for the foreign-born population - Iraq (%)
Place of birth for the foreign-born population - Israel (%)
Place of birth for the foreign-born population - Jordan (%)
Place of birth for the foreign-born population - Kuwait (%)
Place of birth for the foreign-born population - Lebanon (%)
Place of birth for the foreign-born population - Saudi Arabia (%)
Place of birth for the foreign-born population - Syria (%)
Place of birth for the foreign-born population - Turkey (%)
Place of birth for the foreign-born population - Yemen (%)
Place of birth for the foreign-born population - Other Western Asia (%)
Place of birth for the foreign-born population - Eritrea (%)
Place of birth for the foreign-born population - Ethiopia (%)
Place of birth for the foreign-born population - Kenya (%)
Place of birth for the foreign-born population - Somalia (%)
Place of birth for the foreign-born population - Uganda (%)
Place of birth for the foreign-born population - Zimbabwe (%)
Place of birth for the foreign-born population - Other Eastern Africa (%)
Place of birth for the foreign-born population - Cameroon (%)
Place of birth for the foreign-born population - Congo (%)
Place of birth for the foreign-born population - Democratic Republic of Congo (Zaire) (%)
Place of birth for the foreign-born population - Other Middle Africa (%)
Place of birth for the foreign-born population - Egypt (%)
Place of birth for the foreign-born population - Morocco (%)
Place of birth for the foreign-born population - Sudan (%)
Place of birth for the foreign-born population - Other Northern Africa (%)
Place of birth for the foreign-born population - South Africa (%)
Place of birth for the foreign-born population - Other Southern Africa (%)
Place of birth for the foreign-born population - Cabo Verde (%)
Place of birth for the foreign-born population - Ghana (%)
Place of birth for the foreign-born population - Liberia (%)
Place of birth for the foreign-born population - Nigeria (%)
Place of birth for the foreign-born population - Senegal (%)
Place of birth for the foreign-born population - Sierra Leone (%)
Place of birth for the foreign-born population - Other Western Africa (%)
Place of birth for the foreign-born population - Australia (%)
Place of birth for the foreign-born population - New Zealand (%)
Place of birth for the foreign-born population - Fiji (%)
Place of birth for the foreign-born population - Micronesia (%)
Place of birth for the foreign-born population - Bahamas (%)
Place of birth for the foreign-born population - Barbados (%)
Place of birth for the foreign-born population - Cuba (%)
Place of birth for the foreign-born population - Dominica (%)
Place of birth for the foreign-born population - Dominican Republic (%)
Place of birth for the foreign-born population - Grenada (%)
Place of birth for the foreign-born population - Haiti (%)
Place of birth for the foreign-born population - Jamaica (%)
Place of birth for the foreign-born population - St. Vincent and the Grenadines (%)
Place of birth for the foreign-born population - Trinidad and Tobago (%)
Place of birth for the foreign-born population - West Indies (%)
Place of birth for the foreign-born population - Other Caribbean (%)
Place of birth for the foreign-born population - Belize (%)
Place of birth for the foreign-born population - Costa Rica (%)
Place of birth for the foreign-born population - El Salvador (%)
Place of birth for the foreign-born population - Guatemala (%)
Place of birth for the foreign-born population - Honduras (%)
Place of birth for the foreign-born population - Mexico (%)
Place of birth for the foreign-born population - Nicaragua (%)
Place of birth for the foreign-born population - Panama (%)
Place of birth for the foreign-born population - Other Central America (%)
Place of birth for the foreign-born population - Argentina (%)
Place of birth for the foreign-born population - Bolivia (%)
Place of birth for the foreign-born population - Brazil (%)
Place of birth for the foreign-born population - Chile (%)
Place of birth for the foreign-born population - Colombia (%)
Place of birth for the foreign-born population - Ecuador (%)
Place of birth for the foreign-born population - Guyana (%)
Place of birth for the foreign-born population - Peru (%)
Place of birth for the foreign-born population - Uruguay (%)
Place of birth for the foreign-born population - Venezuela (%)
Place of birth for the foreign-born population - Other South America (%)
Place of birth for the foreign-born population - Canada (%)
Place of birth for the foreign-born population - Other Northern America (%)
Place of birth for the foreign-born population - Other (%)
Latest news about races in Longwood, FL collected exclusively by city-data.com from local newspapers, TV, and radio stations
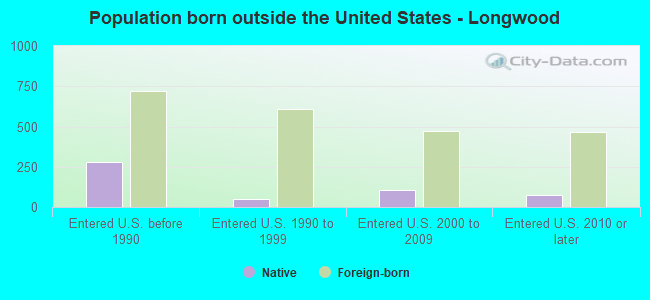
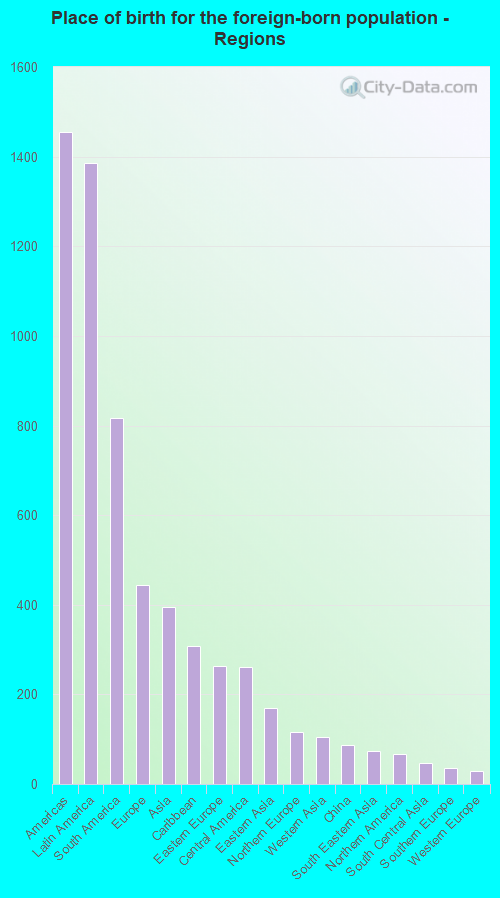
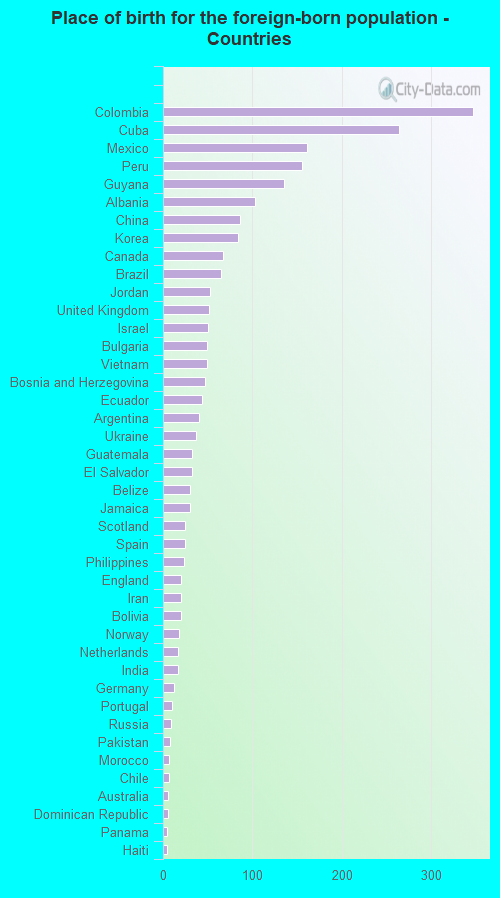
According to 2022 data, the most numerous races in Longwood, FL are White alone (9,051 residents), Hispanic (4,381 residents), and Black alone (999 residents). 80.5% of Longwood residents speak English at home. 14.5% of Longwood, FL residents are foreign-born (8.4% born in Latin America, 2.7% born in Europe, 2.4% born in Asia), which is 44.4% less than the foreign-born rate of 21.0% across the entire state of Florida.
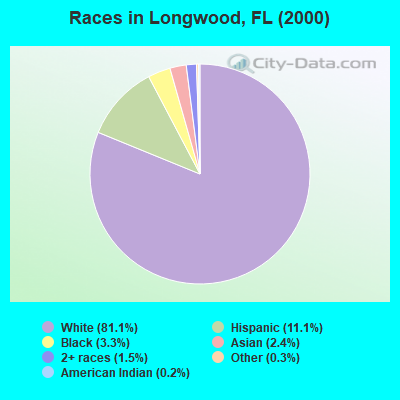
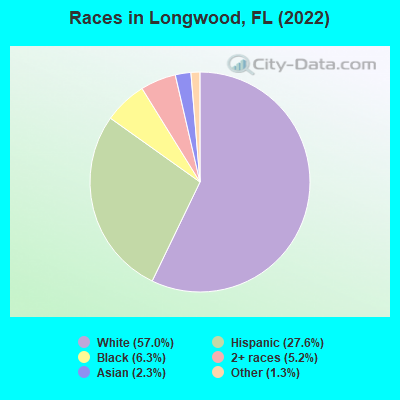
Race distribution in Longwood
2000 2022
10,458,509 65.4% White alone 2,682,715 16.8% Hispanic 2,264,268 14.2% Black alone 261,693 1.6% Asian alone 236,954 1.5% Two or more races 42,358 0.3% American Indian alone 28,994 0.2% Other race alone 6,887 0.04% Native Hawaiian and Other
11,309,403 50.8% White alone 6,025,039 27.1% Hispanic 3,241,015 14.6% Black alone 861,630 3.9% Two or more races 623,692 2.8% Asian alone 152,054 0.7% Other race alone 22,504 0.1% American Indian alone 9,486 0.04% Native Hawaiian and Other
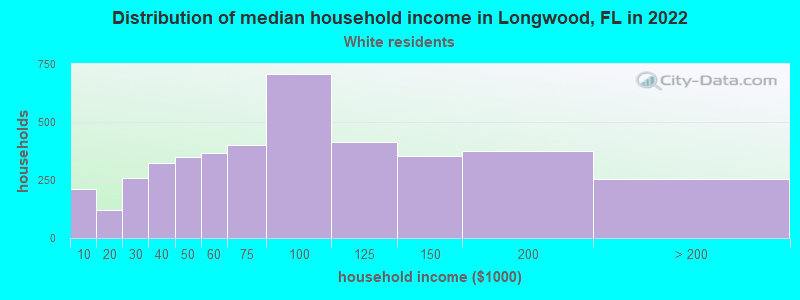
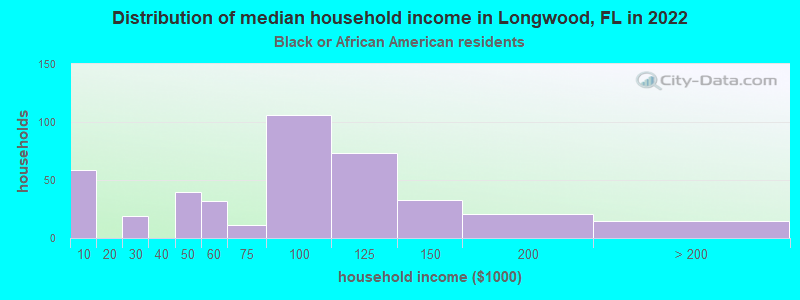
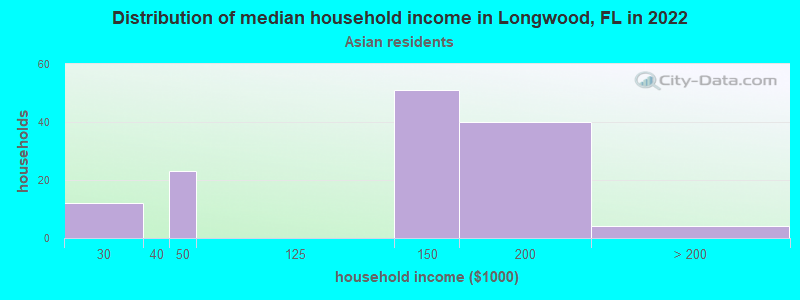
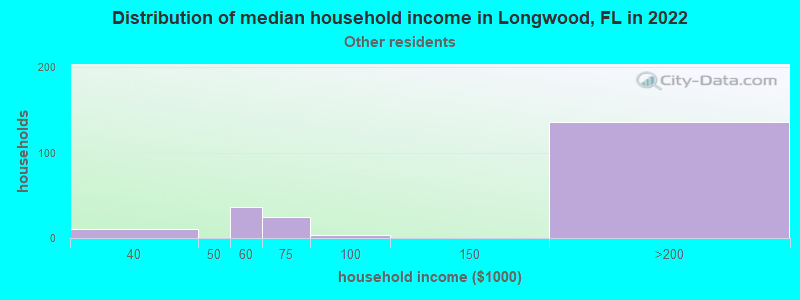
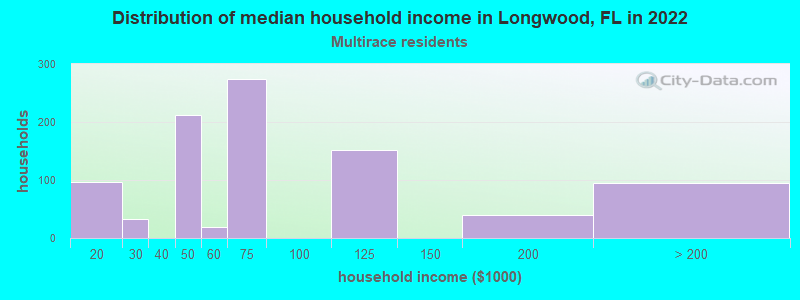
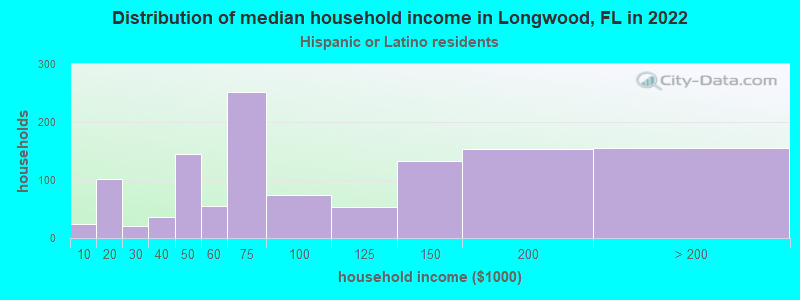
Income and house value in Longwood Median household income in 2022 $76,755 White non-Hispanic householders$96,968 Black householders$131,030 Asian householders$70,159 Two or more races householders$78,806 Hispanic or Latino race householdersMedian 2022 house value $350,079 White Non-Hispanic householders$277,802 Black or African American householders$287,736 American Indian or Alaska Native householders $436,400 Asian householders$306,576 Some other race householders$271,294 Two or more races householders$316,852 Hispanic or Latino householders
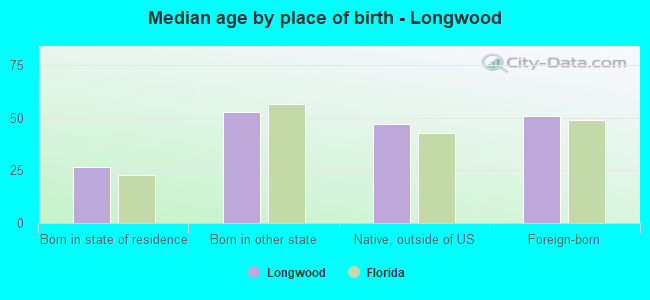
Median age by race in Longwood
46.8 Median age for White residents46.5 47.9 40.6 Median age for Black or African American residents34.5 39.8 -544,061,302.1 Median age for American Indian / Alaska Native residents-541,955,349.7 -503,171,246.9 41.6 Median age for Asian residents32.8 46.5 -679,849,340.2 Median age for Native Hawaiian / Pacific Islander residents-858,307,848.3 -443,298,968.6 59.5 Median age for Other race residents61.3 41.7 27.4 Median age for Two or more races residents35.4 16.3 47.8 Median age for White alone residents45.1 49.0 33.4 Median age for Hispanic or Latino residents39.0 31.3
Owner/renter occupied households by race in Longwood
House owners and renters - White residents 2,995 71.6% Owner occupied1,190 28.4% Renter occupiedHouse owners and renters - Black or African American residents 256 74.6% Owner occupied87 25.4% Renter occupiedHouse owners and renters - American Indian / Alaska Native residents 29 100.0% Owner occupiedHouse owners and renters - Asian residents 133 100.0% Owner occupiedHouse owners and renters - Other race residents 141 89.9% Owner occupied16 10.1% Renter occupiedHouse owners and renters - Two or more races residents 741 69.6% Owner occupied324 30.4% Renter occupiedHouse owners and renters - White alone residents 2,758 69.6% Owner occupied1,207 30.4% Renter occupiedHouse owners and renters - Hispanic or Latino residents 950 76.0% Owner occupied299 24.0% Renter occupied
Language usage in Longwood
English speakers - Total 80.5% of residents of Longwood speak English at home.
13.8% of residents speak Spanish at home 1,407 68.5% Speak English very well646 31.5% Speak English less than very well5.5% of residents speak other language at home 393 47.7% Speak English very well431 52.3% Speak English less than very well
English speakers - Born in the United States 91.0% of residents of Longwood speak English at home.
7.2% of residents speak Spanish at home 477 97.3% Speak English very well13 2.7% Speak English less than very well1.9% of residents speak other language at home 84 65.6% Speak English very well44 34.4% Speak English less than very well
English speakers - Native, born elsewhere 54.8% of residents of Longwood speak English at home.
47.8% of residents speak Spanish at home 174 73.4% Speak English very well63 26.6% Speak English less than very well1.0% of residents speak other language at home 5 100.0% Speak English very well
English speakers - Foreign-born 29.7% of residents of Longwood speak English at home.
41.9% of residents speak Spanish at home 453 45.4% Speak English very well545 54.6% Speak English less than very well26.5% of residents speak other language at home 251 39.7% Speak English very well381 60.3% Speak English less than very well
White (Caucasian) - Speak only English Native:
95.8% (8,471)Foreign-born:
26.4% (193)
White (Caucasian) - Speak another language Native:
4.5% (398)Foreign-born:
73.3% (538)
Black or African American - Speak only English Native:
93.3% (900)Foreign-born:
73.4% (87)
Black or African American - Speak another language Native:
6.4% (62)Foreign-born:
10.4% (12)
Asian - Speak only English Native:
66.4% (89)Foreign-born:
23.8% (67)
Asian - Speak another language Native:
33.0% (44)Foreign-born:
74.4% (211)
Other race - Speak only English Native:
57.4% (147)Foreign-born:
100.0% (155)
Other race - Speak another language Native:
47.8% (123)Foreign-born:
50.1% (78)
Two or more races - Speak only English Native:
74.8% (1,842)Foreign-born:
30.2% (385)
Two or more races - Speak another language Native:
24.0% (590)Foreign-born:
71.9% (915)
White alone - Speak only English Native:
97.6% (7,924)Foreign-born:
29.2% (155)
White alone - Speak another language Native:
2.4% (198)Foreign-born:
71.4% (377)
Hispanic or Latino - Speak only English Native:
70.5% (2,015)Foreign-born:
20.6% (245)
Hispanic or Latino - Speak another language Native:
34.2% (979)Foreign-born:
81.3% (966)
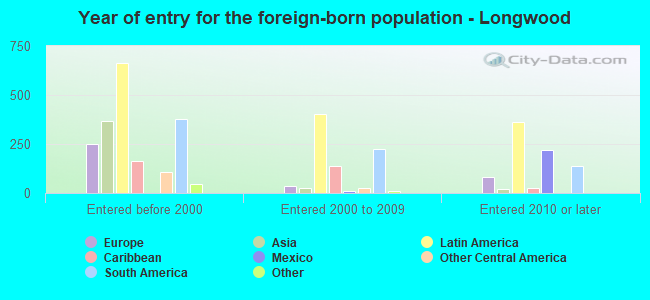
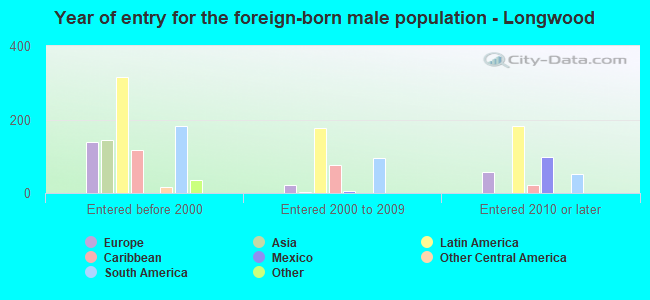
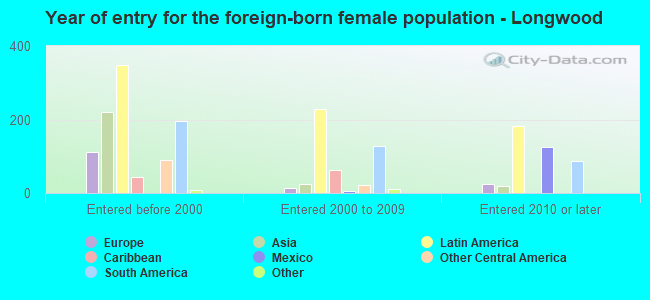
Foreign-born residents in Longwood 2,309 residents are foreign born (8.4% Latin America , 2.7% Europe , 2.4% Asia ).
This city:
14.5%Florida:
21.1%
Marital status for residents in Longwood Marital status - White (Caucasian) population 15 years and over
Males 26.0% Never married55.2% Now married1.1% Separated4.3% Widowed13.4% DivorcedFemales 26.6% Never married38.3% Now married1.2% Separated17.0% Widowed16.9% DivorcedWomen who gave birth in the past 12 months Now married:
86.7% (47)Unmarried:
13.3% (7)
Women who did not give birth in the past 12 months Now married:
40.9% (934)Unmarried:
59.1% (1,347)
Marital status - Black or African American population 15 years and over
Males 41.2% Never married50.4% Now married0.4% Separated2.5% Widowed5.5% DivorcedFemales 26.2% Never married47.2% Now married0.0% Separated15.7% Widowed10.9% DivorcedWomen who did not give birth in the past 12 months Now married:
44.6% (117)Unmarried:
55.4% (146)
Marital status - American Indian / Alaska Native population 15 years and over
Males 100.0% Never married0.0% Now married0.0% Separated0.0% Widowed0.0% DivorcedFemales 0.0% Never married100.0% Now married0.0% Separated0.0% Widowed0.0% DivorcedWomen who did not give birth in the past 12 months Now married:
100.0% (23)Unmarried:
0.0% (0)
Marital status - Asian population 15 years and over
Males 49.7% Never married50.3% Now married0.0% Separated0.0% Widowed0.0% DivorcedFemales 18.8% Never married78.2% Now married0.0% Separated3.0% Widowed0.0% DivorcedWomen who did not give birth in the past 12 months Now married:
69.6% (79)Unmarried:
30.4% (34)
Marital status - Other race population 15 years and over
Males 27.8% Never married59.8% Now married0.0% Separated0.0% Widowed12.4% DivorcedFemales 16.7% Never married57.1% Now married0.0% Separated0.0% Widowed26.2% DivorcedWomen who gave birth in the past 12 months Now married:
0.0% (0)Unmarried:
100.0% (21)
Women who did not give birth in the past 12 months Now married:
40.6% (33)Unmarried:
59.4% (48)
Marital status - Two or more races population 15 years and over
Males 42.1% Never married42.3% Now married0.0% Separated2.0% Widowed13.5% DivorcedFemales 22.6% Never married53.7% Now married0.0% Separated1.8% Widowed21.9% DivorcedWomen who gave birth in the past 12 months Now married:
100.0% (34)Unmarried:
0.0% (0)
Women who did not give birth in the past 12 months Now married:
51.6% (323)Unmarried:
48.4% (303)
Marital status - White alone, not Hispanic / Latino population 15 years and over
Males 26.6% Never married53.1% Now married1.3% Separated3.7% Widowed15.2% DivorcedFemales 25.8% Never married39.4% Now married0.9% Separated16.2% Widowed17.7% DivorcedWomen who gave birth in the past 12 months Now married:
80.0% (31)Unmarried:
20.0% (8)
Women who did not give birth in the past 12 months Now married:
41.3% (831)Unmarried:
58.7% (1,183)
Marital status - Hispanic or Latino population 15 years and over
Males 29.9% Never married53.5% Now married0.0% Separated4.4% Widowed12.1% DivorcedFemales 26.4% Never married41.4% Now married1.6% Separated11.7% Widowed19.0% DivorcedWomen who gave birth in the past 12 months Now married:
49.1% (27)Unmarried:
50.9% (28)
Women who did not give birth in the past 12 months Now married:
46.3% (441)Unmarried:
53.7% (512)
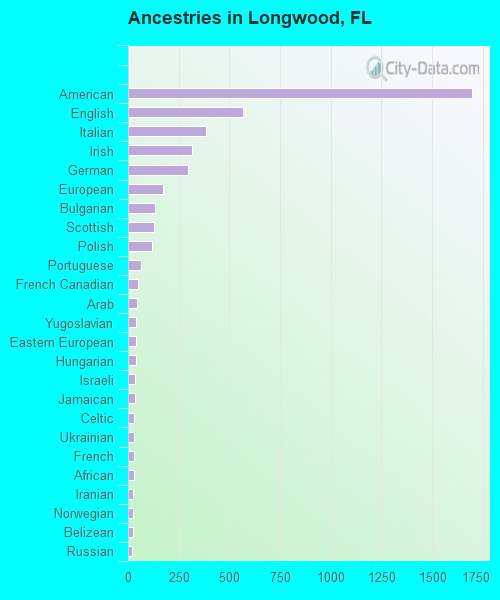
Ancestries in Longwood
1,696 22.4% American565 7.5% English384 5.1% Italian316 4.2% Irish298 3.9% German175 2.3% European133 1.8% Bulgarian129 1.7% Scottish120 1.6% Polish66 0.9% Portuguese51 0.7% French Canadian42 0.6% Arab40 0.5% Yugoslavian38 0.5% Eastern European38 0.5% Hungarian34 0.4% Israeli33 0.4% Jamaican32 0.4% Celtic29 0.4% Ukrainian28 0.4% French28 0.4% African26 0.3% Iranian23 0.3% Norwegian23 0.3% Belizean22 0.3% Russian22 0.3% British20 0.3% West Indian19 0.3% Dutch16 0.2% Romanian15 0.2% Canadian14 0.2% Czech10 0.1% Scotch-Irish8 0.1% Lebanese7 0.09% Jordanian6 0.08% Greek6 0.08% Slovak6 0.08% Swedish6 0.08% Swiss4 0.05% Pennsylvania German4 0.05% Serbian4 0.05% Haitian3 0.04% Lithuanian3 0.04% Welsh3 0.04% Trinidadian and Tobagonian
Geographical mobility in Longwood Same house 1 year ago 8,949 89.8% White (Caucasian)1,050 91.5% Black or African American36 100.0% American Indian / Alaska Native395 90.5% Asian273 57.2% Other race3,723 91.1% Two or more races7,946 88.2% White alone, not Hispanic / Latino3,980 92.7% Hispanic or LatinoMoved within same county 427 4.3% White / Caucasian23 2.0% Black or African American16 3.7% Asian90 2.2% Two or more races380 4.2% White alone, not Hispanic / Latino147 3.4% Hispanic or LatinoMoved within same state 283 2.8% White / Caucasian5 0.4% Black or African American16 3.6% Asian193 40.5% Other race287 7.0% Two or more races319 3.5% White alone, not Hispanic / Latino116 2.7% Hispanic or LatinoMoved from different state 320 3.2% White / Caucasian91 7.9% Black or African American8 1.8% Other race342 3.8% White alone, not Hispanic / Latino61 1.4% Hispanic or LatinoMoved from abroad 10 0.1% White20 0.2% White alone, not Hispanic / Latino
Children Nativity (place of birth) in Longwood
Children under 6 years - Living with two parents Both parents native 441 100.0% NativeBoth parents foreign-born 139 100.0% NativeOne native, one foreign-born parent 197 100.0% NativeChildren under 6 years - Living with one parent Native parent 372 100.0% NativeForeign-born parent 21 100.0% NativeChildren 6 to 17 years - Living with two parents Both parents native 645 100.0% NativeBoth parents foreign-born 86 58.6% Native61 41.4% Foreign-bornOne native, one foreign-born parent 355 100.0% NativeChildren 6 to 17 years - Living with one parent Native parent 443 100.0% NativeForeign-born parent 20 52.2% Native19 47.8% Foreign-born
Grandparents responsible for own grandchildren in Longwood
Grandparents (30 to 59 years) White / Caucasian 100 70.2% Responsible for grandchildren43 29.8% Not responsible for grandchildrenBlack or African American 20 40.9% Responsible for grandchildren29 59.1% Not responsible for grandchildrenTwo or more races 49 100.0% Responsible for grandchildrenWhite alone, not Hispanic / Latino 86 62.0% Responsible for grandchildren53 38.0% Not responsible for grandchildrenHispanic or Latino 66 61.9% Responsible for grandchildren41 38.1% Not responsible for grandchildrenGrandparents (60 years and over) White / Caucasian 30 13.1% Responsible for grandchildren199 86.9% Not responsible for grandchildrenBlack or African American 52 100.0% Not responsible for grandchildrenTwo or more races 96 81.8% Responsible for grandchildren21 18.2% Not responsible for grandchildrenWhite alone, not Hispanic / Latino 32 12.3% Responsible for grandchildren227 87.7% Not responsible for grandchildrenHispanic or Latino 41 33.1% Responsible for grandchildren82 66.9% Not responsible for grandchildren