Races in Los Angeles, California (CA) Detailed Stats
Data:
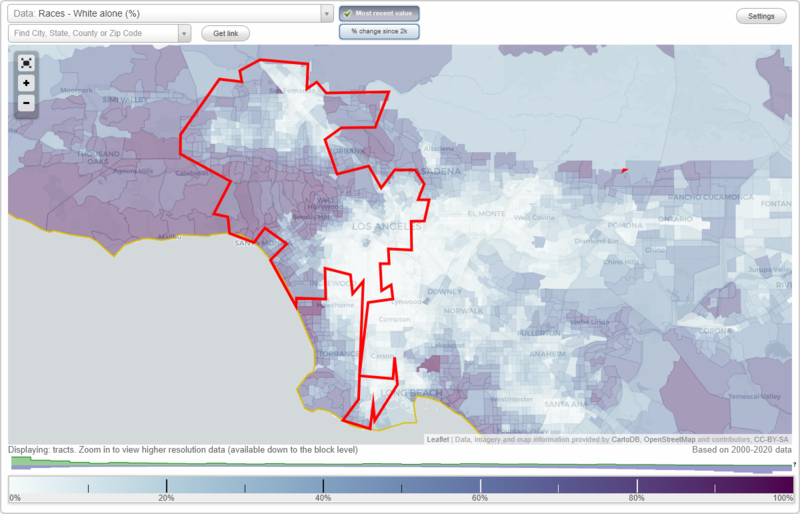
Races - White alone (%)
Races - White alone (% change since 2000)
Races - Black alone (%)
Races - Black alone (% change since 2000)
Races - American Indian alone (%)
Races - American Indian alone (% change since 2000)
Races - Asian alone (%)
Races - Asian alone (% change since 2000)
Races - Hispanic (%)
Races - Hispanic (% change since 2000)
Races - Native Hawaiian and Other Pacific Islander alone (%)
Races - Native Hawaiian and Other Pacific Islander alone (% change since 2000)
Races - Two or more races(%)
Races - Two or more races(% change since 2000)
Races - Other race alone (%)
Races - Other race alone (% change since 2000)
Racial diversity
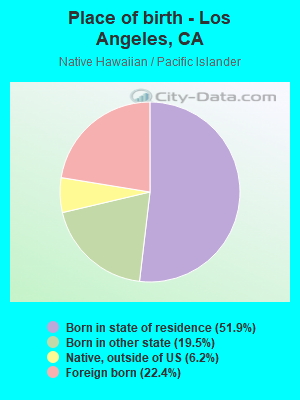
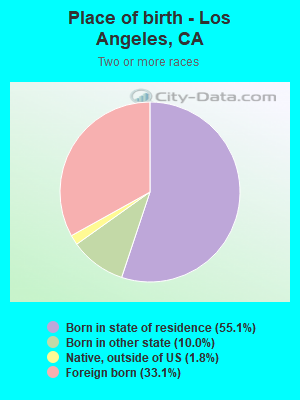
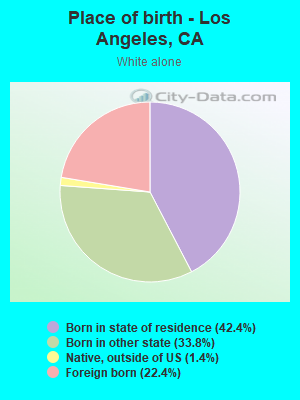
Place of birth - Born in state of residence (%)
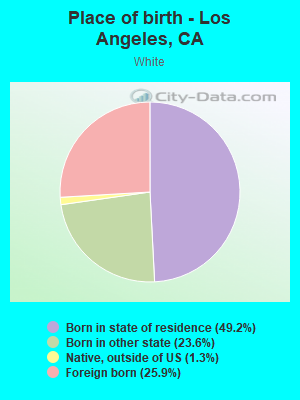
Place of birth - Born in state of residence (%) - White
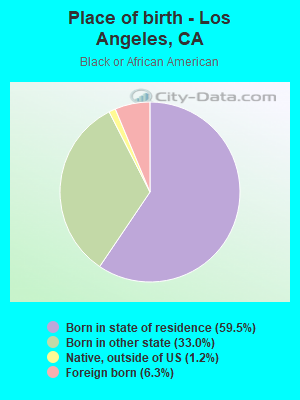
Place of birth - Born in state of residence (%) - Black or African American
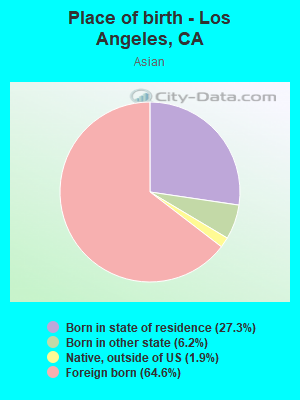
Place of birth - Born in state of residence (%) - Asian
Place of birth - Born in state of residence (%) - Hispanic or Latino
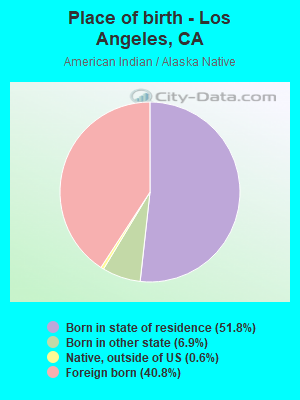
Place of birth - Born in state of residence (%) - American Indian and Alaska Native
Place of birth - Born in state of residence (%) - Multirace
Place of birth - Born in state of residence (%) - Other Race
Place of birth - Born in other state (%)
Place of birth - Born in other state (%) - White
Place of birth - Born in other state (%) - Black or African American
Place of birth - Born in other state (%) - Asian
Place of birth - Born in other state (%) - Hispanic or Latino
Place of birth - Born in other state (%) - American Indian and Alaska Native
Place of birth - Born in other state (%) - Multirace
Place of birth - Born in other state (%) - Other Race
Place of birth - Native, outside of US (%)
Place of birth - Native, outside of US (%) - White
Place of birth - Native, outside of US (%) - Black or African American
Place of birth - Native, outside of US (%) - Asian
Place of birth - Native, outside of US (%) - Hispanic or Latino
Place of birth - Native, outside of US (%) - American Indian and Alaska Native
Place of birth - Native, outside of US (%) - Multirace
Place of birth - Native, outside of US (%) - Other Race
Place of birth - Foreign born (%)
Place of birth - Foreign born (%) - White
Place of birth - Foreign born (%) - Black or African American
Place of birth - Foreign born (%) - Asian
Place of birth - Foreign born (%) - Hispanic or Latino
Place of birth - Foreign born (%) - American Indian and Alaska Native
Place of birth - Foreign born (%) - Multirace
Place of birth - Foreign born (%) - Other Race
Residents speaking English at home (%)
Residents speaking English at home - Born in the United States (%)
Residents speaking English at home - Native, born elsewhere (%)
Residents speaking English at home - Foreign born (%)
Residents speaking Spanish at home (%)
Residents speaking Spanish at home - Born in the United States (%)
Residents speaking Spanish at home - Native, born elsewhere (%)
Residents speaking Spanish at home - Foreign born (%)
Residents speaking other language at home (%)
Residents speaking other language at home - Born in the United States (%)
Residents speaking other language at home - Native, born elsewhere (%)
Residents speaking other language at home - Foreign born (%)
Marital status - Never married (%)
Marital status - Now married (%)
Marital status - Separated (%)
Marital status - Widowed (%)
Marital status - Divorced (%)
Ancestries Reported - Arab (%)
Ancestries Reported - Czech (%)
Ancestries Reported - Danish (%)
Ancestries Reported - Dutch (%)
Ancestries Reported - English (%)
Ancestries Reported - French (%)
Ancestries Reported - French Canadian (%)
Ancestries Reported - German (%)
Ancestries Reported - Greek (%)
Ancestries Reported - Hungarian (%)
Ancestries Reported - Irish (%)
Ancestries Reported - Italian (%)
Ancestries Reported - Lithuanian (%)
Ancestries Reported - Norwegian (%)
Ancestries Reported - Polish (%)
Ancestries Reported - Portuguese (%)
Ancestries Reported - Russian (%)
Ancestries Reported - Scotch-Irish (%)
Ancestries Reported - Scottish (%)
Ancestries Reported - Slovak (%)
Ancestries Reported - Subsaharan African (%)
Ancestries Reported - Swedish (%)
Ancestries Reported - Swiss (%)
Ancestries Reported - Ukrainian (%)
Ancestries Reported - United States (%)
Ancestries Reported - Welsh (%)
Ancestries Reported - West Indian (%)
Ancestries Reported - Other (%)
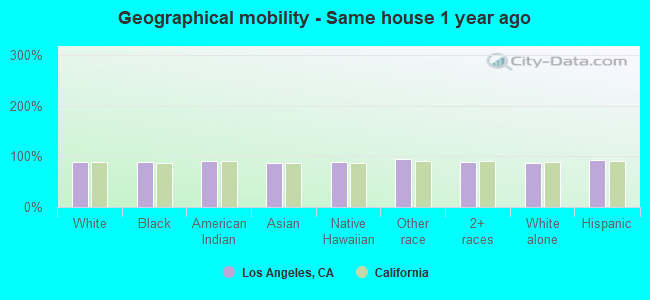
Geographical mobility - Same house 1 year ago (%)
Geographical mobility - Same house 1 year ago (%) - White
Geographical mobility - Same house 1 year ago (%) - Black or African American
Geographical mobility - Same house 1 year ago (%) - Asian
Geographical mobility - Same house 1 year ago (%) - Hispanic or Latino
Geographical mobility - Same house 1 year ago (%) - American Indian and Alaska Native
Geographical mobility - Same house 1 year ago (%) - Multirace
Geographical mobility - Same house 1 year ago (%) - Other Race
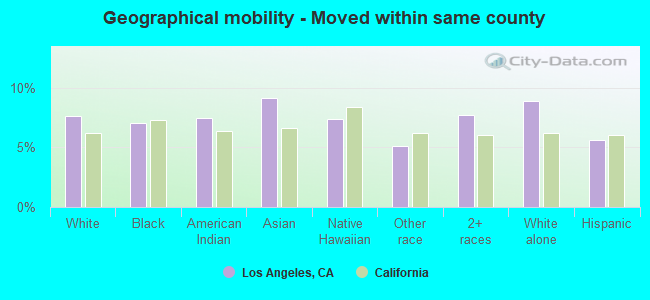
Geographical mobility - Moved within same county (%)
Geographical mobility - Moved within same county (%) - White
Geographical mobility - Moved within same county (%) - Black or African American
Geographical mobility - Moved within same county (%) - Asian
Geographical mobility - Moved within same county (%) - Hispanic or Latino
Geographical mobility - Moved within same county (%) - American Indian and Alaska Native
Geographical mobility - Moved within same county (%) - Multirace
Geographical mobility - Moved within same county (%) - Other Race
Geographical mobility - Moved from different county within same state (%)
Geographical mobility - Moved from different county within same state (%) - White
Geographical mobility - Moved from different county within same state (%) - Black or African American
Geographical mobility - Moved from different county within same state (%) - Asian
Geographical mobility - Moved from different county within same state (%) - Hispanic or Latino
Geographical mobility - Moved from different county within same state (%) - American Indian and Alaska Native
Geographical mobility - Moved from different county within same state (%) - Multirace
Geographical mobility - Moved from different county within same state (%) - Other Race
Geographical mobility - Moved from different state (%)
Geographical mobility - Moved from different state (%) - White
Geographical mobility - Moved from different state (%) - Black or African American
Geographical mobility - Moved from different state (%) - Asian
Geographical mobility - Moved from different state (%) - Hispanic or Latino
Geographical mobility - Moved from different state (%) - American Indian and Alaska Native
Geographical mobility - Moved from different state (%) - Multirace
Geographical mobility - Moved from different state (%) - Other Race
Geographical mobility - Moved from abroad (%)
Geographical mobility - Moved from abroad (%) - White
Geographical mobility - Moved from abroad (%) - Black or African American
Geographical mobility - Moved from abroad (%) - Asian
Geographical mobility - Moved from abroad (%) - Hispanic or Latino
Geographical mobility - Moved from abroad (%) - American Indian and Alaska Native
Geographical mobility - Moved from abroad (%) - Multirace
Geographical mobility - Moved from abroad (%) - Other Race
Place of birth for the foreign-born population - Ireland (%)
Place of birth for the foreign-born population - Denmark (%)
Place of birth for the foreign-born population - Norway (%)
Place of birth for the foreign-born population - Sweden (%)
Place of birth for the foreign-born population - United Kingdom (%)
Place of birth for the foreign-born population - England (%)
Place of birth for the foreign-born population - Scotland (%)
Place of birth for the foreign-born population - Other Northern Europe (%)
Place of birth for the foreign-born population - Austria (%)
Place of birth for the foreign-born population - Belgium (%)
Place of birth for the foreign-born population - France (%)
Place of birth for the foreign-born population - Germany (%)
Place of birth for the foreign-born population - Netherlands (%)
Place of birth for the foreign-born population - Switzerland (%)
Place of birth for the foreign-born population - Other Western Europe (%)
Place of birth for the foreign-born population - Greece (%)
Place of birth for the foreign-born population - Italy (%)
Place of birth for the foreign-born population - Portugal (%)
Place of birth for the foreign-born population - Spain (%)
Place of birth for the foreign-born population - Other Southern Europe (%)
Place of birth for the foreign-born population - Albania (%)
Place of birth for the foreign-born population - Belarus (%)
Place of birth for the foreign-born population - Bosnia and Herzegovina (%)
Place of birth for the foreign-born population - Bulgaria (%)
Place of birth for the foreign-born population - Croatia (%)
Place of birth for the foreign-born population - Czechoslovakia (%)
Place of birth for the foreign-born population - Hungary (%)
Place of birth for the foreign-born population - Latvia (%)
Place of birth for the foreign-born population - Lithuania (%)
Place of birth for the foreign-born population - North Macedonia (Macedonia) (%)
Place of birth for the foreign-born population - Moldova (%)
Place of birth for the foreign-born population - Poland (%)
Place of birth for the foreign-born population - Romania (%)
Place of birth for the foreign-born population - Russia (%)
Place of birth for the foreign-born population - Serbia (%)
Place of birth for the foreign-born population - Ukraine (%)
Place of birth for the foreign-born population - Other Eastern Europe (%)
Place of birth for the foreign-born population - China (%)
Place of birth for the foreign-born population - Hong Kong (%)
Place of birth for the foreign-born population - Taiwan (%)
Place of birth for the foreign-born population - Japan (%)
Place of birth for the foreign-born population - Korea (%)
Place of birth for the foreign-born population - Other Eastern Asia (%)
Place of birth for the foreign-born population - Afghanistan (%)
Place of birth for the foreign-born population - Bangladesh (%)
Place of birth for the foreign-born population - India (%)
Place of birth for the foreign-born population - Iran (%)
Place of birth for the foreign-born population - Kazakhstan (%)
Place of birth for the foreign-born population - Nepal (%)
Place of birth for the foreign-born population - Pakistan (%)
Place of birth for the foreign-born population - Sri Lanka (%)
Place of birth for the foreign-born population - Uzbekistan (%)
Place of birth for the foreign-born population - Other South Central Asia (%)
Place of birth for the foreign-born population - Burma (%)
Place of birth for the foreign-born population - Cambodia (%)
Place of birth for the foreign-born population - Indonesia (%)
Place of birth for the foreign-born population - Laos (%)
Place of birth for the foreign-born population - Malaysia (%)
Place of birth for the foreign-born population - Philippines (%)
Place of birth for the foreign-born population - Singapore (%)
Place of birth for the foreign-born population - Thailand (%)
Place of birth for the foreign-born population - Vietnam (%)
Place of birth for the foreign-born population - Other South Eastern Asia (%)
Place of birth for the foreign-born population - Armenia (%)
Place of birth for the foreign-born population - Iraq (%)
Place of birth for the foreign-born population - Israel (%)
Place of birth for the foreign-born population - Jordan (%)
Place of birth for the foreign-born population - Kuwait (%)
Place of birth for the foreign-born population - Lebanon (%)
Place of birth for the foreign-born population - Saudi Arabia (%)
Place of birth for the foreign-born population - Syria (%)
Place of birth for the foreign-born population - Turkey (%)
Place of birth for the foreign-born population - Yemen (%)
Place of birth for the foreign-born population - Other Western Asia (%)
Place of birth for the foreign-born population - Eritrea (%)
Place of birth for the foreign-born population - Ethiopia (%)
Place of birth for the foreign-born population - Kenya (%)
Place of birth for the foreign-born population - Somalia (%)
Place of birth for the foreign-born population - Uganda (%)
Place of birth for the foreign-born population - Zimbabwe (%)
Place of birth for the foreign-born population - Other Eastern Africa (%)
Place of birth for the foreign-born population - Cameroon (%)
Place of birth for the foreign-born population - Congo (%)
Place of birth for the foreign-born population - Democratic Republic of Congo (Zaire) (%)
Place of birth for the foreign-born population - Other Middle Africa (%)
Place of birth for the foreign-born population - Egypt (%)
Place of birth for the foreign-born population - Morocco (%)
Place of birth for the foreign-born population - Sudan (%)
Place of birth for the foreign-born population - Other Northern Africa (%)
Place of birth for the foreign-born population - South Africa (%)
Place of birth for the foreign-born population - Other Southern Africa (%)
Place of birth for the foreign-born population - Cabo Verde (%)
Place of birth for the foreign-born population - Ghana (%)
Place of birth for the foreign-born population - Liberia (%)
Place of birth for the foreign-born population - Nigeria (%)
Place of birth for the foreign-born population - Senegal (%)
Place of birth for the foreign-born population - Sierra Leone (%)
Place of birth for the foreign-born population - Other Western Africa (%)
Place of birth for the foreign-born population - Australia (%)
Place of birth for the foreign-born population - New Zealand (%)
Place of birth for the foreign-born population - Fiji (%)
Place of birth for the foreign-born population - Micronesia (%)
Place of birth for the foreign-born population - Bahamas (%)
Place of birth for the foreign-born population - Barbados (%)
Place of birth for the foreign-born population - Cuba (%)
Place of birth for the foreign-born population - Dominica (%)
Place of birth for the foreign-born population - Dominican Republic (%)
Place of birth for the foreign-born population - Grenada (%)
Place of birth for the foreign-born population - Haiti (%)
Place of birth for the foreign-born population - Jamaica (%)
Place of birth for the foreign-born population - St. Vincent and the Grenadines (%)
Place of birth for the foreign-born population - Trinidad and Tobago (%)
Place of birth for the foreign-born population - West Indies (%)
Place of birth for the foreign-born population - Other Caribbean (%)
Place of birth for the foreign-born population - Belize (%)
Place of birth for the foreign-born population - Costa Rica (%)
Place of birth for the foreign-born population - El Salvador (%)
Place of birth for the foreign-born population - Guatemala (%)
Place of birth for the foreign-born population - Honduras (%)
Place of birth for the foreign-born population - Mexico (%)
Place of birth for the foreign-born population - Nicaragua (%)
Place of birth for the foreign-born population - Panama (%)
Place of birth for the foreign-born population - Other Central America (%)
Place of birth for the foreign-born population - Argentina (%)
Place of birth for the foreign-born population - Bolivia (%)
Place of birth for the foreign-born population - Brazil (%)
Place of birth for the foreign-born population - Chile (%)
Place of birth for the foreign-born population - Colombia (%)
Place of birth for the foreign-born population - Ecuador (%)
Place of birth for the foreign-born population - Guyana (%)
Place of birth for the foreign-born population - Peru (%)
Place of birth for the foreign-born population - Uruguay (%)
Place of birth for the foreign-born population - Venezuela (%)
Place of birth for the foreign-born population - Other South America (%)
Place of birth for the foreign-born population - Canada (%)
Place of birth for the foreign-born population - Other Northern America (%)
Place of birth for the foreign-born population - Other (%)
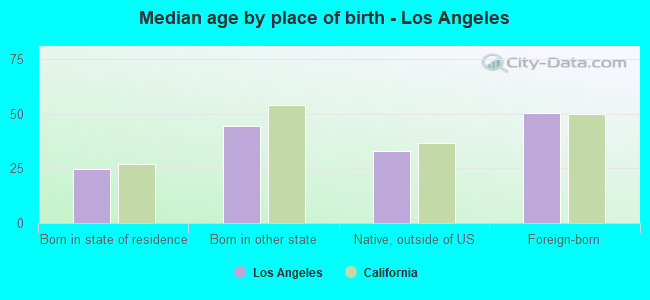
According to 2022 data, the most numerous races in Los Angeles, CA are Hispanic (1,955,672 residents), White alone (1,084,105 residents), and Asian alone (478,047 residents). 41.3% of Los Angeles residents speak English at home. 36.1% of Los Angeles, CA residents are foreign-born (21.8% born in Latin America, 11.2% born in Asia), which is 27.9% greater than the foreign-born rate of 26.0% across the entire state of California.
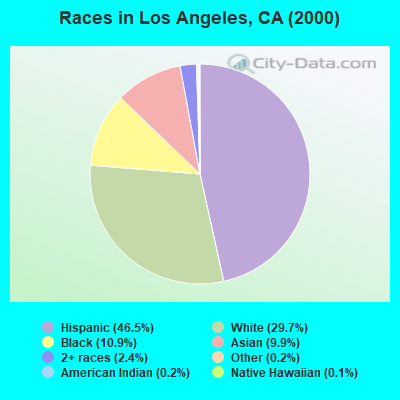
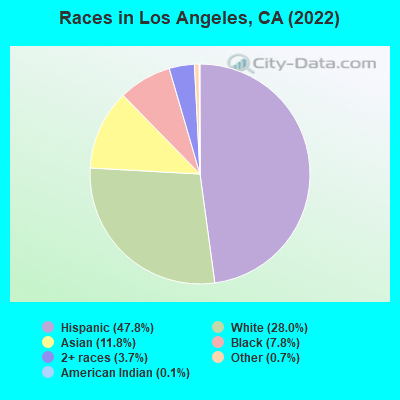
Race distribution in Los Angeles
2000 2022
1,719,073 46.5% Hispanic 1,099,188 29.7% White alone 401,986 10.9% Black alone 364,850 9.9% Asian alone 87,277 2.4% Two or more races 9,065 0.2% Other race alone 8,897 0.2% American Indian alone 4,484 0.1% Native Hawaiian and Other
1,955,672 49.1% Hispanic 1,084,105 27.2% White alone 478,047 12.0% Asian alone 320,910 8.0% Black alone 127,852 3.2% Two or more races 24,008 0.6% Other race alone 7,215 0.2% American Indian alone 4,134 0.1% Native Hawaiian and Other
2000 2022
15,816,790 46.7% White alone 10,966,556 32.4% Hispanic 3,648,860 10.8% Asian alone 2,181,926 6.4% Black alone 903,115 2.7% Two or more races 178,984 0.5% American Indian alone 103,736 0.3% Native Hawaiian and Other 71,681 0.2% Other race alone
15,732,184 40.3% Hispanic 13,160,426 33.7% White alone 5,957,867 15.3% Asian alone 2,025,218 5.2% Black alone 1,663,222 4.3% Two or more races 251,618 0.6% Other race alone 135,777 0.3% Native Hawaiian and Other 103,030 0.3% American Indian alone
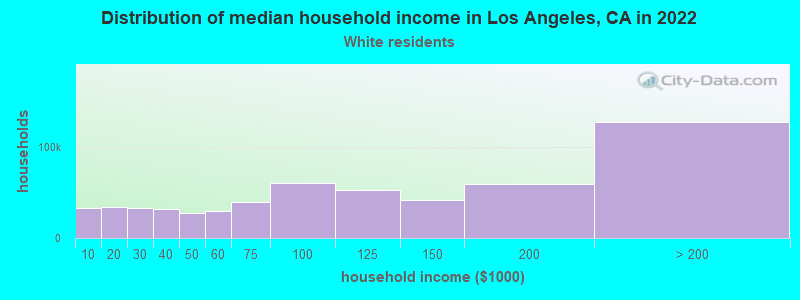
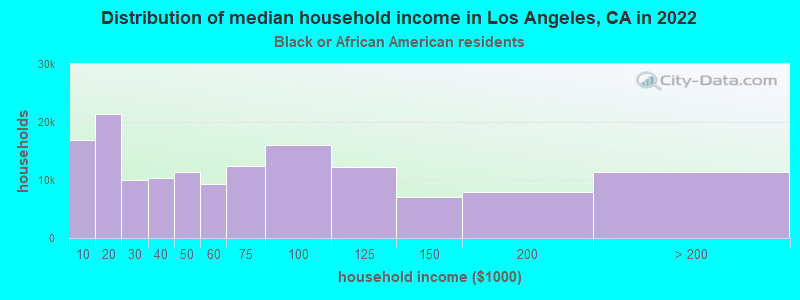
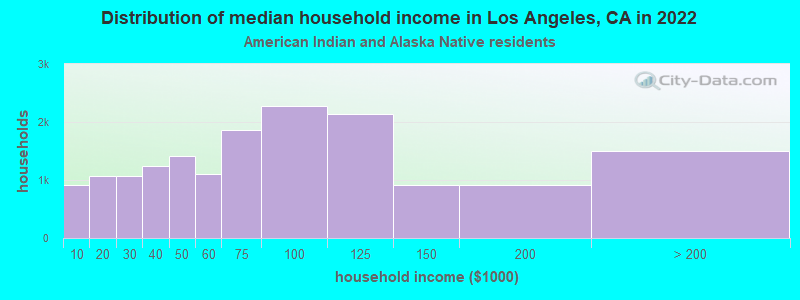
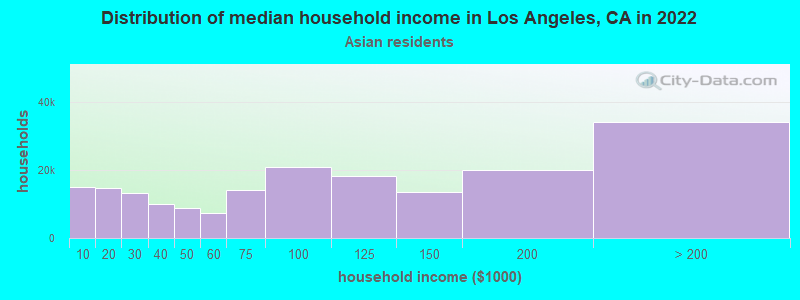
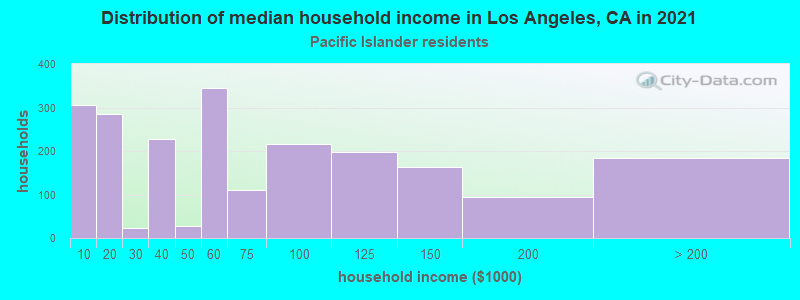
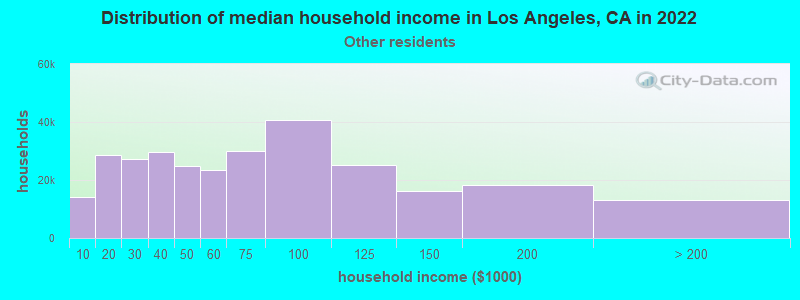
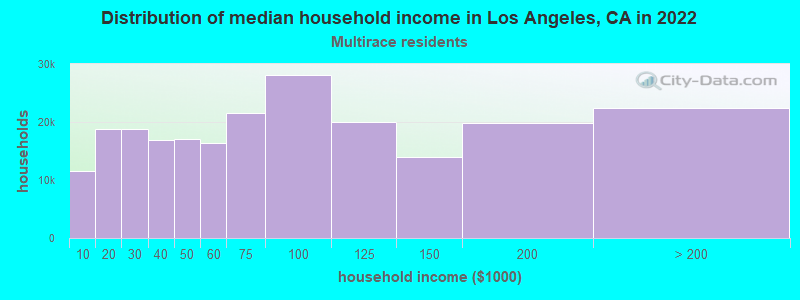
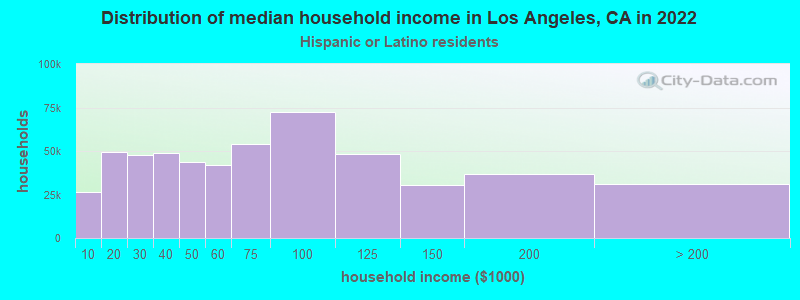
Income and house value in Los Angeles Median household income in 2022 $113,237 White non-Hispanic householders$58,083 Black householders$81,891 American Indian and Alaska Native householders$97,979 Asian householders$80,335 Native Hawaiian and other Pacific Islander householders$64,959 Some other race householders$77,601 Two or more races householders$67,464 Hispanic or Latino race householdersMedian 2022 house value over $1,000,000 White Non-Hispanic householders$574,807 Black or African American householders$593,883 American Indian or Alaska Native householders $772,408 Asian householders$649,672 Native Hawaiian and other Pacific Islander householders$563,289 Some other race householders$697,903 Two or more races householders$580,926 Hispanic or Latino householders
Median age by race in Los Angeles
39.5 Median age for White residents39.2 40.0 39.1 Median age for Black or African American residents37.4 41.1 40.0 Median age for American Indian / Alaska Native residents36.2 40.4 41.2 Median age for Asian residents39.3 43.4 42.5 Median age for Native Hawaiian / Pacific Islander residents41.6 45.9 32.5 Median age for Other race residents32.3 32.8 34.9 Median age for Two or more races residents35.6 34.4 42.3 Median age for White alone residents41.8 43.0 32.6 Median age for Hispanic or Latino residents32.3 33.1
Owner/renter occupied households by race in Los Angeles
House owners and renters - White residents 296,831 44.1% Owner occupied376,204 55.9% Renter occupiedHouse owners and renters - Black or African American residents 41,499 29.5% Owner occupied99,007 70.5% Renter occupiedHouse owners and renters - American Indian / Alaska Native residents 4,355 31.0% Owner occupied9,697 69.0% Renter occupiedHouse owners and renters - Asian residents 73,174 38.5% Owner occupied116,973 61.5% Renter occupiedHouse owners and renters - Native Hawaiian / Pacific Islander residents 509 27.1% Owner occupied1,368 72.9% Renter occupiedHouse owners and renters - Other race residents 69,852 25.4% Owner occupied205,328 74.6% Renter occupiedHouse owners and renters - Two or more races residents 49,588 33.8% Owner occupied97,008 66.2% Renter occupiedHouse owners and renters - White alone residents 240,791 47.1% Owner occupied270,615 52.9% Renter occupiedHouse owners and renters - Hispanic or Latino residents 159,656 29.9% Owner occupied374,383 70.1% Renter occupied
Language usage in Los Angeles
English speakers - Total 41.3% of residents of Los Angeles speak English at home.
41.4% of residents speak Spanish at home 887,446 57.0% Speak English very well669,788 43.0% Speak English less than very well16.9% of residents speak other language at home 384,255 60.6% Speak English very well249,804 39.4% Speak English less than very well
English speakers - Born in the United States 88.1% of residents of Los Angeles speak English at home.
6.8% of residents speak Spanish at home 34,504 87.6% Speak English very well4,889 12.4% Speak English less than very well5.2% of residents speak other language at home 28,041 92.9% Speak English very well2,149 7.1% Speak English less than very well
English speakers - Native, born elsewhere 47.8% of residents of Los Angeles speak English at home.
30.6% of residents speak Spanish at home 10,806 74.2% Speak English very well3,759 25.8% Speak English less than very well21.6% of residents speak other language at home 8,030 77.8% Speak English very well2,288 22.2% Speak English less than very well
English speakers - Foreign-born 9.8% of residents of Los Angeles speak English at home.
55.5% of residents speak Spanish at home 220,416 27.5% Speak English very well580,537 72.5% Speak English less than very well33.8% of residents speak other language at home 254,099 52.1% Speak English very well233,927 47.9% Speak English less than very well
White (Caucasian) - Speak only English Native:
71.3% (801,693)Foreign-born:
13.9% (58,576)
White (Caucasian) - Speak another language Native:
24.8% (278,986)Foreign-born:
84.8% (356,940)
Black or African American - Speak only English Native:
93.7% (265,283)Foreign-born:
37.8% (13,653)
Black or African American - Speak another language Native:
6.4% (18,198)Foreign-born:
62.2% (22,460)
American Indian / Alaska Native - Speak only English Native:
46.4% (11,297)Foreign-born:
5.5% (1,138)
American Indian / Alaska Native - Speak another language Native:
65.5% (15,949)Foreign-born:
94.5% (19,397)
Asian - Speak only English Native:
58.1% (91,114)Foreign-born:
12.0% (37,093)
Asian - Speak another language Native:
41.9% (65,798)Foreign-born:
88.1% (273,015)
Native Hawaiian / Pacific Islander - Speak only English Native:
73.4% (2,453)Foreign-born:
27.6% (570)
Native Hawaiian / Pacific Islander - Speak another language Native:
26.9% (900)Foreign-born:
74.9% (1,547)
Other race - Speak only English Native:
17.8% (90,114)Foreign-born:
3.5% (16,500)
Other race - Speak another language Native:
80.4% (407,569)Foreign-born:
95.9% (453,109)
Two or more races - Speak only English Native:
57.3% (165,841)Foreign-born:
10.6% (17,167)
Two or more races - Speak another language Native:
55.0% (158,945)Foreign-born:
88.2% (142,519)
White alone - Speak only English Native:
89.1% (718,288)Foreign-born:
21.5% (52,563)
White alone - Speak another language Native:
11.2% (89,895)Foreign-born:
78.7% (191,988)
Hispanic or Latino - Speak only English Native:
24.9% (250,927)Foreign-born:
3.6% (29,062)
Hispanic or Latino - Speak another language Native:
73.7% (742,397)Foreign-born:
95.9% (775,007)
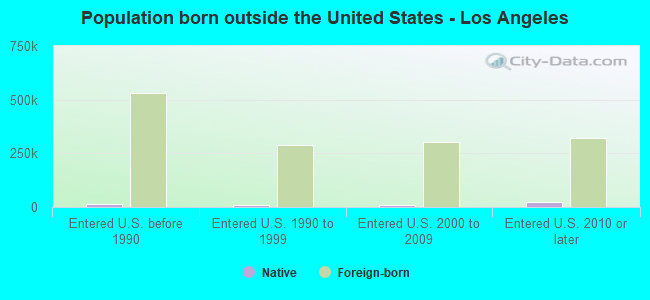
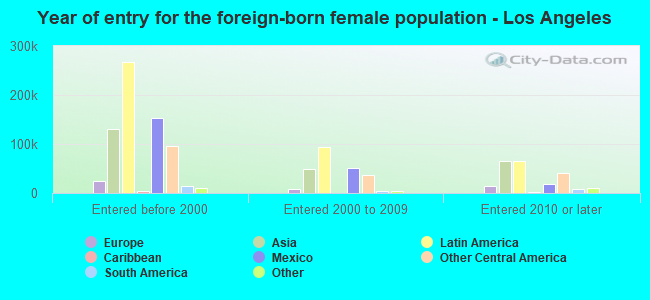
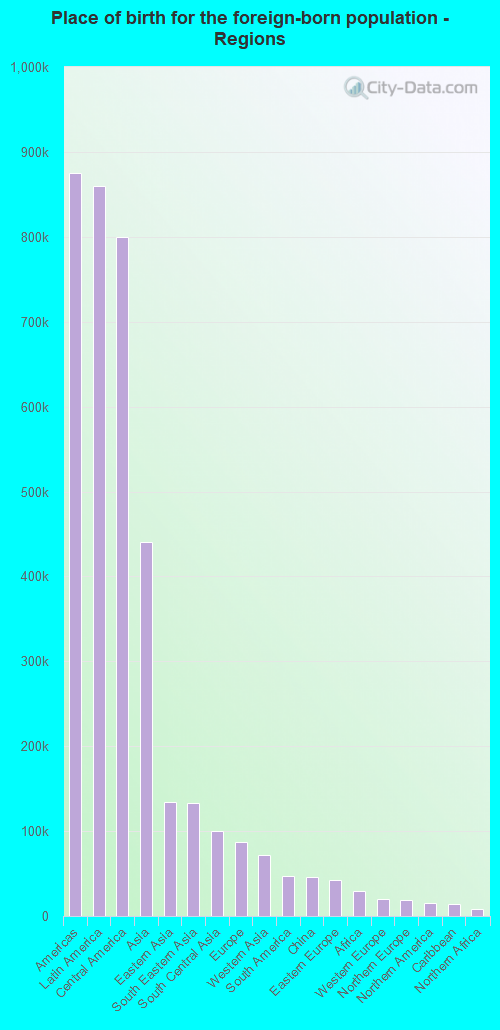
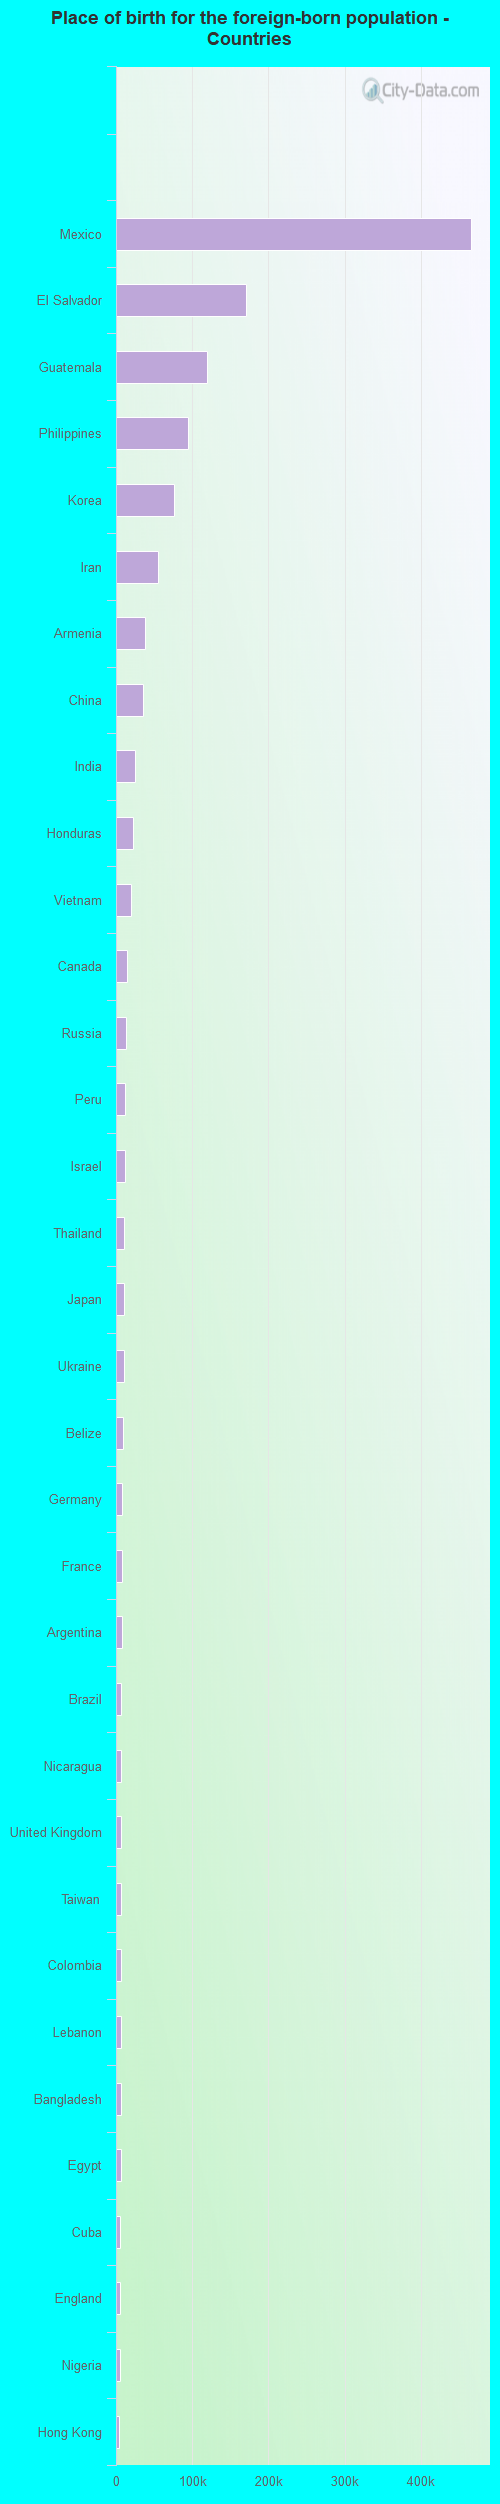
Foreign-born residents in Los Angeles 1,438,539 residents are foreign born (21.8% Latin America , 11.2% Asia ).
This city:
36.1%California:
100.0%
Marital status for residents in Los Angeles Marital status - White (Caucasian) population 15 years and over
Males 47.8% Never married41.3% Now married1.5% Separated1.9% Widowed7.5% DivorcedFemales 40.2% Never married39.6% Now married2.5% Separated7.6% Widowed10.2% DivorcedWomen who gave birth in the past 12 months Now married:
72.0% (12,060)Unmarried:
28.0% (4,695)
Women who did not give birth in the past 12 months Now married:
36.3% (144,673)Unmarried:
63.7% (254,412)
Marital status - Black or African American population 15 years and over
Males 59.6% Never married24.2% Now married3.2% Separated2.5% Widowed10.6% DivorcedFemales 55.9% Never married18.3% Now married2.8% Separated9.7% Widowed13.2% DivorcedWomen who gave birth in the past 12 months Now married:
24.0% (733)Unmarried:
76.0% (2,317)
Women who did not give birth in the past 12 months Now married:
16.4% (13,135)Unmarried:
83.6% (67,104)
Marital status - American Indian / Alaska Native population 15 years and over
Males 56.8% Never married33.1% Now married2.9% Separated0.7% Widowed6.5% DivorcedFemales 41.6% Never married38.5% Now married5.6% Separated5.2% Widowed9.0% DivorcedWomen who gave birth in the past 12 months Now married:
62.2% (242)Unmarried:
37.8% (147)
Women who did not give birth in the past 12 months Now married:
40.1% (4,462)Unmarried:
59.9% (6,666)
Marital status - Asian population 15 years and over
Males 42.4% Never married48.6% Now married2.2% Separated2.2% Widowed4.7% DivorcedFemales 33.9% Never married46.0% Now married2.3% Separated9.4% Widowed8.3% DivorcedWomen who gave birth in the past 12 months Now married:
88.3% (4,480)Unmarried:
11.7% (593)
Women who did not give birth in the past 12 months Now married:
40.0% (51,144)Unmarried:
60.0% (76,725)
Marital status - Native Hawaiian / Pacific Islander population 15 years and over
Males 55.3% Never married35.1% Now married0.6% Separated3.1% Widowed5.8% DivorcedFemales 47.7% Never married38.4% Now married1.1% Separated3.3% Widowed9.4% DivorcedWomen who gave birth in the past 12 months Now married:
42.2% (44)Unmarried:
57.8% (61)
Women who did not give birth in the past 12 months Now married:
32.2% (597)Unmarried:
67.8% (1,256)
Marital status - Other race population 15 years and over
Males 52.7% Never married38.6% Now married2.5% Separated1.0% Widowed5.2% DivorcedFemales 48.3% Never married36.5% Now married3.7% Separated4.9% Widowed6.5% DivorcedWomen who gave birth in the past 12 months Now married:
54.4% (7,749)Unmarried:
45.6% (6,500)
Women who did not give birth in the past 12 months Now married:
34.5% (95,045)Unmarried:
65.5% (180,062)
Marital status - Two or more races population 15 years and over
Males 56.2% Never married34.9% Now married3.0% Separated1.0% Widowed4.9% DivorcedFemales 59.6% Never married26.7% Now married2.3% Separated3.6% Widowed7.9% DivorcedWomen who gave birth in the past 12 months Now married:
78.1% (3,291)Unmarried:
21.9% (922)
Women who did not give birth in the past 12 months Now married:
23.7% (30,535)Unmarried:
76.3% (98,168)
Marital status - White alone, not Hispanic / Latino population 15 years and over
Males 43.6% Never married43.9% Now married1.4% Separated2.0% Widowed9.1% DivorcedFemales 36.1% Never married41.7% Now married1.4% Separated8.5% Widowed12.3% DivorcedWomen who gave birth in the past 12 months Now married:
91.1% (7,744)Unmarried:
8.9% (757)
Women who did not give birth in the past 12 months Now married:
37.5% (95,710)Unmarried:
62.5% (159,568)
Marital status - Hispanic or Latino population 15 years and over
Males 53.5% Never married37.8% Now married2.2% Separated1.3% Widowed5.2% DivorcedFemales 47.4% Never married36.3% Now married3.8% Separated5.5% Widowed6.9% DivorcedWomen who gave birth in the past 12 months Now married:
55.1% (14,185)Unmarried:
44.9% (11,543)
Women who did not give birth in the past 12 months Now married:
34.3% (173,916)Unmarried:
65.7% (332,969)
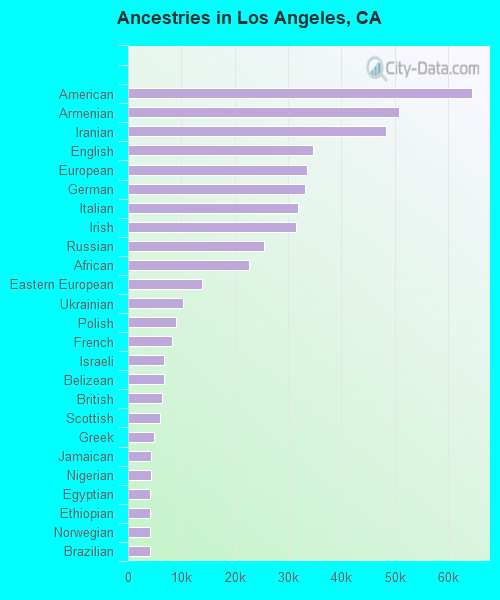
Ancestries in Los Angeles
100,627 3.9% American59,308 2.3% Armenian47,856 1.8% Iranian43,431 1.7% European28,307 1.1% Irish27,895 1.1% English27,704 1.1% Italian23,243 0.9% German21,903 0.8% Russian16,244 0.6% Eastern European12,016 0.5% African11,392 0.4% Polish9,760 0.4% Israeli8,771 0.3% Ukrainian8,442 0.3% French7,886 0.3% Belizean7,003 0.3% Egyptian6,682 0.3% Nigerian6,495 0.3% British5,280 0.2% Jamaican5,105 0.2% Afghan4,845 0.2% Ethiopian4,562 0.2% Hungarian4,441 0.2% Brazilian4,124 0.2% Scottish3,935 0.2% Norwegian2,966 0.1% Romanian2,931 0.1% Greek2,855 0.1% Dutch2,615 0.1% Canadian2,590 0.10% Swedish2,474 0.10% Northern European2,266 0.09% Scotch-Irish2,225 0.09% Scandinavian2,179 0.08% Lebanese2,062 0.08% Haitian1,999 0.08% Turkish1,850 0.07% Croatian1,785 0.07% Australian1,599 0.06% Portuguese1,596 0.06% Serbian1,466 0.06% French Canadian1,380 0.05% Arab1,374 0.05% Danish1,370 0.05% Slavic1,345 0.05% Czech1,210 0.05% Welsh1,183 0.05% Assyrian1,132 0.04% Swiss1,127 0.04% Austrian1,115 0.04% Latvian1,112 0.04% Kenyan1,084 0.04% Lithuanian1,010 0.04% Ghanaian950 0.04% South African929 0.04% Moroccan846 0.03% Ugandan792 0.03% Syrian792 0.03% Bulgarian754 0.03% Palestinian717 0.03% Senegalese625 0.02% West Indian569 0.02% Finnish559 0.02% Jordanian496 0.02% Trinidadian and Tobagonian465 0.02% Yugoslavian404 0.02% Sudanese402 0.02% Slovak398 0.02% Belgian333 0.01% Albanian322 0.01% Czechoslovakian313 0.01% Iraqi261 0.01% Liberian217 0.01% Icelander201 0.01% Bahamian192 0.01% Celtic185 0.01% Guyanese178 0.01% Soviet Union154 0.01% Estonian144 0.01% Zimbabwean133 0.01% Slovene
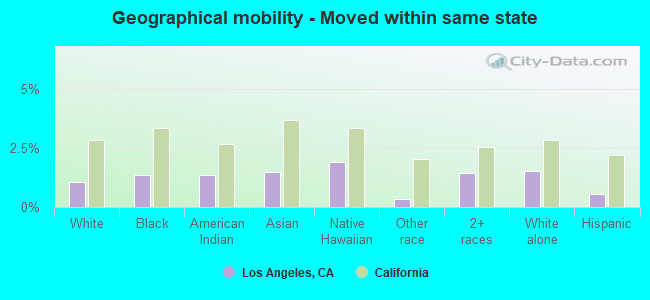
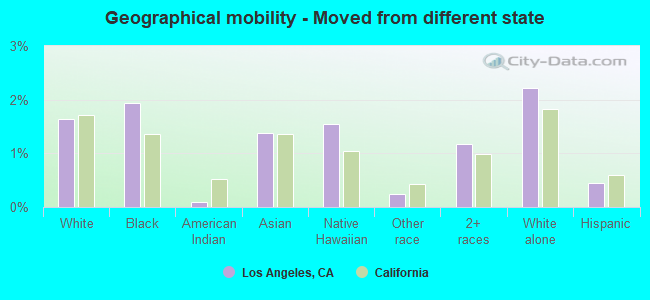
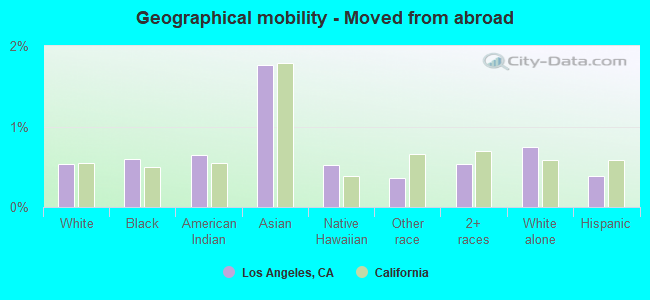
Geographical mobility in Los Angeles Same house 1 year ago 1,478,577 89.0% White (Caucasian)296,025 89.4% Black or African American37,662 91.1% American Indian / Alaska Native413,006 85.9% Asian5,660 88.3% Native Hawaiian / Pacific Islander980,206 94.4% Other race360,931 89.0% Two or more races918,060 86.3% White alone, not Hispanic / Latino1,806,366 93.3% Hispanic or LatinoMoved within same county 126,094 7.6% White / Caucasian23,273 7.0% Black or African American3,080 7.5% American Indian / Alaska Native43,829 9.1% Asian473 7.4% Native Hawaiian / Pacific Islander52,737 5.1% Other race31,277 7.7% Two or more races94,847 8.9% White alone, not Hispanic / Latino108,341 5.6% Hispanic or LatinoMoved within same state 17,182 1.0% White / Caucasian4,406 1.3% Black or African American551 1.3% American Indian / Alaska Native7,181 1.5% Asian122 1.9% Native Hawaiian / Pacific Islander3,356 0.3% Other race5,904 1.5% Two or more races15,981 1.5% White alone, not Hispanic / Latino10,634 0.5% Hispanic or LatinoMoved from different state 27,218 1.6% White / Caucasian6,419 1.9% Black or African American36 0.1% American Indian / Alaska Native6,643 1.4% Asian99 1.5% Native Hawaiian / Pacific Islander2,589 0.2% Other race4,773 1.2% Two or more races23,609 2.2% White alone, not Hispanic / Latino8,586 0.4% Hispanic or LatinoMoved from abroad 8,802 0.5% White1,991 0.6% Black or African American268 0.6% American Indian / Alaska Native8,473 1.8% Asian34 0.5% Native Hawaiian / Pacific Islander3,687 0.4% Other race2,140 0.5% Two or more races7,908 0.7% White alone, not Hispanic / Latino7,570 0.4% Hispanic or Latino
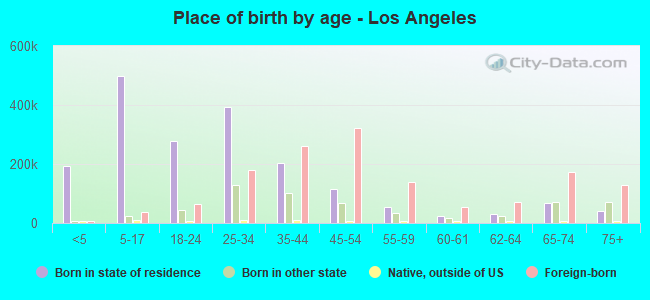
Children Nativity (place of birth) in Los Angeles
Children under 6 years - Living with two parents Both parents native 58,203 100.0% NativeBoth parents foreign-born 44,427 92.4% Native3,667 7.6% Foreign-bornOne native, one foreign-born parent 37,670 99.9% Native46 0.1% Foreign-bornChildren under 6 years - Living with one parent Native parent 57,098 99.4% Native373 0.6% Foreign-bornForeign-born parent 31,836 92.0% Native2,753 8.0% Foreign-bornChildren 6 to 17 years - Living with two parents Both parents native 78,644 99.8% Native140 0.2% Foreign-bornBoth parents foreign-born 129,315 88.5% Native16,809 11.5% Foreign-bornOne native, one foreign-born parent 59,774 98.2% Native1,075 1.8% Foreign-bornChildren 6 to 17 years - Living with one parent Native parent 85,433 100.0% NativeForeign-born parent 117,094 53.2% Native103,163 46.8% Foreign-born
Place of birth for residents in Los Angeles 875,225 Americas860,201 Latin America799,664 Central America440,608 Asia134,011 Eastern Asia133,570 South Eastern Asia100,344 South Central Asia87,330 Europe72,308 Western Asia46,744 South America46,200 China42,742 Eastern Europe29,592 Africa20,200 Western Europe18,706 Northern Europe15,023 Northern America13,792 Caribbean8,744 Northern Africa7,852 Western Africa7,361 Eastern Africa5,783 Oceania5,680 Southern Europe4,698 Australia and New Zealand Subregion3,192 Southern Africa1,876 Middle Africa465,933 Mexico170,962 El Salvador119,985 Guatemala94,021 Philippines76,283 Korea55,443 Iran37,700 Armenia34,896 China24,718 India21,981 Honduras19,587 Vietnam15,023 Canada12,689 Russia12,298 Peru11,931 Israel10,973 Thailand10,017 Japan9,867 Ukraine9,507 Belize8,153 Germany8,123 France7,802 Argentina7,077 Brazil6,885 Nicaragua6,882 United Kingdom6,815 Taiwan6,759 Colombia6,735 Lebanon6,462 Bangladesh6,243 Egypt5,561 Cuba5,545 England5,104 Nigeria4,489 Hong Kong4,199 Australia4,131 Chile4,014 Poland3,920 Jamaica3,727 Afghanistan3,526 Italy3,350 Ethiopia3,219 Syria3,192 South Africa3,186 Indonesia3,140 Romania3,077 Ecuador3,019 Venezuela2,972 Cambodia2,629 Pakistan2,567 Kazakhstan2,552 Turkey2,500 Hungary2,479 Iraq2,051 Saudi Arabia2,045 Sri Lanka1,873 Sweden1,738 Ireland1,656 Netherlands1,522 Czechoslovakia1,512 Ghana1,444 Costa Rica1,420 Uzbekistan1,406 Bulgaria1,355 Morocco1,330 Nepal1,259 Panama1,241 Latvia1,204 Bolivia1,183 Eritrea1,165 Malaysia1,152 Greece1,149 Scotland1,126 Belarus1,069 Kenya1,038 Congo1,035 Haiti1,022 Jordan983 Austria974 Denmark921 Uganda889 Singapore828 Serbia787 Croatia765 Dominican Republic753 Kuwait668 Switzerland662 Trinidad and Tobago615 Belgium605 Spain500 Moldova499 New Zealand475 Uruguay470 Fiji451 Burma424 Lithuania403 Bahamas373 Democratic Republic of Congo (Zaire)364 Senegal322 Laos314 Guyana290 Cameroon288 Zimbabwe244 Portugal225 Bosnia and Herzegovina174 Micronesia168 Liberia163 Norway149 Albania133 Sierra Leone132 Barbados118 Dominica71 West Indies52 St. Vincent and the Grenadines45 Sudan39 Yemen38 Somalia36 North Macedonia (Macedonia)
Grandparents responsible for own grandchildren in Los Angeles
Grandparents (30 to 59 years) White / Caucasian 2,777 24.0% Responsible for grandchildren8,812 76.0% Not responsible for grandchildrenBlack or African American 1,198 31.9% Responsible for grandchildren2,554 68.1% Not responsible for grandchildrenAmerican Indian / Alaska Native 366 54.5% Responsible for grandchildren306 45.5% Not responsible for grandchildrenAsian 414 32.4% Responsible for grandchildren866 67.6% Not responsible for grandchildrenNative Hawaiian / Pacific Islander 13 29.6% Responsible for grandchildren31 70.4% Not responsible for grandchildrenOther race 4,745 21.7% Responsible for grandchildren17,081 78.3% Not responsible for grandchildrenTwo or more races 925 38.5% Responsible for grandchildren1,480 61.5% Not responsible for grandchildrenWhite alone, not Hispanic / Latino 331 28.4% Responsible for grandchildren833 71.6% Not responsible for grandchildrenHispanic or Latino 8,280 22.7% Responsible for grandchildren28,216 77.3% Not responsible for grandchildrenGrandparents (60 years and over) White / Caucasian 4,152 18.6% Responsible for grandchildren18,118 81.4% Not responsible for grandchildrenBlack or African American 1,447 24.0% Responsible for grandchildren4,582 76.0% Not responsible for grandchildrenAmerican Indian / Alaska Native 155 40.4% Responsible for grandchildren228 59.6% Not responsible for grandchildrenAsian 1,432 16.2% Responsible for grandchildren7,385 83.8% Not responsible for grandchildrenNative Hawaiian / Pacific Islander 16 33.1% Responsible for grandchildren33 66.9% Not responsible for grandchildrenOther race 2,287 11.6% Responsible for grandchildren17,444 88.4% Not responsible for grandchildrenTwo or more races 223 3.4% Responsible for grandchildren6,343 96.6% Not responsible for grandchildrenWhite alone, not Hispanic / Latino 1,499 15.7% Responsible for grandchildren8,031 84.3% Not responsible for grandchildrenHispanic or Latino 5,887 15.8% Responsible for grandchildren31,315 84.2% Not responsible for grandchildren
Zip codes: 90003 , 90004 , 90005 , 90006 , 90007 , 90010 , 90011 , 90012 , 90013 , 90014 , 90015 , 90017 , 90018 , 90019 , 90020 , 90021 , 90024 , 90025 , 90026 , 90027 , 90028 , 90029 , 90031 , 90033 , 90034 , 90036 , 90037 , 90038 , 90041 , 90042 , 90043 , 90044 , 90046 , 90047 , 90048 , 90049 , 90057 , 90061 , 90062 , 90064 , 90065 , 90067 , 90068 , 90069 , 90071, 90077 , 90079, 90089 , 90090, 90094 , 90095, 90272 , 90275 , 90291 , 90293 , 90402 , 90405 , 90502 , 91040 , 91042 , 91105 , 91303 , 91304 , 91306 , 91311 , 91316 , 91324 , 91325 , 91326 , 91330 , 91331 , 91335 , 91340 , 91342 , 91343 , 91344 , 91345 , 91352 , 91356 , 91364 , 91367 , 91371, 91401 , 91402 , 91403 , 91405 , 91406 , 91411 , 91423 , 91436 , 91601 , 91602 , 91604 , 91606 , 91607 , 91608.