Races in Louisville, Colorado (CO) Detailed Stats
Data:
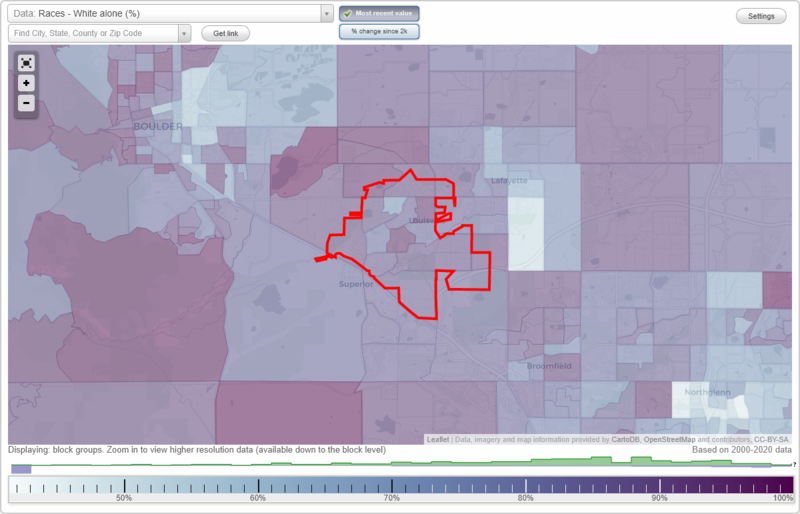
Races - White alone (%)
Races - White alone (% change since 2000)
Races - Black alone (%)
Races - Black alone (% change since 2000)
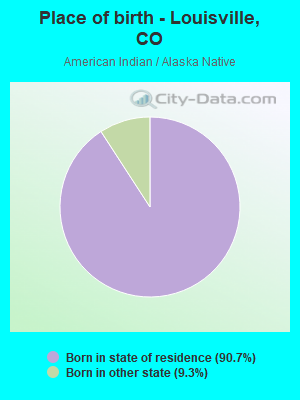
Races - American Indian alone (%)
Races - American Indian alone (% change since 2000)
Races - Asian alone (%)
Races - Asian alone (% change since 2000)
Races - Hispanic (%)
Races - Hispanic (% change since 2000)
Races - Native Hawaiian and Other Pacific Islander alone (%)
Races - Native Hawaiian and Other Pacific Islander alone (% change since 2000)
Races - Two or more races(%)
Races - Two or more races(% change since 2000)
Races - Other race alone (%)
Races - Other race alone (% change since 2000)
Racial diversity
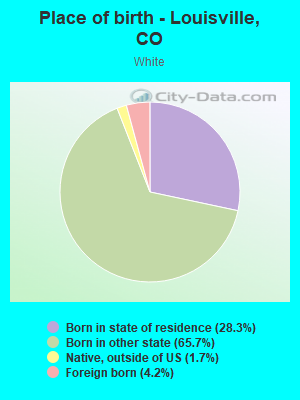
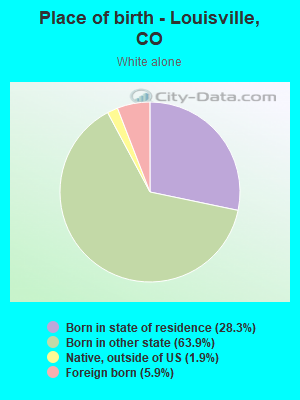
Place of birth - Born in state of residence (%)
Place of birth - Born in state of residence (%) - White
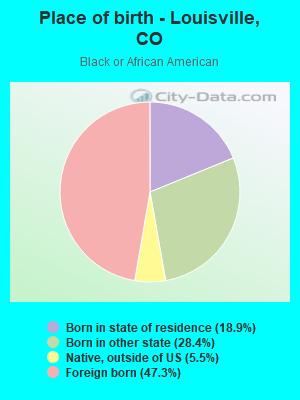
Place of birth - Born in state of residence (%) - Black or African American
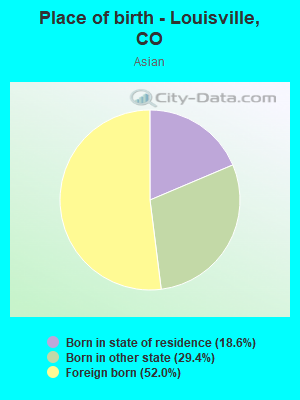
Place of birth - Born in state of residence (%) - Asian
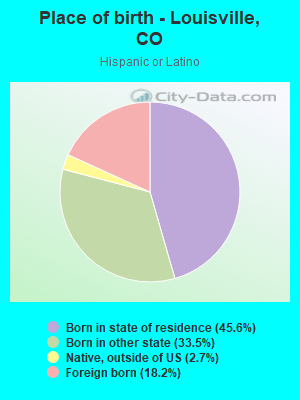
Place of birth - Born in state of residence (%) - Hispanic or Latino
Place of birth - Born in state of residence (%) - American Indian and Alaska Native
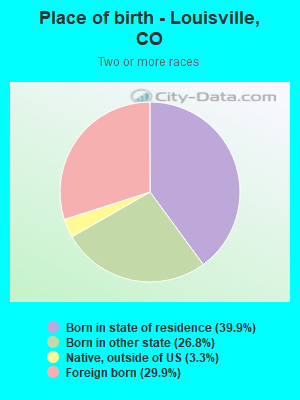
Place of birth - Born in state of residence (%) - Multirace
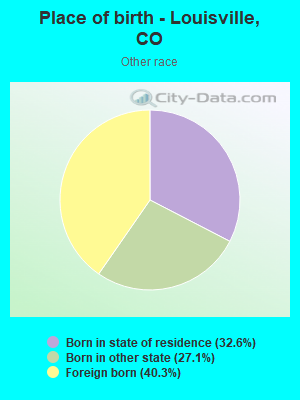
Place of birth - Born in state of residence (%) - Other Race
Place of birth - Born in other state (%)
Place of birth - Born in other state (%) - White
Place of birth - Born in other state (%) - Black or African American
Place of birth - Born in other state (%) - Asian
Place of birth - Born in other state (%) - Hispanic or Latino
Place of birth - Born in other state (%) - American Indian and Alaska Native
Place of birth - Born in other state (%) - Multirace
Place of birth - Born in other state (%) - Other Race
Place of birth - Native, outside of US (%)
Place of birth - Native, outside of US (%) - White
Place of birth - Native, outside of US (%) - Black or African American
Place of birth - Native, outside of US (%) - Asian
Place of birth - Native, outside of US (%) - Hispanic or Latino
Place of birth - Native, outside of US (%) - American Indian and Alaska Native
Place of birth - Native, outside of US (%) - Multirace
Place of birth - Native, outside of US (%) - Other Race
Place of birth - Foreign born (%)
Place of birth - Foreign born (%) - White
Place of birth - Foreign born (%) - Black or African American
Place of birth - Foreign born (%) - Asian
Place of birth - Foreign born (%) - Hispanic or Latino
Place of birth - Foreign born (%) - American Indian and Alaska Native
Place of birth - Foreign born (%) - Multirace
Place of birth - Foreign born (%) - Other Race
Residents speaking English at home (%)
Residents speaking English at home - Born in the United States (%)
Residents speaking English at home - Native, born elsewhere (%)
Residents speaking English at home - Foreign born (%)
Residents speaking Spanish at home (%)
Residents speaking Spanish at home - Born in the United States (%)
Residents speaking Spanish at home - Native, born elsewhere (%)
Residents speaking Spanish at home - Foreign born (%)
Residents speaking other language at home (%)
Residents speaking other language at home - Born in the United States (%)
Residents speaking other language at home - Native, born elsewhere (%)
Residents speaking other language at home - Foreign born (%)
Marital status - Never married (%)
Marital status - Now married (%)
Marital status - Separated (%)
Marital status - Widowed (%)
Marital status - Divorced (%)
Ancestries Reported - Arab (%)
Ancestries Reported - Czech (%)
Ancestries Reported - Danish (%)
Ancestries Reported - Dutch (%)
Ancestries Reported - English (%)
Ancestries Reported - French (%)
Ancestries Reported - French Canadian (%)
Ancestries Reported - German (%)
Ancestries Reported - Greek (%)
Ancestries Reported - Hungarian (%)
Ancestries Reported - Irish (%)
Ancestries Reported - Italian (%)
Ancestries Reported - Lithuanian (%)
Ancestries Reported - Norwegian (%)
Ancestries Reported - Polish (%)
Ancestries Reported - Portuguese (%)
Ancestries Reported - Russian (%)
Ancestries Reported - Scotch-Irish (%)
Ancestries Reported - Scottish (%)
Ancestries Reported - Slovak (%)
Ancestries Reported - Subsaharan African (%)
Ancestries Reported - Swedish (%)
Ancestries Reported - Swiss (%)
Ancestries Reported - Ukrainian (%)
Ancestries Reported - United States (%)
Ancestries Reported - Welsh (%)
Ancestries Reported - West Indian (%)
Ancestries Reported - Other (%)
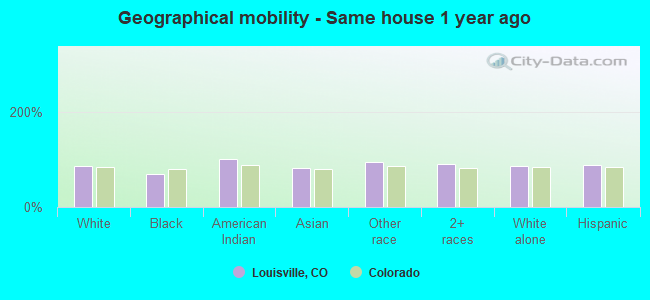
Geographical mobility - Same house 1 year ago (%)
Geographical mobility - Same house 1 year ago (%) - White
Geographical mobility - Same house 1 year ago (%) - Black or African American
Geographical mobility - Same house 1 year ago (%) - Asian
Geographical mobility - Same house 1 year ago (%) - Hispanic or Latino
Geographical mobility - Same house 1 year ago (%) - American Indian and Alaska Native
Geographical mobility - Same house 1 year ago (%) - Multirace
Geographical mobility - Same house 1 year ago (%) - Other Race
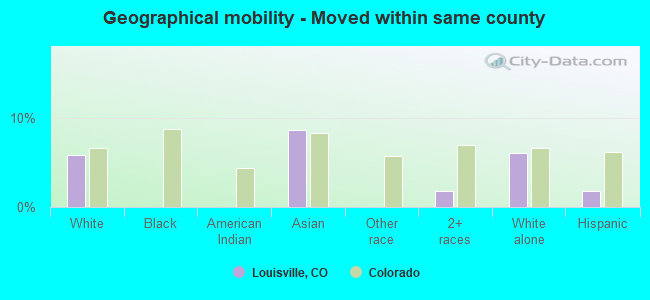
Geographical mobility - Moved within same county (%)
Geographical mobility - Moved within same county (%) - White
Geographical mobility - Moved within same county (%) - Black or African American
Geographical mobility - Moved within same county (%) - Asian
Geographical mobility - Moved within same county (%) - Hispanic or Latino
Geographical mobility - Moved within same county (%) - American Indian and Alaska Native
Geographical mobility - Moved within same county (%) - Multirace
Geographical mobility - Moved within same county (%) - Other Race
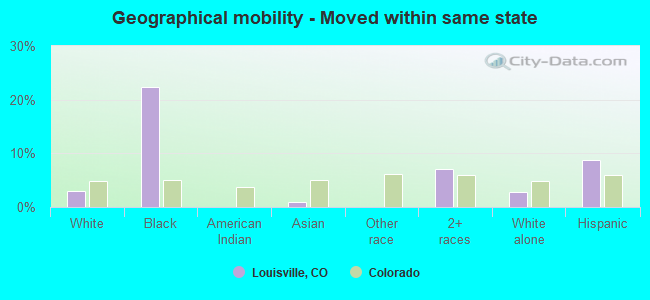
Geographical mobility - Moved from different county within same state (%)
Geographical mobility - Moved from different county within same state (%) - White
Geographical mobility - Moved from different county within same state (%) - Black or African American
Geographical mobility - Moved from different county within same state (%) - Asian
Geographical mobility - Moved from different county within same state (%) - Hispanic or Latino
Geographical mobility - Moved from different county within same state (%) - American Indian and Alaska Native
Geographical mobility - Moved from different county within same state (%) - Multirace
Geographical mobility - Moved from different county within same state (%) - Other Race
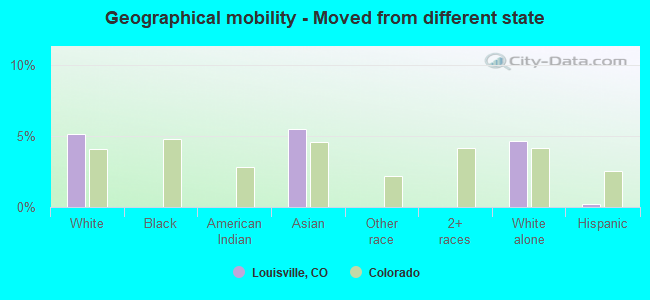
Geographical mobility - Moved from different state (%)
Geographical mobility - Moved from different state (%) - White
Geographical mobility - Moved from different state (%) - Black or African American
Geographical mobility - Moved from different state (%) - Asian
Geographical mobility - Moved from different state (%) - Hispanic or Latino
Geographical mobility - Moved from different state (%) - American Indian and Alaska Native
Geographical mobility - Moved from different state (%) - Multirace
Geographical mobility - Moved from different state (%) - Other Race
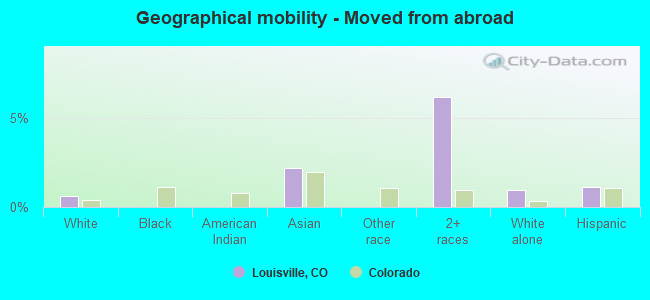
Geographical mobility - Moved from abroad (%)
Geographical mobility - Moved from abroad (%) - White
Geographical mobility - Moved from abroad (%) - Black or African American
Geographical mobility - Moved from abroad (%) - Asian
Geographical mobility - Moved from abroad (%) - Hispanic or Latino
Geographical mobility - Moved from abroad (%) - American Indian and Alaska Native
Geographical mobility - Moved from abroad (%) - Multirace
Geographical mobility - Moved from abroad (%) - Other Race
Place of birth for the foreign-born population - Ireland (%)
Place of birth for the foreign-born population - Denmark (%)
Place of birth for the foreign-born population - Norway (%)
Place of birth for the foreign-born population - Sweden (%)
Place of birth for the foreign-born population - United Kingdom (%)
Place of birth for the foreign-born population - England (%)
Place of birth for the foreign-born population - Scotland (%)
Place of birth for the foreign-born population - Other Northern Europe (%)
Place of birth for the foreign-born population - Austria (%)
Place of birth for the foreign-born population - Belgium (%)
Place of birth for the foreign-born population - France (%)
Place of birth for the foreign-born population - Germany (%)
Place of birth for the foreign-born population - Netherlands (%)
Place of birth for the foreign-born population - Switzerland (%)
Place of birth for the foreign-born population - Other Western Europe (%)
Place of birth for the foreign-born population - Greece (%)
Place of birth for the foreign-born population - Italy (%)
Place of birth for the foreign-born population - Portugal (%)
Place of birth for the foreign-born population - Spain (%)
Place of birth for the foreign-born population - Other Southern Europe (%)
Place of birth for the foreign-born population - Albania (%)
Place of birth for the foreign-born population - Belarus (%)
Place of birth for the foreign-born population - Bosnia and Herzegovina (%)
Place of birth for the foreign-born population - Bulgaria (%)
Place of birth for the foreign-born population - Croatia (%)
Place of birth for the foreign-born population - Czechoslovakia (%)
Place of birth for the foreign-born population - Hungary (%)
Place of birth for the foreign-born population - Latvia (%)
Place of birth for the foreign-born population - Lithuania (%)
Place of birth for the foreign-born population - North Macedonia (Macedonia) (%)
Place of birth for the foreign-born population - Moldova (%)
Place of birth for the foreign-born population - Poland (%)
Place of birth for the foreign-born population - Romania (%)
Place of birth for the foreign-born population - Russia (%)
Place of birth for the foreign-born population - Serbia (%)
Place of birth for the foreign-born population - Ukraine (%)
Place of birth for the foreign-born population - Other Eastern Europe (%)
Place of birth for the foreign-born population - China (%)
Place of birth for the foreign-born population - Hong Kong (%)
Place of birth for the foreign-born population - Taiwan (%)
Place of birth for the foreign-born population - Japan (%)
Place of birth for the foreign-born population - Korea (%)
Place of birth for the foreign-born population - Other Eastern Asia (%)
Place of birth for the foreign-born population - Afghanistan (%)
Place of birth for the foreign-born population - Bangladesh (%)
Place of birth for the foreign-born population - India (%)
Place of birth for the foreign-born population - Iran (%)
Place of birth for the foreign-born population - Kazakhstan (%)
Place of birth for the foreign-born population - Nepal (%)
Place of birth for the foreign-born population - Pakistan (%)
Place of birth for the foreign-born population - Sri Lanka (%)
Place of birth for the foreign-born population - Uzbekistan (%)
Place of birth for the foreign-born population - Other South Central Asia (%)
Place of birth for the foreign-born population - Burma (%)
Place of birth for the foreign-born population - Cambodia (%)
Place of birth for the foreign-born population - Indonesia (%)
Place of birth for the foreign-born population - Laos (%)
Place of birth for the foreign-born population - Malaysia (%)
Place of birth for the foreign-born population - Philippines (%)
Place of birth for the foreign-born population - Singapore (%)
Place of birth for the foreign-born population - Thailand (%)
Place of birth for the foreign-born population - Vietnam (%)
Place of birth for the foreign-born population - Other South Eastern Asia (%)
Place of birth for the foreign-born population - Armenia (%)
Place of birth for the foreign-born population - Iraq (%)
Place of birth for the foreign-born population - Israel (%)
Place of birth for the foreign-born population - Jordan (%)
Place of birth for the foreign-born population - Kuwait (%)
Place of birth for the foreign-born population - Lebanon (%)
Place of birth for the foreign-born population - Saudi Arabia (%)
Place of birth for the foreign-born population - Syria (%)
Place of birth for the foreign-born population - Turkey (%)
Place of birth for the foreign-born population - Yemen (%)
Place of birth for the foreign-born population - Other Western Asia (%)
Place of birth for the foreign-born population - Eritrea (%)
Place of birth for the foreign-born population - Ethiopia (%)
Place of birth for the foreign-born population - Kenya (%)
Place of birth for the foreign-born population - Somalia (%)
Place of birth for the foreign-born population - Uganda (%)
Place of birth for the foreign-born population - Zimbabwe (%)
Place of birth for the foreign-born population - Other Eastern Africa (%)
Place of birth for the foreign-born population - Cameroon (%)
Place of birth for the foreign-born population - Congo (%)
Place of birth for the foreign-born population - Democratic Republic of Congo (Zaire) (%)
Place of birth for the foreign-born population - Other Middle Africa (%)
Place of birth for the foreign-born population - Egypt (%)
Place of birth for the foreign-born population - Morocco (%)
Place of birth for the foreign-born population - Sudan (%)
Place of birth for the foreign-born population - Other Northern Africa (%)
Place of birth for the foreign-born population - South Africa (%)
Place of birth for the foreign-born population - Other Southern Africa (%)
Place of birth for the foreign-born population - Cabo Verde (%)
Place of birth for the foreign-born population - Ghana (%)
Place of birth for the foreign-born population - Liberia (%)
Place of birth for the foreign-born population - Nigeria (%)
Place of birth for the foreign-born population - Senegal (%)
Place of birth for the foreign-born population - Sierra Leone (%)
Place of birth for the foreign-born population - Other Western Africa (%)
Place of birth for the foreign-born population - Australia (%)
Place of birth for the foreign-born population - New Zealand (%)
Place of birth for the foreign-born population - Fiji (%)
Place of birth for the foreign-born population - Micronesia (%)
Place of birth for the foreign-born population - Bahamas (%)
Place of birth for the foreign-born population - Barbados (%)
Place of birth for the foreign-born population - Cuba (%)
Place of birth for the foreign-born population - Dominica (%)
Place of birth for the foreign-born population - Dominican Republic (%)
Place of birth for the foreign-born population - Grenada (%)
Place of birth for the foreign-born population - Haiti (%)
Place of birth for the foreign-born population - Jamaica (%)
Place of birth for the foreign-born population - St. Vincent and the Grenadines (%)
Place of birth for the foreign-born population - Trinidad and Tobago (%)
Place of birth for the foreign-born population - West Indies (%)
Place of birth for the foreign-born population - Other Caribbean (%)
Place of birth for the foreign-born population - Belize (%)
Place of birth for the foreign-born population - Costa Rica (%)
Place of birth for the foreign-born population - El Salvador (%)
Place of birth for the foreign-born population - Guatemala (%)
Place of birth for the foreign-born population - Honduras (%)
Place of birth for the foreign-born population - Mexico (%)
Place of birth for the foreign-born population - Nicaragua (%)
Place of birth for the foreign-born population - Panama (%)
Place of birth for the foreign-born population - Other Central America (%)
Place of birth for the foreign-born population - Argentina (%)
Place of birth for the foreign-born population - Bolivia (%)
Place of birth for the foreign-born population - Brazil (%)
Place of birth for the foreign-born population - Chile (%)
Place of birth for the foreign-born population - Colombia (%)
Place of birth for the foreign-born population - Ecuador (%)
Place of birth for the foreign-born population - Guyana (%)
Place of birth for the foreign-born population - Peru (%)
Place of birth for the foreign-born population - Uruguay (%)
Place of birth for the foreign-born population - Venezuela (%)
Place of birth for the foreign-born population - Other South America (%)
Place of birth for the foreign-born population - Canada (%)
Place of birth for the foreign-born population - Other Northern America (%)
Place of birth for the foreign-born population - Other (%)
Latest news about races in Louisville, CO collected exclusively by city-data.com from local newspapers, TV, and radio stations
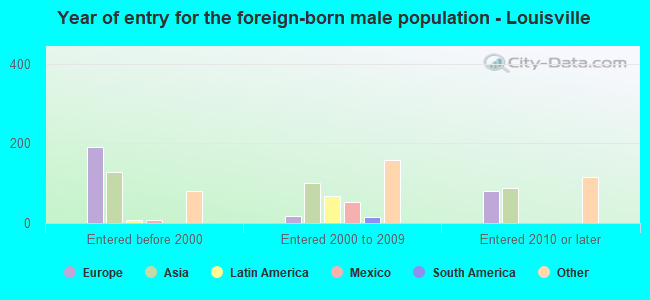
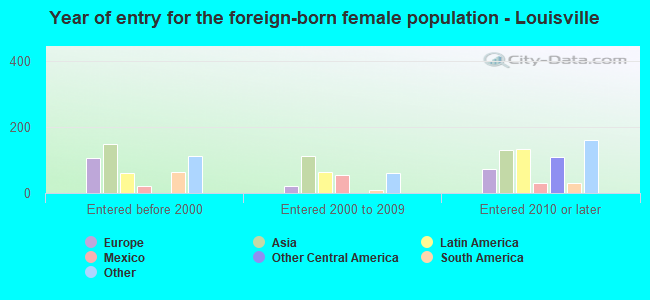
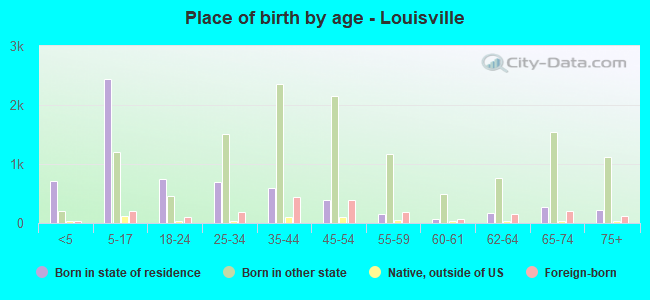
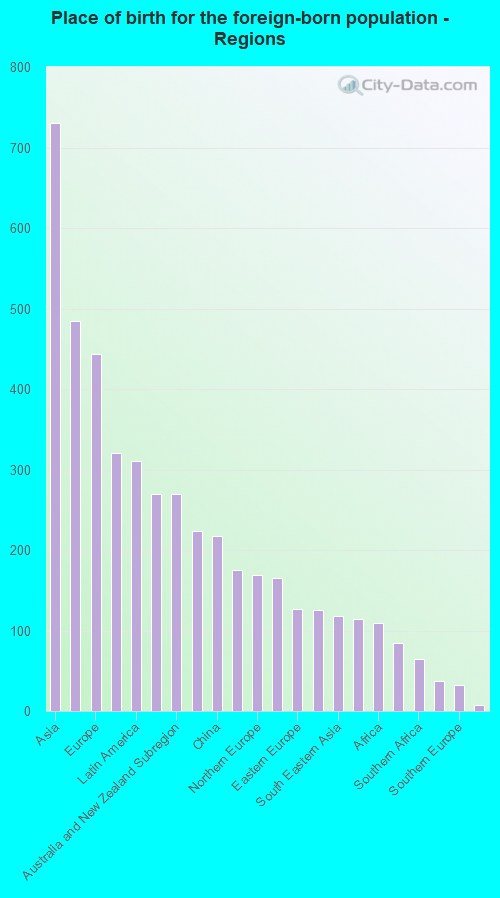
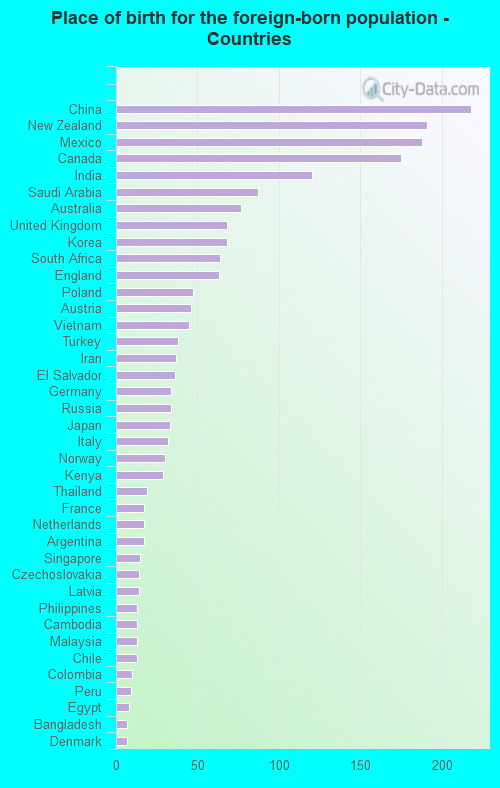
According to 2022 data, the most numerous races in Louisville, CO are White alone (18,074 residents), Hispanic (1,610 residents), and Two or more races (842 residents). 90.0% of Louisville residents speak English at home. 9.4% of Louisville, CO residents are foreign-born (3.4% born in Asia, 2.1% born in Europe, 1.5% born in Latin America, 1.3% born in Oceania), which is 4.2% greater than the foreign-born rate of 9.0% across the entire state of Colorado.
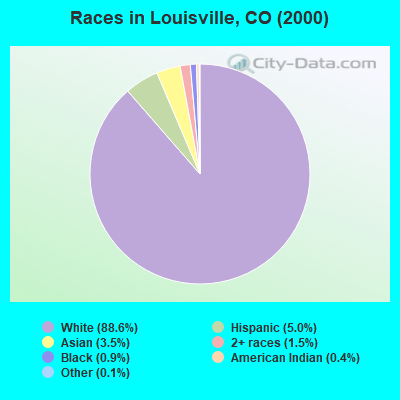
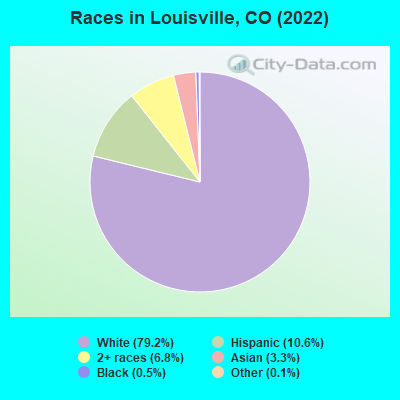
Race distribution in Louisville
2000 2022
3,202,880 74.5% White alone 735,601 17.1% Hispanic 158,443 3.7% Black alone 93,277 2.2% Asian alone 72,721 1.7% Two or more races 28,982 0.7% American Indian alone 5,512 0.1% Other race alone 3,845 0.09% Native Hawaiian and Other
3,793,270 65.0% White alone 1,314,962 22.5% Hispanic 268,754 4.6% Two or more races 220,756 3.8% Black alone 182,658 3.1% Asian alone 29,798 0.5% Other race alone 23,389 0.4% American Indian alone 6,339 0.1% Native Hawaiian and Other
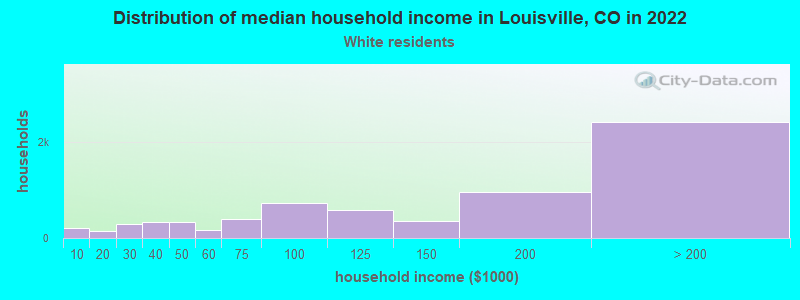
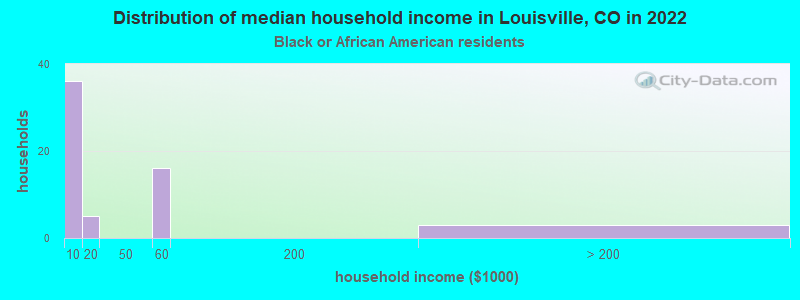
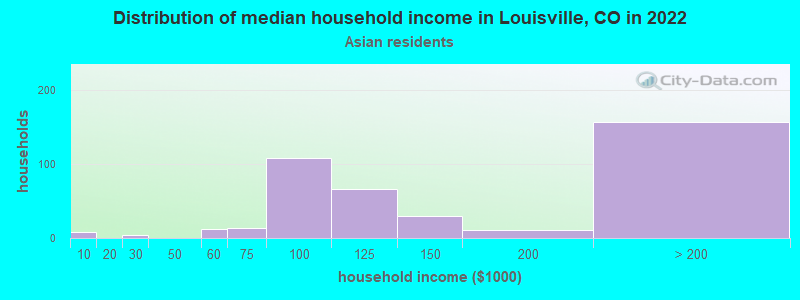
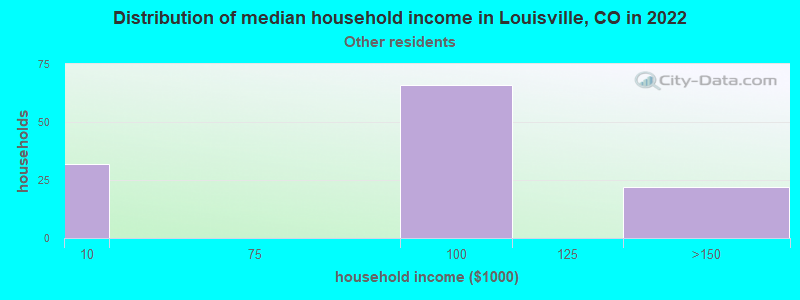
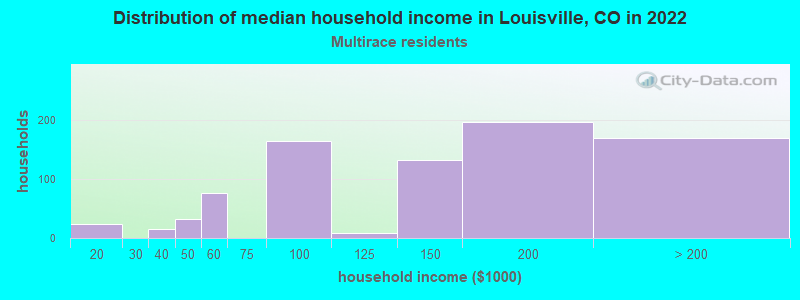
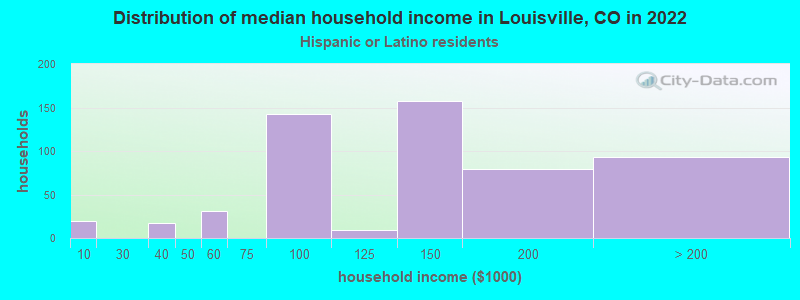
Income and house value in Louisville Median household income in 2022 $132,161 White non-Hispanic householders$152,211 Black householders$168,042 American Indian and Alaska Native householders$134,843 Asian householders$173,497 Native Hawaiian and other Pacific Islander householdersover $200,000 Some other race householders$68,395 Two or more races householders$102,469 Hispanic or Latino race householdersMedian 2022 house value $782,219 White Non-Hispanic householders$777,575 Black or African American householders$746,392 American Indian or Alaska Native householders $883,397 Asian householders$621,994 Native Hawaiian and other Pacific Islander householdersover $1,000,000 Some other race householders$721,513 Two or more races householders$904,628 Hispanic or Latino householders
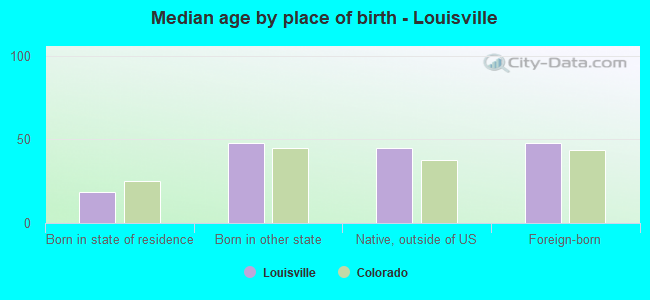
Median age by race in Louisville
43.9 Median age for White residents44.2 43.4 36.7 Median age for Black or African American residents34.2 44.2 2.7 Median age for American Indian / Alaska Native residents40.9 Median age for Asian residents46.5 37.0 29.8 Median age for Other race residents31.2 23.0 41.0 Median age for Two or more races residents21.1 58.8 43.7 Median age for White alone residents44.5 43.3 28.0 Median age for Hispanic or Latino residents26.1 37.9
Owner/renter occupied households by race in Louisville
House owners and renters - White residents 5,521 71.9% Owner occupied2,161 28.1% Renter occupiedHouse owners and renters - Black or African American residents 56 81.0% Owner occupied13 19.0% Renter occupiedHouse owners and renters - American Indian / Alaska Native residents 13 100.0% Owner occupiedHouse owners and renters - Asian residents 449 82.6% Owner occupied94 17.4% Renter occupiedHouse owners and renters - Other race residents 92 100.0% Renter occupiedHouse owners and renters - Two or more races residents 455 65.8% Owner occupied237 34.2% Renter occupiedHouse owners and renters - White alone residents 5,513 71.4% Owner occupied2,206 28.6% Renter occupiedHouse owners and renters - Hispanic or Latino residents 246 51.4% Owner occupied233 48.6% Renter occupied
Language usage in Louisville
English speakers - Total 90.0% of residents of Louisville speak English at home.
2.2% of residents speak Spanish at home 327 73.3% Speak English very well119 26.7% Speak English less than very well8.3% of residents speak other language at home 1,149 67.1% Speak English very well564 32.9% Speak English less than very well
English speakers - Born in the United States 94.8% of residents of Louisville speak English at home.
0.7% of residents speak Spanish at home 67 80.7% Speak English very well16 19.3% Speak English less than very well4.4% of residents speak other language at home 417 75.8% Speak English very well133 24.2% Speak English less than very well
English speakers - Native, born elsewhere 89.5% of residents of Louisville speak English at home.
4.5% of residents speak Spanish at home 20 100.0% Speak English very well5.7% of residents speak other language at home 25 100.0% Speak English very well
English speakers - Foreign-born 49.6% of residents of Louisville speak English at home.
11.4% of residents speak Spanish at home 129 56.1% Speak English very well101 43.9% Speak English less than very well42.9% of residents speak other language at home 474 55.0% Speak English very well388 45.0% Speak English less than very well
White (Caucasian) - Speak only English Native:
98.3% (16,030)Foreign-born:
92.1% (691)
White (Caucasian) - Speak another language Native:
3.1% (504)Foreign-born:
33.2% (249)
Black or African American - Speak only English Native:
98.2% (86)Foreign-born:
91.1% (71)
Asian - Speak only English Native:
65.0% (393)Foreign-born:
15.3% (94)
Asian - Speak another language Native:
35.2% (213)Foreign-born:
85.0% (520)
Other race - Speak another language Native:
16.7% (40)Foreign-born:
95.1% (147)
Two or more races - Speak only English Native:
84.5% (1,246)Foreign-born:
32.9% (206)
Two or more races - Speak another language Native:
5.0% (74)Foreign-born:
46.8% (294)
White alone - Speak only English Native:
95.6% (15,422)Foreign-born:
65.6% (650)
White alone - Speak another language Native:
4.2% (672)Foreign-born:
33.7% (334)
Hispanic or Latino - Speak only English Native:
100.0% (1,226)Foreign-born:
59.3% (166)
Hispanic or Latino - Speak another language Native:
8.6% (105)Foreign-born:
67.2% (188)
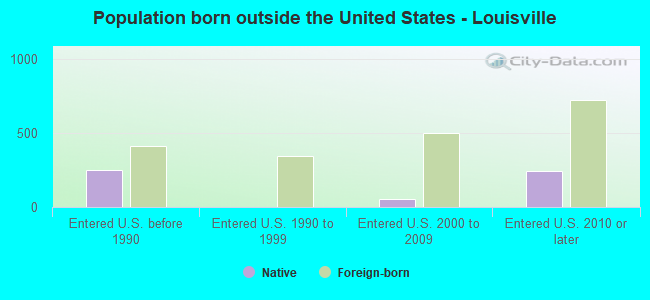
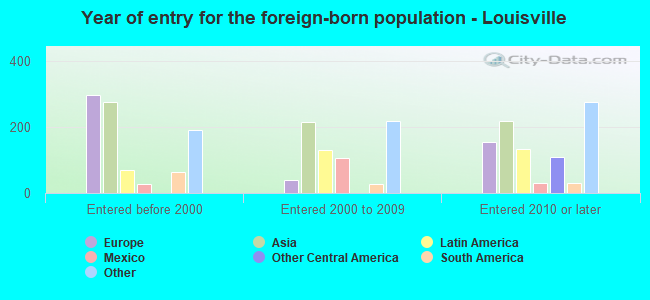
Foreign-born residents in Louisville 2,039 residents are foreign born (3.4% Asia , 2.1% Europe , 1.5% Latin America , 1.3% Oceania ).
This city:
9.4%Colorado:
100.0%
Marital status for residents in Louisville Marital status - White (Caucasian) population 15 years and over
Males 27.9% Never married58.4% Now married0.4% Separated2.8% Widowed10.6% DivorcedFemales 23.1% Never married55.4% Now married0.6% Separated6.8% Widowed14.0% DivorcedWomen who gave birth in the past 12 months Now married:
100.0% (127)Unmarried:
0.0% (0)
Women who did not give birth in the past 12 months Now married:
55.3% (2,070)Unmarried:
44.7% (1,673)
Marital status - Black or African American population 15 years and over
Males 15.6% Never married84.4% Now married0.0% Separated0.0% Widowed0.0% DivorcedFemales 28.8% Never married71.2% Now married0.0% Separated0.0% Widowed0.0% DivorcedWomen who did not give birth in the past 12 months Now married:
92.6% (26)Unmarried:
7.4% (2)
Marital status - Asian population 15 years and over
Males 31.1% Never married64.3% Now married0.0% Separated0.0% Widowed4.6% DivorcedFemales 24.0% Never married61.8% Now married0.0% Separated3.5% Widowed10.8% DivorcedWomen who gave birth in the past 12 months Now married:
100.0% (12)Unmarried:
0.0% (0)
Women who did not give birth in the past 12 months Now married:
58.6% (232)Unmarried:
41.4% (163)
Marital status - Other race population 15 years and over
Males 0.0% Never married33.1% Now married0.0% Separated0.0% Widowed66.9% DivorcedFemales 27.8% Never married72.2% Now married0.0% Separated0.0% Widowed0.0% DivorcedWomen who did not give birth in the past 12 months Now married:
63.0% (56)Unmarried:
37.0% (33)
Marital status - Two or more races population 15 years and over
Males 49.6% Never married31.9% Now married0.0% Separated0.0% Widowed18.5% DivorcedFemales 13.7% Never married56.8% Now married5.0% Separated12.0% Widowed12.4% DivorcedWomen who gave birth in the past 12 months Now married:
100.0% (95)Unmarried:
0.0% (0)
Women who did not give birth in the past 12 months Now married:
90.5% (289)Unmarried:
9.5% (30)
Marital status - White alone, not Hispanic / Latino population 15 years and over
Males 26.9% Never married59.1% Now married0.4% Separated2.9% Widowed10.7% DivorcedFemales 23.1% Never married54.6% Now married0.7% Separated7.1% Widowed14.5% DivorcedWomen who gave birth in the past 12 months Now married:
100.0% (119)Unmarried:
0.0% (0)
Women who did not give birth in the past 12 months Now married:
54.9% (2,091)Unmarried:
45.1% (1,721)
Marital status - Hispanic or Latino population 15 years and over
Males 34.9% Never married39.7% Now married0.0% Separated0.0% Widowed25.3% DivorcedFemales 17.7% Never married73.1% Now married0.0% Separated2.4% Widowed6.9% DivorcedWomen who gave birth in the past 12 months Now married:
100.0% (17)Unmarried:
0.0% (0)
Women who did not give birth in the past 12 months Now married:
74.0% (214)Unmarried:
26.0% (75)
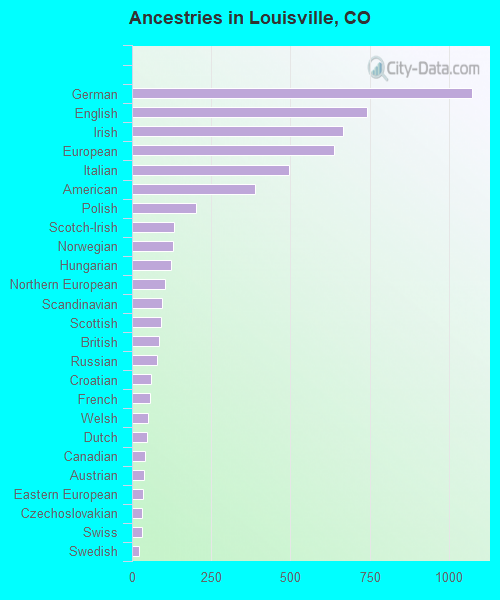
Ancestries in Louisville
946 11.0% English914 10.7% European702 8.2% German679 7.9% Irish610 7.1% American395 4.6% Italian260 3.0% Norwegian200 2.3% Scotch-Irish185 2.2% Scottish170 2.0% Greek158 1.8% Polish153 1.8% British129 1.5% Russian99 1.2% Eastern European97 1.1% Dutch88 1.0% Northern European77 0.9% French72 0.8% Arab68 0.8% Swedish63 0.7% Slovene55 0.6% South African40 0.5% Scandinavian39 0.5% Swiss38 0.4% Czech36 0.4% Iranian35 0.4% Canadian34 0.4% French Canadian33 0.4% Danish30 0.4% Australian26 0.3% Latvian25 0.3% Croatian21 0.2% Finnish21 0.2% Turkish18 0.2% Austrian15 0.2% Ukrainian14 0.2% Hungarian14 0.2% Welsh10 0.1% Lithuanian9 0.1% Czechoslovakian8 0.09% Basque8 0.09% Serbian7 0.08% Lebanese6 0.07% Portuguese5 0.06% Slovak
Geographical mobility in Louisville Same house 1 year ago 15,029 85.2% White (Caucasian)136 70.2% Black or African American29 100.0% American Indian / Alaska Native969 81.6% Asian373 94.1% Other race1,594 89.7% Two or more races15,160 85.8% White alone, not Hispanic / Latino1,345 88.8% Hispanic or LatinoMoved within same county 1,029 5.8% White / Caucasian102 8.6% Asian31 1.7% Two or more races1,058 6.0% White alone, not Hispanic / Latino26 1.7% Hispanic or LatinoMoved within same state 539 3.1% White / Caucasian43 22.3% Black or African American12 1.0% Asian126 7.1% Two or more races485 2.7% White alone, not Hispanic / Latino134 8.8% Hispanic or LatinoMoved from different state 900 5.1% White / Caucasian65 5.5% Asian823 4.7% White alone, not Hispanic / Latino3 0.2% Hispanic or LatinoMoved from abroad 113 0.6% White26 2.2% Asian109 6.1% Two or more races171 1.0% White alone, not Hispanic / Latino17 1.1% Hispanic or Latino
Children Nativity (place of birth) in Louisville
Children under 6 years - Living with two parents Both parents native 826 100.0% NativeBoth parents foreign-born 11 34.2% Native22 65.8% Foreign-bornOne native, one foreign-born parent 158 100.0% NativeChildren under 6 years - Living with one parent Native parent 128 100.0% NativeChildren 6 to 17 years - Living with two parents Both parents native 2,213 100.0% NativeBoth parents foreign-born 82 43.7% Native106 56.3% Foreign-bornOne native, one foreign-born parent 400 88.3% Native53 11.7% Foreign-bornChildren 6 to 17 years - Living with one parent Native parent 670 100.0% NativeForeign-born parent 116 50.5% Native113 49.5% Foreign-born
Grandparents responsible for own grandchildren in Louisville
Grandparents (30 to 59 years) White / Caucasian 7 21.1% Responsible for grandchildren28 78.9% Not responsible for grandchildrenWhite alone, not Hispanic / Latino 7 16.4% Responsible for grandchildren37 83.6% Not responsible for grandchildrenGrandparents (60 years and over) White / Caucasian 12 14.1% Responsible for grandchildren76 85.9% Not responsible for grandchildrenWhite alone, not Hispanic / Latino 16 16.0% Responsible for grandchildren82 84.0% Not responsible for grandchildren