Races in Lovettsville, Virginia (VA) Detailed Stats
Data:
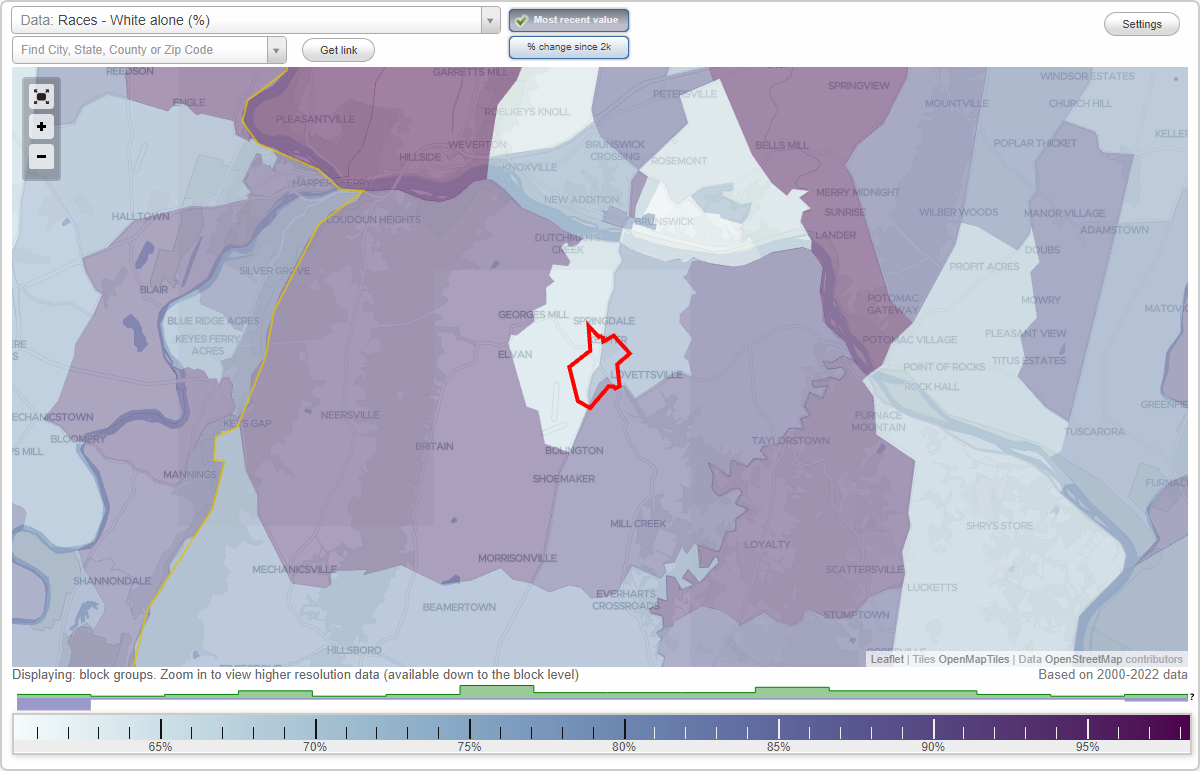
Races - White alone (%)
Races - White alone (% change since 2000)
Races - Black alone (%)
Races - Black alone (% change since 2000)
Races - American Indian alone (%)
Races - American Indian alone (% change since 2000)
Races - Asian alone (%)
Races - Asian alone (% change since 2000)
Races - Hispanic (%)
Races - Hispanic (% change since 2000)
Races - Native Hawaiian and Other Pacific Islander alone (%)
Races - Native Hawaiian and Other Pacific Islander alone (% change since 2000)
Races - Two or more races(%)
Races - Two or more races(% change since 2000)
Races - Other race alone (%)
Races - Other race alone (% change since 2000)
Racial diversity
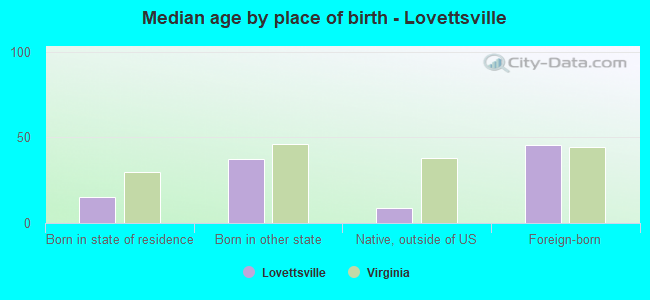
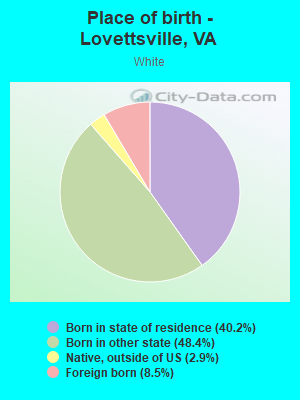
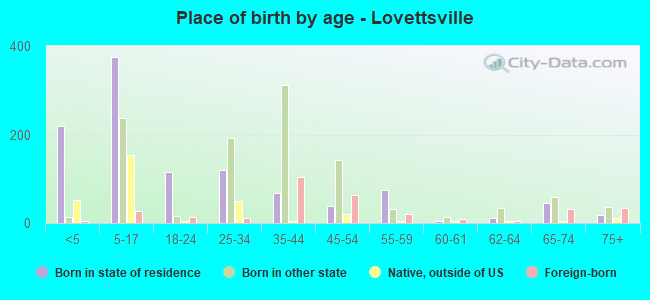
Place of birth - Born in state of residence (%)
Place of birth - Born in state of residence (%) - White
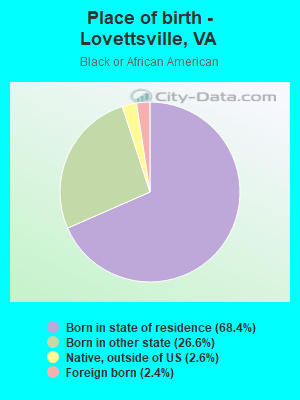
Place of birth - Born in state of residence (%) - Black or African American
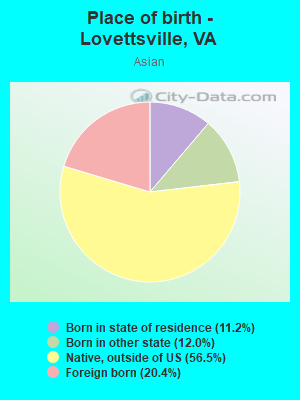
Place of birth - Born in state of residence (%) - Asian
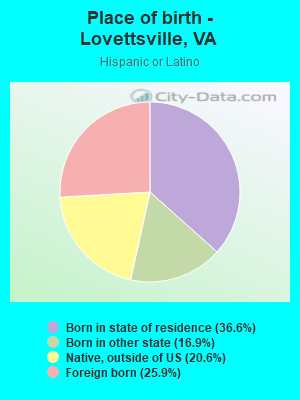
Place of birth - Born in state of residence (%) - Hispanic or Latino
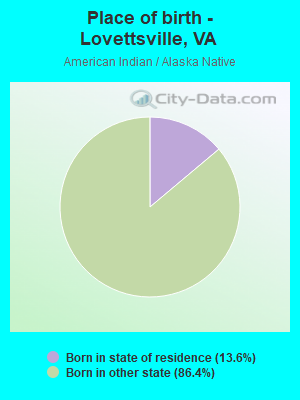
Place of birth - Born in state of residence (%) - American Indian and Alaska Native
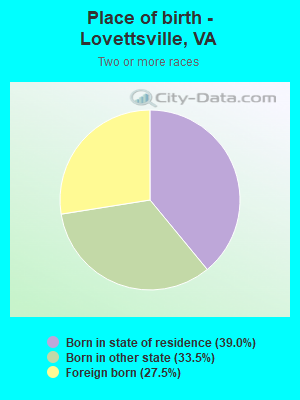
Place of birth - Born in state of residence (%) - Multirace
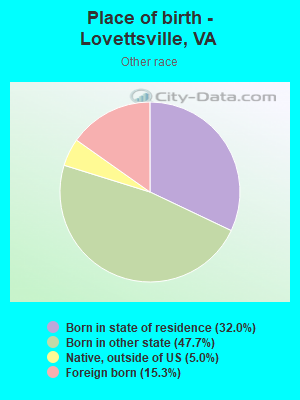
Place of birth - Born in state of residence (%) - Other Race
Place of birth - Born in other state (%)
Place of birth - Born in other state (%) - White
Place of birth - Born in other state (%) - Black or African American
Place of birth - Born in other state (%) - Asian
Place of birth - Born in other state (%) - Hispanic or Latino
Place of birth - Born in other state (%) - American Indian and Alaska Native
Place of birth - Born in other state (%) - Multirace
Place of birth - Born in other state (%) - Other Race
Place of birth - Native, outside of US (%)
Place of birth - Native, outside of US (%) - White
Place of birth - Native, outside of US (%) - Black or African American
Place of birth - Native, outside of US (%) - Asian
Place of birth - Native, outside of US (%) - Hispanic or Latino
Place of birth - Native, outside of US (%) - American Indian and Alaska Native
Place of birth - Native, outside of US (%) - Multirace
Place of birth - Native, outside of US (%) - Other Race
Place of birth - Foreign born (%)
Place of birth - Foreign born (%) - White
Place of birth - Foreign born (%) - Black or African American
Place of birth - Foreign born (%) - Asian
Place of birth - Foreign born (%) - Hispanic or Latino
Place of birth - Foreign born (%) - American Indian and Alaska Native
Place of birth - Foreign born (%) - Multirace
Place of birth - Foreign born (%) - Other Race
Residents speaking English at home (%)
Residents speaking English at home - Born in the United States (%)
Residents speaking English at home - Native, born elsewhere (%)
Residents speaking English at home - Foreign born (%)
Residents speaking Spanish at home (%)
Residents speaking Spanish at home - Born in the United States (%)
Residents speaking Spanish at home - Native, born elsewhere (%)
Residents speaking Spanish at home - Foreign born (%)
Residents speaking other language at home (%)
Residents speaking other language at home - Born in the United States (%)
Residents speaking other language at home - Native, born elsewhere (%)
Residents speaking other language at home - Foreign born (%)
Marital status - Never married (%)
Marital status - Now married (%)
Marital status - Separated (%)
Marital status - Widowed (%)
Marital status - Divorced (%)
Ancestries Reported - Arab (%)
Ancestries Reported - Czech (%)
Ancestries Reported - Danish (%)
Ancestries Reported - Dutch (%)
Ancestries Reported - English (%)
Ancestries Reported - French (%)
Ancestries Reported - French Canadian (%)
Ancestries Reported - German (%)
Ancestries Reported - Greek (%)
Ancestries Reported - Hungarian (%)
Ancestries Reported - Irish (%)
Ancestries Reported - Italian (%)
Ancestries Reported - Lithuanian (%)
Ancestries Reported - Norwegian (%)
Ancestries Reported - Polish (%)
Ancestries Reported - Portuguese (%)
Ancestries Reported - Russian (%)
Ancestries Reported - Scotch-Irish (%)
Ancestries Reported - Scottish (%)
Ancestries Reported - Slovak (%)
Ancestries Reported - Subsaharan African (%)
Ancestries Reported - Swedish (%)
Ancestries Reported - Swiss (%)
Ancestries Reported - Ukrainian (%)
Ancestries Reported - United States (%)
Ancestries Reported - Welsh (%)
Ancestries Reported - West Indian (%)
Ancestries Reported - Other (%)
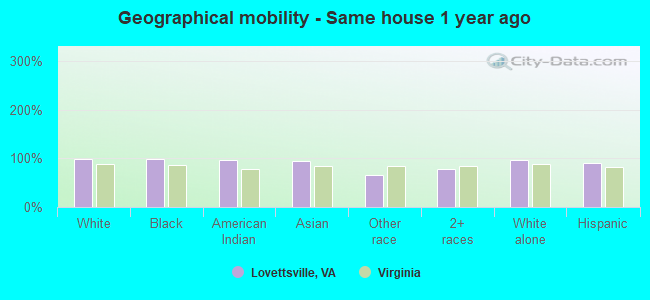
Geographical mobility - Same house 1 year ago (%)
Geographical mobility - Same house 1 year ago (%) - White
Geographical mobility - Same house 1 year ago (%) - Black or African American
Geographical mobility - Same house 1 year ago (%) - Asian
Geographical mobility - Same house 1 year ago (%) - Hispanic or Latino
Geographical mobility - Same house 1 year ago (%) - American Indian and Alaska Native
Geographical mobility - Same house 1 year ago (%) - Multirace
Geographical mobility - Same house 1 year ago (%) - Other Race
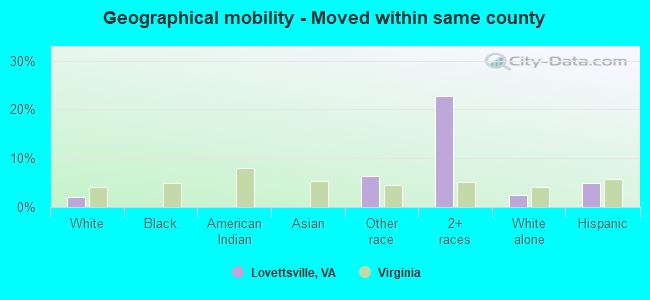
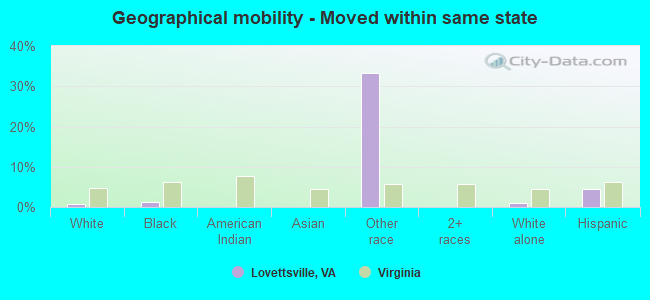
Geographical mobility - Moved within same county (%)
Geographical mobility - Moved within same county (%) - White
Geographical mobility - Moved within same county (%) - Black or African American
Geographical mobility - Moved within same county (%) - Asian
Geographical mobility - Moved within same county (%) - Hispanic or Latino
Geographical mobility - Moved within same county (%) - American Indian and Alaska Native
Geographical mobility - Moved within same county (%) - Multirace
Geographical mobility - Moved within same county (%) - Other Race
Geographical mobility - Moved from different county within same state (%)
Geographical mobility - Moved from different county within same state (%) - White
Geographical mobility - Moved from different county within same state (%) - Black or African American
Geographical mobility - Moved from different county within same state (%) - Asian
Geographical mobility - Moved from different county within same state (%) - Hispanic or Latino
Geographical mobility - Moved from different county within same state (%) - American Indian and Alaska Native
Geographical mobility - Moved from different county within same state (%) - Multirace
Geographical mobility - Moved from different county within same state (%) - Other Race
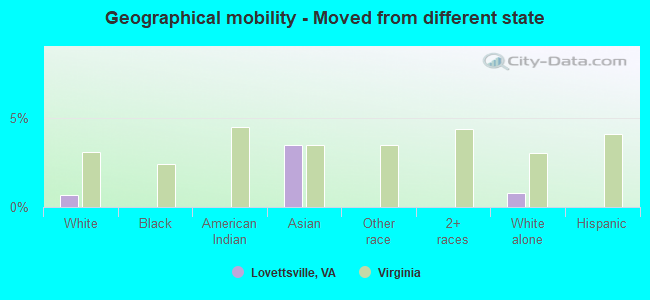
Geographical mobility - Moved from different state (%)
Geographical mobility - Moved from different state (%) - White
Geographical mobility - Moved from different state (%) - Black or African American
Geographical mobility - Moved from different state (%) - Asian
Geographical mobility - Moved from different state (%) - Hispanic or Latino
Geographical mobility - Moved from different state (%) - American Indian and Alaska Native
Geographical mobility - Moved from different state (%) - Multirace
Geographical mobility - Moved from different state (%) - Other Race
Geographical mobility - Moved from abroad (%)
Geographical mobility - Moved from abroad (%) - White
Geographical mobility - Moved from abroad (%) - Black or African American
Geographical mobility - Moved from abroad (%) - Asian
Geographical mobility - Moved from abroad (%) - Hispanic or Latino
Geographical mobility - Moved from abroad (%) - American Indian and Alaska Native
Geographical mobility - Moved from abroad (%) - Multirace
Geographical mobility - Moved from abroad (%) - Other Race
Place of birth for the foreign-born population - Ireland (%)
Place of birth for the foreign-born population - Denmark (%)
Place of birth for the foreign-born population - Norway (%)
Place of birth for the foreign-born population - Sweden (%)
Place of birth for the foreign-born population - United Kingdom (%)
Place of birth for the foreign-born population - England (%)
Place of birth for the foreign-born population - Scotland (%)
Place of birth for the foreign-born population - Other Northern Europe (%)
Place of birth for the foreign-born population - Austria (%)
Place of birth for the foreign-born population - Belgium (%)
Place of birth for the foreign-born population - France (%)
Place of birth for the foreign-born population - Germany (%)
Place of birth for the foreign-born population - Netherlands (%)
Place of birth for the foreign-born population - Switzerland (%)
Place of birth for the foreign-born population - Other Western Europe (%)
Place of birth for the foreign-born population - Greece (%)
Place of birth for the foreign-born population - Italy (%)
Place of birth for the foreign-born population - Portugal (%)
Place of birth for the foreign-born population - Spain (%)
Place of birth for the foreign-born population - Other Southern Europe (%)
Place of birth for the foreign-born population - Albania (%)
Place of birth for the foreign-born population - Belarus (%)
Place of birth for the foreign-born population - Bosnia and Herzegovina (%)
Place of birth for the foreign-born population - Bulgaria (%)
Place of birth for the foreign-born population - Croatia (%)
Place of birth for the foreign-born population - Czechoslovakia (%)
Place of birth for the foreign-born population - Hungary (%)
Place of birth for the foreign-born population - Latvia (%)
Place of birth for the foreign-born population - Lithuania (%)
Place of birth for the foreign-born population - North Macedonia (Macedonia) (%)
Place of birth for the foreign-born population - Moldova (%)
Place of birth for the foreign-born population - Poland (%)
Place of birth for the foreign-born population - Romania (%)
Place of birth for the foreign-born population - Russia (%)
Place of birth for the foreign-born population - Serbia (%)
Place of birth for the foreign-born population - Ukraine (%)
Place of birth for the foreign-born population - Other Eastern Europe (%)
Place of birth for the foreign-born population - China (%)
Place of birth for the foreign-born population - Hong Kong (%)
Place of birth for the foreign-born population - Taiwan (%)
Place of birth for the foreign-born population - Japan (%)
Place of birth for the foreign-born population - Korea (%)
Place of birth for the foreign-born population - Other Eastern Asia (%)
Place of birth for the foreign-born population - Afghanistan (%)
Place of birth for the foreign-born population - Bangladesh (%)
Place of birth for the foreign-born population - India (%)
Place of birth for the foreign-born population - Iran (%)
Place of birth for the foreign-born population - Kazakhstan (%)
Place of birth for the foreign-born population - Nepal (%)
Place of birth for the foreign-born population - Pakistan (%)
Place of birth for the foreign-born population - Sri Lanka (%)
Place of birth for the foreign-born population - Uzbekistan (%)
Place of birth for the foreign-born population - Other South Central Asia (%)
Place of birth for the foreign-born population - Burma (%)
Place of birth for the foreign-born population - Cambodia (%)
Place of birth for the foreign-born population - Indonesia (%)
Place of birth for the foreign-born population - Laos (%)
Place of birth for the foreign-born population - Malaysia (%)
Place of birth for the foreign-born population - Philippines (%)
Place of birth for the foreign-born population - Singapore (%)
Place of birth for the foreign-born population - Thailand (%)
Place of birth for the foreign-born population - Vietnam (%)
Place of birth for the foreign-born population - Other South Eastern Asia (%)
Place of birth for the foreign-born population - Armenia (%)
Place of birth for the foreign-born population - Iraq (%)
Place of birth for the foreign-born population - Israel (%)
Place of birth for the foreign-born population - Jordan (%)
Place of birth for the foreign-born population - Kuwait (%)
Place of birth for the foreign-born population - Lebanon (%)
Place of birth for the foreign-born population - Saudi Arabia (%)
Place of birth for the foreign-born population - Syria (%)
Place of birth for the foreign-born population - Turkey (%)
Place of birth for the foreign-born population - Yemen (%)
Place of birth for the foreign-born population - Other Western Asia (%)
Place of birth for the foreign-born population - Eritrea (%)
Place of birth for the foreign-born population - Ethiopia (%)
Place of birth for the foreign-born population - Kenya (%)
Place of birth for the foreign-born population - Somalia (%)
Place of birth for the foreign-born population - Uganda (%)
Place of birth for the foreign-born population - Zimbabwe (%)
Place of birth for the foreign-born population - Other Eastern Africa (%)
Place of birth for the foreign-born population - Cameroon (%)
Place of birth for the foreign-born population - Congo (%)
Place of birth for the foreign-born population - Democratic Republic of Congo (Zaire) (%)
Place of birth for the foreign-born population - Other Middle Africa (%)
Place of birth for the foreign-born population - Egypt (%)
Place of birth for the foreign-born population - Morocco (%)
Place of birth for the foreign-born population - Sudan (%)
Place of birth for the foreign-born population - Other Northern Africa (%)
Place of birth for the foreign-born population - South Africa (%)
Place of birth for the foreign-born population - Other Southern Africa (%)
Place of birth for the foreign-born population - Cabo Verde (%)
Place of birth for the foreign-born population - Ghana (%)
Place of birth for the foreign-born population - Liberia (%)
Place of birth for the foreign-born population - Nigeria (%)
Place of birth for the foreign-born population - Senegal (%)
Place of birth for the foreign-born population - Sierra Leone (%)
Place of birth for the foreign-born population - Other Western Africa (%)
Place of birth for the foreign-born population - Australia (%)
Place of birth for the foreign-born population - New Zealand (%)
Place of birth for the foreign-born population - Fiji (%)
Place of birth for the foreign-born population - Micronesia (%)
Place of birth for the foreign-born population - Bahamas (%)
Place of birth for the foreign-born population - Barbados (%)
Place of birth for the foreign-born population - Cuba (%)
Place of birth for the foreign-born population - Dominica (%)
Place of birth for the foreign-born population - Dominican Republic (%)
Place of birth for the foreign-born population - Grenada (%)
Place of birth for the foreign-born population - Haiti (%)
Place of birth for the foreign-born population - Jamaica (%)
Place of birth for the foreign-born population - St. Vincent and the Grenadines (%)
Place of birth for the foreign-born population - Trinidad and Tobago (%)
Place of birth for the foreign-born population - West Indies (%)
Place of birth for the foreign-born population - Other Caribbean (%)
Place of birth for the foreign-born population - Belize (%)
Place of birth for the foreign-born population - Costa Rica (%)
Place of birth for the foreign-born population - El Salvador (%)
Place of birth for the foreign-born population - Guatemala (%)
Place of birth for the foreign-born population - Honduras (%)
Place of birth for the foreign-born population - Mexico (%)
Place of birth for the foreign-born population - Nicaragua (%)
Place of birth for the foreign-born population - Panama (%)
Place of birth for the foreign-born population - Other Central America (%)
Place of birth for the foreign-born population - Argentina (%)
Place of birth for the foreign-born population - Bolivia (%)
Place of birth for the foreign-born population - Brazil (%)
Place of birth for the foreign-born population - Chile (%)
Place of birth for the foreign-born population - Colombia (%)
Place of birth for the foreign-born population - Ecuador (%)
Place of birth for the foreign-born population - Guyana (%)
Place of birth for the foreign-born population - Peru (%)
Place of birth for the foreign-born population - Uruguay (%)
Place of birth for the foreign-born population - Venezuela (%)
Place of birth for the foreign-born population - Other South America (%)
Place of birth for the foreign-born population - Canada (%)
Place of birth for the foreign-born population - Other Northern America (%)
Place of birth for the foreign-born population - Other (%)
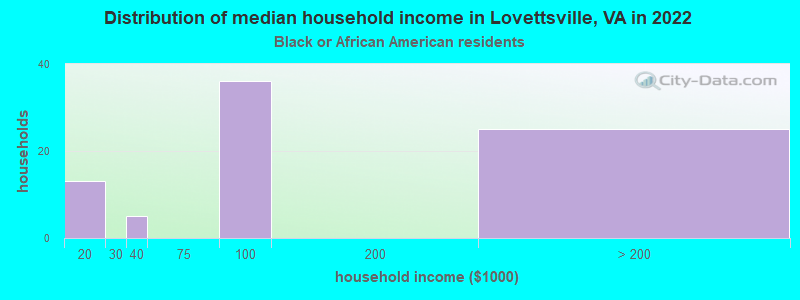
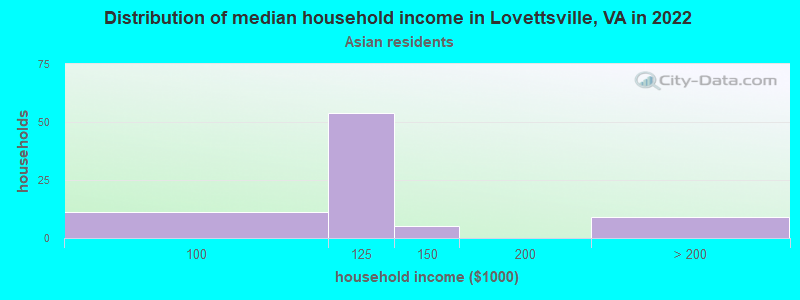
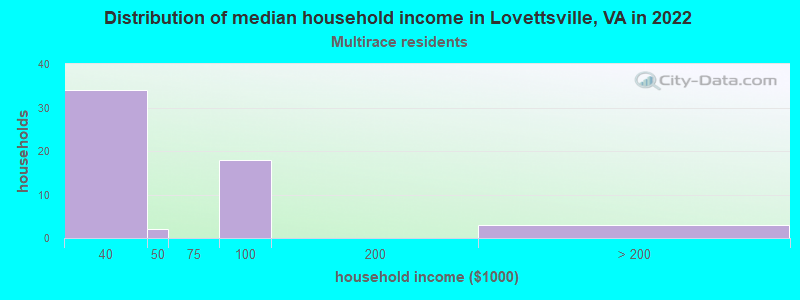
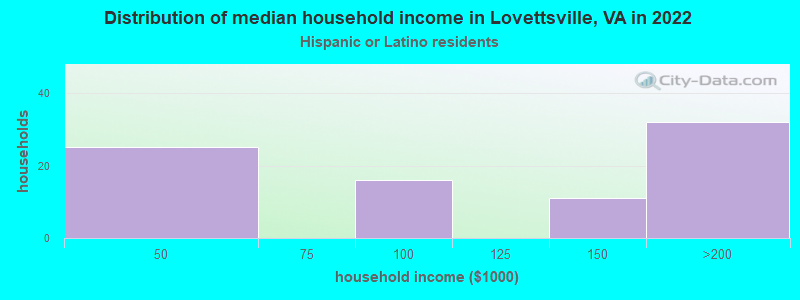
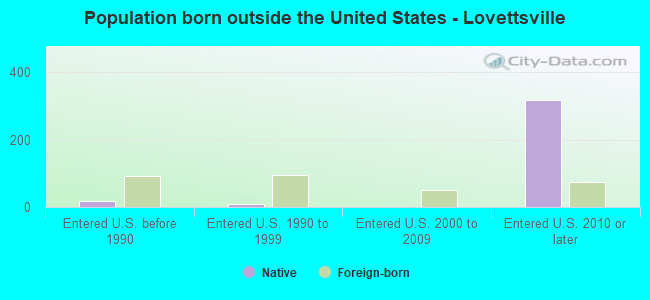
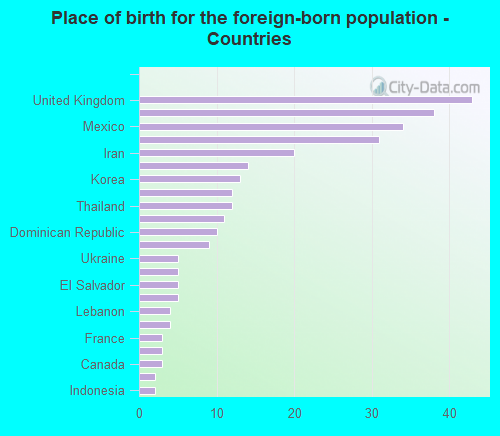
According to 2022 data, the most numerous races in Lovettsville, VA are White alone (1,679 residents), Black alone (297 residents), and Hispanic (312 residents). 81.5% of Lovettsville residents speak English at home. 10.8% of Lovettsville, VA residents are foreign-born (4.1% born in Asia, 3.2% born in Europe, 3.2% born in Latin America), which is 11.0% less than the foreign-born rate of 12.0% across the entire state of Virginia.
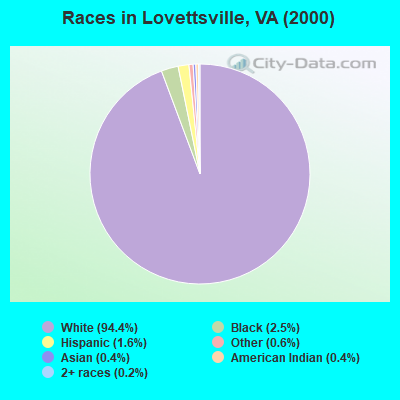
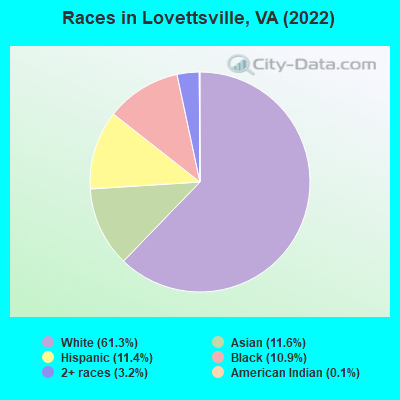
Race distribution in Lovettsville
2000 2022
4,965,637 70.2% White alone 1,376,378 19.4% Black alone 329,540 4.7% Hispanic 259,277 3.7% Asian alone 114,022 1.6% Two or more races 18,596 0.3% American Indian alone 11,685 0.2% Other race alone 3,380 0.05% Native Hawaiian and Other
5,095,130 58.7% White alone 1,594,785 18.4% Black alone 905,750 10.4% Hispanic 602,881 6.9% Asian alone 406,047 4.7% Two or more races 60,419 0.7% Other race alone 11,738 0.1% American Indian alone 6,869 0.08% Native Hawaiian and Other
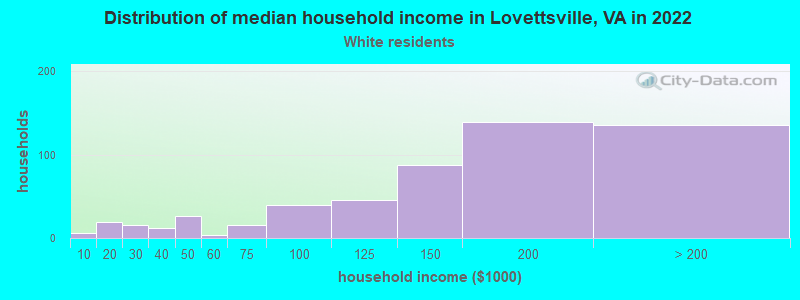
Income and house value in Lovettsville Median household income in 2022 $151,425 White non-Hispanic householders$117,116 Asian householdersMedian 2022 house value $497,754 White Non-Hispanic householders$627,268 Black or African American householders$481,302 American Indian or Alaska Native householders$656,321 Hispanic or Latino householders
Median age by race in Lovettsville
35.1 Median age for White residents32.9 35.6 36.2 Median age for Black or African American residents20.8 53.2 15.8 Median age for American Indian / Alaska Native residents17.5 -673,154,906.1 16.2 Median age for Asian residents27.7 9.9 -1,157,453,935.2 Median age for Native Hawaiian / Pacific Islander residents-541,531,822.5 -714,150,046.8 30.0 Median age for Other race residents31.2 26.2 24.4 Median age for Two or more races residents11.3 27.7 35.3 Median age for White alone residents35.3 35.5 27.2 Median age for Hispanic or Latino residents25.3 28.2
Owner/renter occupied households by race in Lovettsville
House owners and renters - White residents 488 88.0% Owner occupied67 12.0% Renter occupiedHouse owners and renters - Black or African American residents 62 82.3% Owner occupied13 17.7% Renter occupiedHouse owners and renters - American Indian / Alaska Native residents 2 100.0% Owner occupiedHouse owners and renters - Asian residents 67 100.0% Owner occupiedHouse owners and renters - Other race residents 4 100.0% Owner occupiedHouse owners and renters - Two or more races residents 30 58.0% Owner occupied22 42.0% Renter occupiedHouse owners and renters - White alone residents 471 90.4% Owner occupied50 9.6% Renter occupiedHouse owners and renters - Hispanic or Latino residents 61 78.0% Owner occupied17 22.0% Renter occupied
Language usage in Lovettsville
English speakers - Total 81.5% of residents of Lovettsville speak English at home.
10.0% of residents speak Spanish at home 198 80.5% Speak English very well48 19.5% Speak English less than very well5.9% of residents speak other language at home 82 56.2% Speak English very well64 43.8% Speak English less than very well
English speakers - Born in the United States 94.5% of residents of Lovettsville speak English at home.
3.1% of residents speak Spanish at home 23 69.7% Speak English very well10 30.3% Speak English less than very well1.2% of residents speak other language at home 13 100.0% Speak English very well
English speakers - Native, born elsewhere 46.4% of residents of Lovettsville speak English at home.
42.3% of residents speak Spanish at home 81 97.6% Speak English very well2 2.4% Speak English less than very well8.2% of residents speak other language at home 4 25.0% Speak English very well12 75.0% Speak English less than very well
English speakers - Foreign-born 34.8% of residents of Lovettsville speak English at home.
23.6% of residents speak Spanish at home 38 51.4% Speak English very well36 48.6% Speak English less than very well37.1% of residents speak other language at home 63 54.3% Speak English very well53 45.7% Speak English less than very well
White (Caucasian) - Speak only English Native:
92.3% (1,392)Foreign-born:
24.9% (38)
White (Caucasian) - Speak another language Native:
7.8% (117)Foreign-born:
74.1% (114)
Black or African American - Speak only English Native:
94.9% (255)Foreign-born:
74.6% (5)
Asian - Speak only English Native:
86.1% (174)Foreign-born:
39.3% (34)
Asian - Speak another language Native:
6.5% (13)Foreign-born:
61.1% (54)
Other race - Speak another language Native:
72.1% (27)Foreign-born:
100.0% (6)
Two or more races - Speak only English Native:
73.9% (59)Foreign-born:
100.0% (37)
Two or more races - Speak another language Native:
23.8% (19)Foreign-born:
6.6% (2)
White alone - Speak only English Native:
97.5% (1,362)Foreign-born:
32.5% (35)
White alone - Speak another language Native:
1.4% (20)Foreign-born:
60.9% (66)
Hispanic or Latino - Speak only English Native:
31.1% (72)Foreign-born:
11.6% (10)
Hispanic or Latino - Speak another language Native:
68.3% (158)Foreign-born:
88.7% (75)
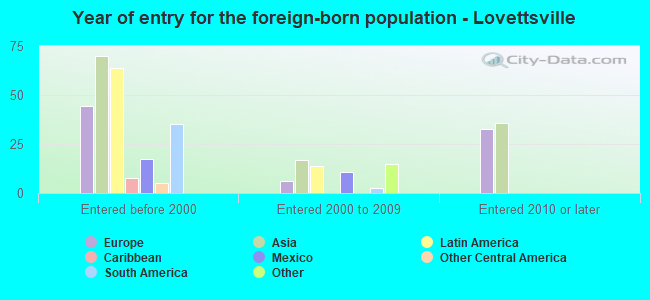
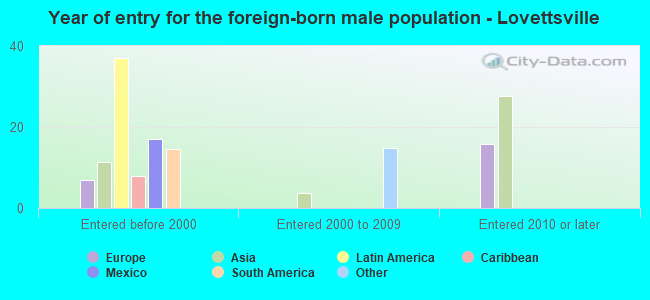
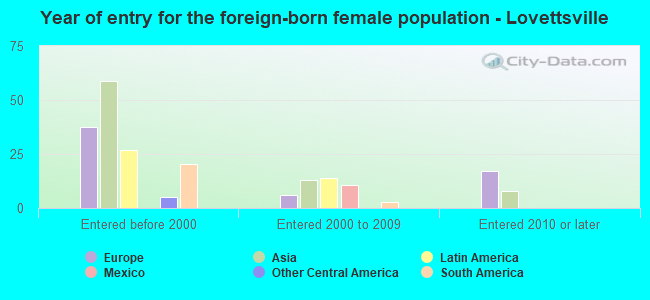
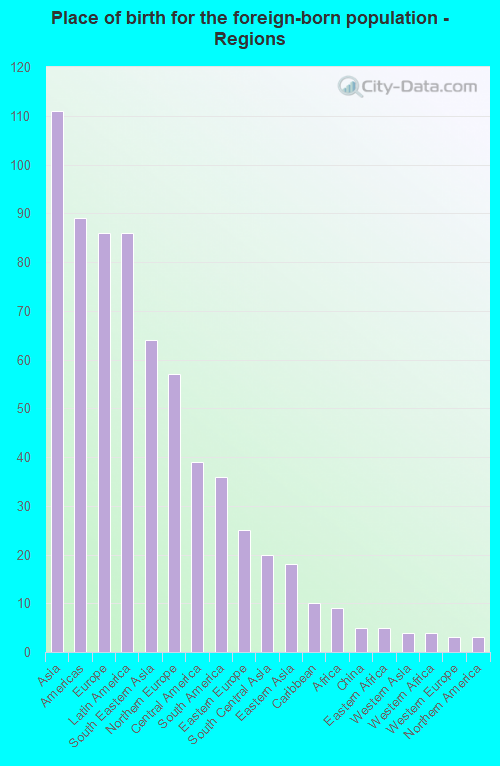
Foreign-born residents in Lovettsville 296 residents are foreign born (4.1% Asia , 3.2% Europe , 3.2% Latin America ).
This city:
10.8%Virginia:
12.6%
Marital status for residents in Lovettsville Marital status - White (Caucasian) population 15 years and over
Males 21.0% Never married74.1% Now married0.0% Separated2.0% Widowed2.9% DivorcedFemales 19.8% Never married61.5% Now married3.7% Separated6.2% Widowed8.7% DivorcedWomen who gave birth in the past 12 months Now married:
100.0% (25)Unmarried:
0.0% (0)
Women who did not give birth in the past 12 months Now married:
65.1% (273)Unmarried:
34.9% (147)
Marital status - Black or African American population 15 years and over
Males 59.3% Never married38.9% Now married1.9% Separated0.0% Widowed0.0% DivorcedFemales 33.7% Never married26.7% Now married0.0% Separated22.8% Widowed16.8% DivorcedWomen who gave birth in the past 12 months Now married:
0.0% (0)Unmarried:
100.0% (18)
Women who did not give birth in the past 12 months Now married:
24.2% (8)Unmarried:
75.8% (25)
Marital status - Asian population 15 years and over
Males 24.7% Never married67.9% Now married0.0% Separated0.0% Widowed7.4% DivorcedFemales 25.4% Never married42.9% Now married0.0% Separated25.4% Widowed6.3% DivorcedWomen who gave birth in the past 12 months Now married:
100.0% (7)Unmarried:
0.0% (0)
Women who did not give birth in the past 12 months Now married:
44.8% (14)Unmarried:
55.2% (18)
Marital status - Other race population 15 years and over
Males 50.0% Never married50.0% Now married0.0% Separated0.0% Widowed0.0% DivorcedFemales 47.1% Never married41.2% Now married0.0% Separated0.0% Widowed11.8% DivorcedWomen who gave birth in the past 12 months Now married:
100.0% (5)Unmarried:
0.0% (0)
Women who did not give birth in the past 12 months Now married:
0.0% (0)Unmarried:
100.0% (10)
Marital status - Two or more races population 15 years and over
Males 33.3% Never married66.7% Now married0.0% Separated0.0% Widowed0.0% DivorcedFemales 31.6% Never married33.3% Now married0.0% Separated0.0% Widowed35.1% DivorcedWomen who did not give birth in the past 12 months Now married:
33.3% (24)Unmarried:
66.7% (49)
Marital status - White alone, not Hispanic / Latino population 15 years and over
Males 17.0% Never married77.4% Now married0.0% Separated2.2% Widowed3.3% DivorcedFemales 19.4% Never married59.9% Now married3.9% Separated7.1% Widowed9.6% DivorcedWomen who gave birth in the past 12 months Now married:
100.0% (26)Unmarried:
0.0% (0)
Women who did not give birth in the past 12 months Now married:
63.2% (232)Unmarried:
36.8% (135)
Marital status - Hispanic or Latino population 15 years and over
Males 48.5% Never married51.5% Now married0.0% Separated0.0% Widowed0.0% DivorcedFemales 25.4% Never married66.2% Now married1.5% Separated0.0% Widowed6.9% DivorcedWomen who gave birth in the past 12 months Now married:
100.0% (4)Unmarried:
0.0% (0)
Women who did not give birth in the past 12 months Now married:
65.5% (74)Unmarried:
34.5% (39)
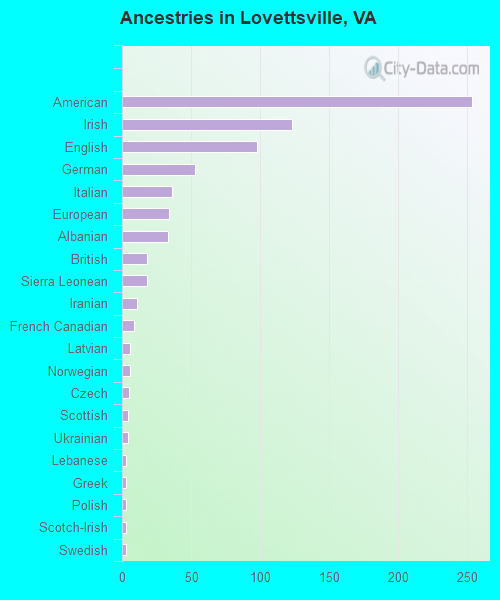
Ancestries in Lovettsville
253 25.4% American123 12.3% Irish98 9.8% English53 5.3% German36 3.6% Italian34 3.4% European33 3.3% Albanian18 1.8% British18 1.8% Sierra Leonean11 1.1% Iranian9 0.9% French Canadian6 0.6% Latvian6 0.6% Norwegian5 0.5% Czech4 0.4% Scottish4 0.4% Ukrainian3 0.3% Lebanese3 0.3% Greek3 0.3% Polish3 0.3% Scotch-Irish3 0.3% Swedish1 0.1% Northern European
Children Nativity (place of birth) in Lovettsville
Children under 6 years - Living with two parents Both parents native 166 100.0% NativeBoth parents foreign-born 14 100.0% NativeOne native, one foreign-born parent 5 100.0% NativeChildren under 6 years - Living with one parent Native parent 58 100.0% NativeForeign-born parent 4 100.0% NativeChildren 6 to 17 years - Living with two parents Both parents native 408 97.3% Native11 2.7% Foreign-bornBoth parents foreign-born 28 65.0% Native15 35.0% Foreign-bornOne native, one foreign-born parent 53 100.0% NativeChildren 6 to 17 years - Living with one parent Native parent 63 100.0% NativeForeign-born parent 38 48.3% Native40 51.7% Foreign-born
Grandparents responsible for own grandchildren in Lovettsville
Grandparents (30 to 59 years) Black or African American 6 100.0% Responsible for grandchildrenAsian 8 100.0% Not responsible for grandchildrenOther race 6 57.0% Responsible for grandchildren5 43.0% Not responsible for grandchildrenHispanic or Latino 5 66.9% Responsible for grandchildren3 33.1% Not responsible for grandchildren
Grandparents (60 years and over) Asian 6 100.0% Not responsible for grandchildrenHispanic or Latino 5 100.0% Not responsible for grandchildren