Races in Lyme, Connecticut (CT) Detailed Stats
Ancestries, Foreign-born residents, place of birth
3.7% of Lyme, CT residents are foreign-born (2.6% born in Europe, 0.8% born in Latin America), which is 303.2% less than the foreign-born rate of 15.0% across the entire state of Connecticut.
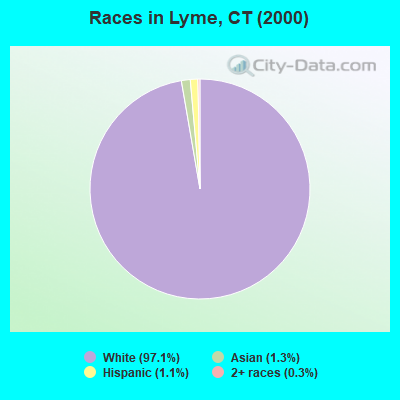
Race distribution in Lyme

- 1,95897.1%White alone
- 271.3%Asian alone
- 231.1%Hispanic
- 60.3%Two or more races
- 10.05%Black alone
- 10.05%American Indian alone
2000
2022
-
- 2,638,84577.5%White alone
- 320,3239.4%Hispanic
- 295,5718.7%Black alone
- 81,5642.4%Asian alone
- 52,8961.6%Two or more races
- 8,1410.2%Other race alone
- 7,2670.2%American Indian alone
- 9580.03%Native Hawaiian and Other
Pacific Islander alone

-
- 2,246,91362.0%White alone
- 658,97818.2%Hispanic
- 353,9739.8%Black alone
- 172,9294.8%Asian alone
- 159,6314.4%Two or more races
- 29,7610.8%Other race alone
- 3,4280.09%American Indian alone
- 5920.02%Native Hawaiian and Other
Pacific Islander alone

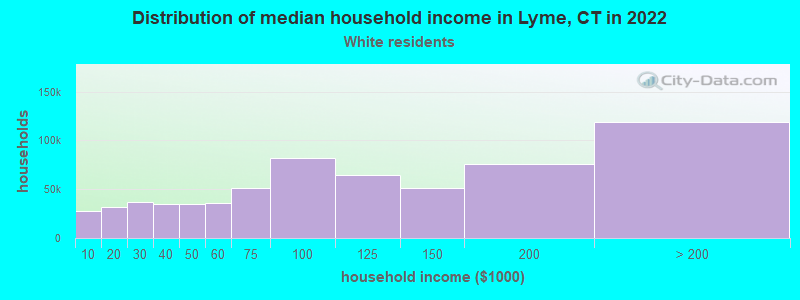
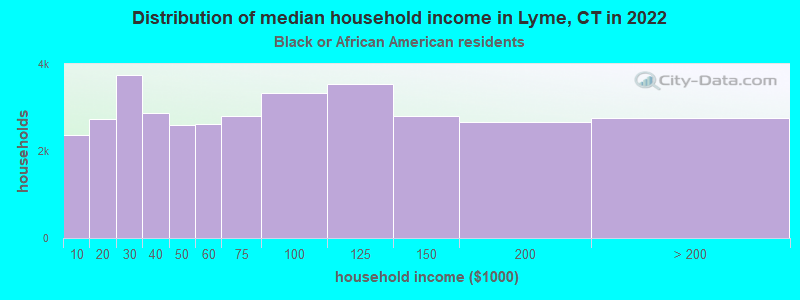
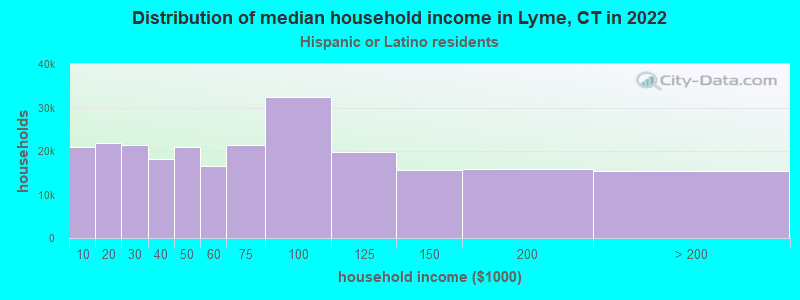
Income and house value in Lyme
- Median household income in 2022
- $127,961White non-Hispanic householders
- $12,912Black householders
- $56,068Hispanic or Latino race householders
- Median 2022 house value
- $625,435White Non-Hispanic householders
Household income for White non-Hispanic householders
Household income for Black householders
Household income for Hispanic or Latino race householders
Foreign-born residents in Lyme
75 residents are foreign born (2.6% Europe, 0.8% Latin America).
| This city: | 3.7% |
| Connecticut: | 10.9% |
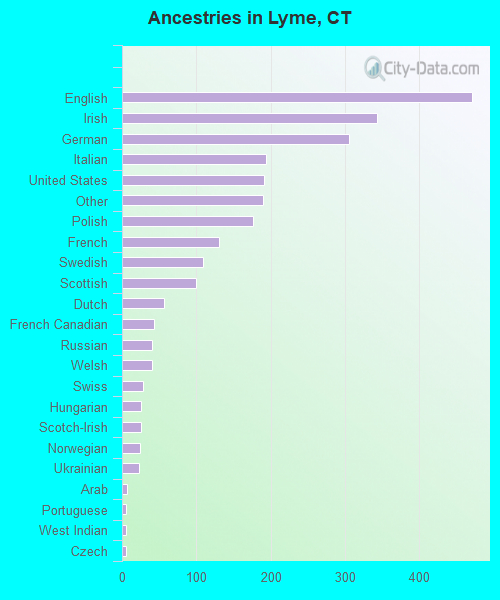
Ancestries in Lyme

- 47018.5%English
- 34313.5%Irish
- 30512.0%German
- 1937.6%Italian
- 1917.5%United States
- 1897.4%Other
- 1766.9%Polish
- 1315.2%French
- 1094.3%Swedish
- 993.9%Scottish
- 572.2%Dutch
- 431.7%French Canadian
- 411.6%Russian
- 411.6%Welsh
- 281.1%Swiss
- 261.0%Hungarian
- 261.0%Scotch-Irish
- 240.9%Norwegian
- 230.9%Ukrainian
- 70.3%Arab
- 60.2%Portuguese
- 60.2%West Indian
- 50.2%Czech
- 40.2%Slovak
Zip codes: 06371.