Races in Madisonville, Kentucky (KY) Detailed Stats
Data:
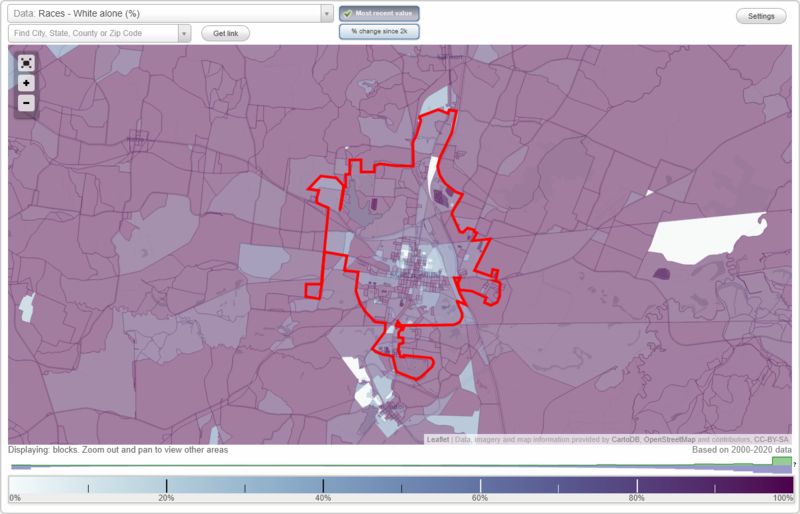
Races - White alone (%)
Races - White alone (% change since 2000)
Races - Black alone (%)
Races - Black alone (% change since 2000)
Races - American Indian alone (%)
Races - American Indian alone (% change since 2000)
Races - Asian alone (%)
Races - Asian alone (% change since 2000)
Races - Hispanic (%)
Races - Hispanic (% change since 2000)
Races - Native Hawaiian and Other Pacific Islander alone (%)
Races - Native Hawaiian and Other Pacific Islander alone (% change since 2000)
Races - Two or more races(%)
Races - Two or more races(% change since 2000)
Races - Other race alone (%)
Races - Other race alone (% change since 2000)
Racial diversity
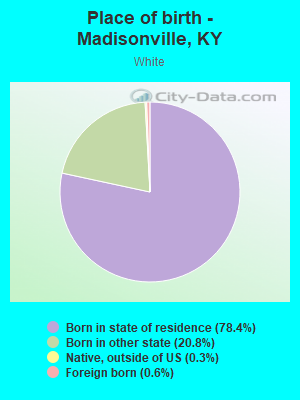
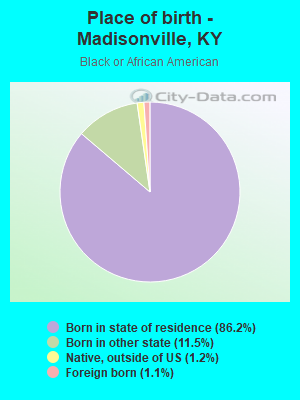
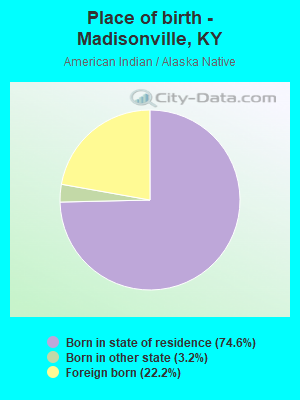
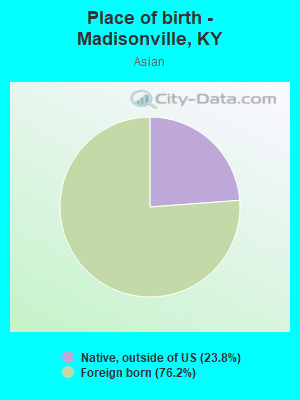
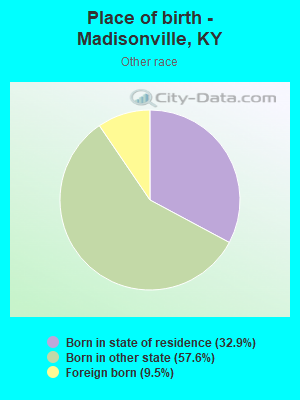
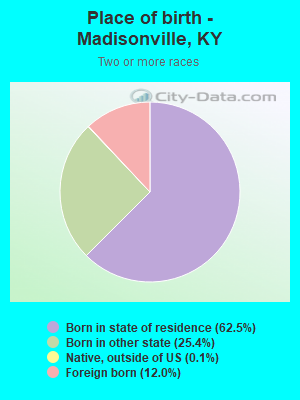
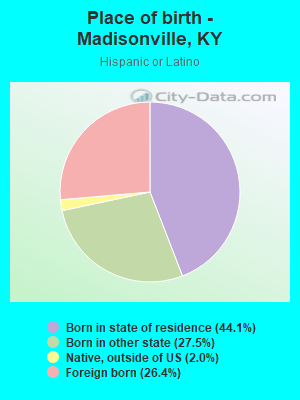
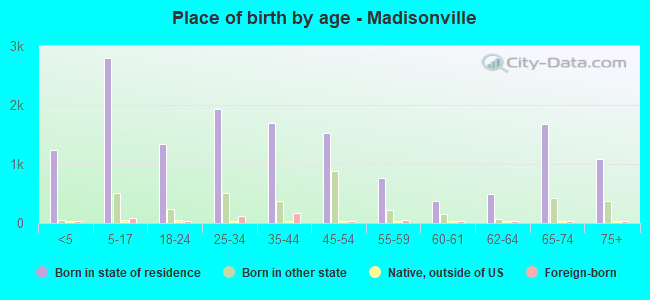
Place of birth - Born in state of residence (%)
Place of birth - Born in state of residence (%) - White
Place of birth - Born in state of residence (%) - Black or African American
Place of birth - Born in state of residence (%) - Asian
Place of birth - Born in state of residence (%) - Hispanic or Latino
Place of birth - Born in state of residence (%) - American Indian and Alaska Native
Place of birth - Born in state of residence (%) - Multirace
Place of birth - Born in state of residence (%) - Other Race
Place of birth - Born in other state (%)
Place of birth - Born in other state (%) - White
Place of birth - Born in other state (%) - Black or African American
Place of birth - Born in other state (%) - Asian
Place of birth - Born in other state (%) - Hispanic or Latino
Place of birth - Born in other state (%) - American Indian and Alaska Native
Place of birth - Born in other state (%) - Multirace
Place of birth - Born in other state (%) - Other Race
Place of birth - Native, outside of US (%)
Place of birth - Native, outside of US (%) - White
Place of birth - Native, outside of US (%) - Black or African American
Place of birth - Native, outside of US (%) - Asian
Place of birth - Native, outside of US (%) - Hispanic or Latino
Place of birth - Native, outside of US (%) - American Indian and Alaska Native
Place of birth - Native, outside of US (%) - Multirace
Place of birth - Native, outside of US (%) - Other Race
Place of birth - Foreign born (%)
Place of birth - Foreign born (%) - White
Place of birth - Foreign born (%) - Black or African American
Place of birth - Foreign born (%) - Asian
Place of birth - Foreign born (%) - Hispanic or Latino
Place of birth - Foreign born (%) - American Indian and Alaska Native
Place of birth - Foreign born (%) - Multirace
Place of birth - Foreign born (%) - Other Race
Residents speaking English at home (%)
Residents speaking English at home - Born in the United States (%)
Residents speaking English at home - Native, born elsewhere (%)
Residents speaking English at home - Foreign born (%)
Residents speaking Spanish at home (%)
Residents speaking Spanish at home - Born in the United States (%)
Residents speaking Spanish at home - Native, born elsewhere (%)
Residents speaking Spanish at home - Foreign born (%)
Residents speaking other language at home (%)
Residents speaking other language at home - Born in the United States (%)
Residents speaking other language at home - Native, born elsewhere (%)
Residents speaking other language at home - Foreign born (%)
Marital status - Never married (%)
Marital status - Now married (%)
Marital status - Separated (%)
Marital status - Widowed (%)
Marital status - Divorced (%)
Ancestries Reported - Arab (%)
Ancestries Reported - Czech (%)
Ancestries Reported - Danish (%)
Ancestries Reported - Dutch (%)
Ancestries Reported - English (%)
Ancestries Reported - French (%)
Ancestries Reported - French Canadian (%)
Ancestries Reported - German (%)
Ancestries Reported - Greek (%)
Ancestries Reported - Hungarian (%)
Ancestries Reported - Irish (%)
Ancestries Reported - Italian (%)
Ancestries Reported - Lithuanian (%)
Ancestries Reported - Norwegian (%)
Ancestries Reported - Polish (%)
Ancestries Reported - Portuguese (%)
Ancestries Reported - Russian (%)
Ancestries Reported - Scotch-Irish (%)
Ancestries Reported - Scottish (%)
Ancestries Reported - Slovak (%)
Ancestries Reported - Subsaharan African (%)
Ancestries Reported - Swedish (%)
Ancestries Reported - Swiss (%)
Ancestries Reported - Ukrainian (%)
Ancestries Reported - United States (%)
Ancestries Reported - Welsh (%)
Ancestries Reported - West Indian (%)
Ancestries Reported - Other (%)
Geographical mobility - Same house 1 year ago (%)
Geographical mobility - Same house 1 year ago (%) - White
Geographical mobility - Same house 1 year ago (%) - Black or African American
Geographical mobility - Same house 1 year ago (%) - Asian
Geographical mobility - Same house 1 year ago (%) - Hispanic or Latino
Geographical mobility - Same house 1 year ago (%) - American Indian and Alaska Native
Geographical mobility - Same house 1 year ago (%) - Multirace
Geographical mobility - Same house 1 year ago (%) - Other Race
Geographical mobility - Moved within same county (%)
Geographical mobility - Moved within same county (%) - White
Geographical mobility - Moved within same county (%) - Black or African American
Geographical mobility - Moved within same county (%) - Asian
Geographical mobility - Moved within same county (%) - Hispanic or Latino
Geographical mobility - Moved within same county (%) - American Indian and Alaska Native
Geographical mobility - Moved within same county (%) - Multirace
Geographical mobility - Moved within same county (%) - Other Race
Geographical mobility - Moved from different county within same state (%)
Geographical mobility - Moved from different county within same state (%) - White
Geographical mobility - Moved from different county within same state (%) - Black or African American
Geographical mobility - Moved from different county within same state (%) - Asian
Geographical mobility - Moved from different county within same state (%) - Hispanic or Latino
Geographical mobility - Moved from different county within same state (%) - American Indian and Alaska Native
Geographical mobility - Moved from different county within same state (%) - Multirace
Geographical mobility - Moved from different county within same state (%) - Other Race
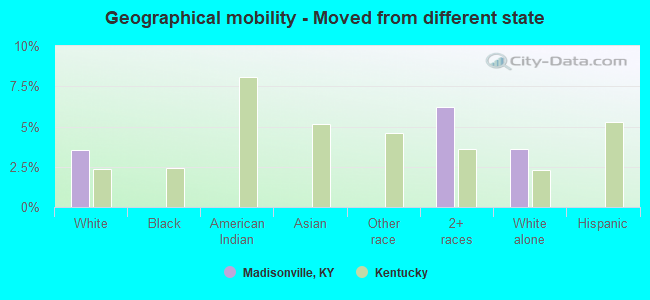
Geographical mobility - Moved from different state (%)
Geographical mobility - Moved from different state (%) - White
Geographical mobility - Moved from different state (%) - Black or African American
Geographical mobility - Moved from different state (%) - Asian
Geographical mobility - Moved from different state (%) - Hispanic or Latino
Geographical mobility - Moved from different state (%) - American Indian and Alaska Native
Geographical mobility - Moved from different state (%) - Multirace
Geographical mobility - Moved from different state (%) - Other Race
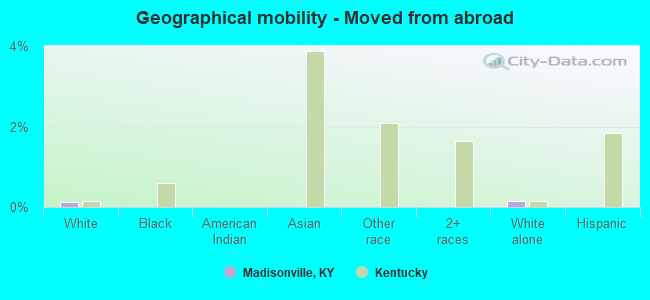
Geographical mobility - Moved from abroad (%)
Geographical mobility - Moved from abroad (%) - White
Geographical mobility - Moved from abroad (%) - Black or African American
Geographical mobility - Moved from abroad (%) - Asian
Geographical mobility - Moved from abroad (%) - Hispanic or Latino
Geographical mobility - Moved from abroad (%) - American Indian and Alaska Native
Geographical mobility - Moved from abroad (%) - Multirace
Geographical mobility - Moved from abroad (%) - Other Race
Place of birth for the foreign-born population - Ireland (%)
Place of birth for the foreign-born population - Denmark (%)
Place of birth for the foreign-born population - Norway (%)
Place of birth for the foreign-born population - Sweden (%)
Place of birth for the foreign-born population - United Kingdom (%)
Place of birth for the foreign-born population - England (%)
Place of birth for the foreign-born population - Scotland (%)
Place of birth for the foreign-born population - Other Northern Europe (%)
Place of birth for the foreign-born population - Austria (%)
Place of birth for the foreign-born population - Belgium (%)
Place of birth for the foreign-born population - France (%)
Place of birth for the foreign-born population - Germany (%)
Place of birth for the foreign-born population - Netherlands (%)
Place of birth for the foreign-born population - Switzerland (%)
Place of birth for the foreign-born population - Other Western Europe (%)
Place of birth for the foreign-born population - Greece (%)
Place of birth for the foreign-born population - Italy (%)
Place of birth for the foreign-born population - Portugal (%)
Place of birth for the foreign-born population - Spain (%)
Place of birth for the foreign-born population - Other Southern Europe (%)
Place of birth for the foreign-born population - Albania (%)
Place of birth for the foreign-born population - Belarus (%)
Place of birth for the foreign-born population - Bosnia and Herzegovina (%)
Place of birth for the foreign-born population - Bulgaria (%)
Place of birth for the foreign-born population - Croatia (%)
Place of birth for the foreign-born population - Czechoslovakia (%)
Place of birth for the foreign-born population - Hungary (%)
Place of birth for the foreign-born population - Latvia (%)
Place of birth for the foreign-born population - Lithuania (%)
Place of birth for the foreign-born population - North Macedonia (Macedonia) (%)
Place of birth for the foreign-born population - Moldova (%)
Place of birth for the foreign-born population - Poland (%)
Place of birth for the foreign-born population - Romania (%)
Place of birth for the foreign-born population - Russia (%)
Place of birth for the foreign-born population - Serbia (%)
Place of birth for the foreign-born population - Ukraine (%)
Place of birth for the foreign-born population - Other Eastern Europe (%)
Place of birth for the foreign-born population - China (%)
Place of birth for the foreign-born population - Hong Kong (%)
Place of birth for the foreign-born population - Taiwan (%)
Place of birth for the foreign-born population - Japan (%)
Place of birth for the foreign-born population - Korea (%)
Place of birth for the foreign-born population - Other Eastern Asia (%)
Place of birth for the foreign-born population - Afghanistan (%)
Place of birth for the foreign-born population - Bangladesh (%)
Place of birth for the foreign-born population - India (%)
Place of birth for the foreign-born population - Iran (%)
Place of birth for the foreign-born population - Kazakhstan (%)
Place of birth for the foreign-born population - Nepal (%)
Place of birth for the foreign-born population - Pakistan (%)
Place of birth for the foreign-born population - Sri Lanka (%)
Place of birth for the foreign-born population - Uzbekistan (%)
Place of birth for the foreign-born population - Other South Central Asia (%)
Place of birth for the foreign-born population - Burma (%)
Place of birth for the foreign-born population - Cambodia (%)
Place of birth for the foreign-born population - Indonesia (%)
Place of birth for the foreign-born population - Laos (%)
Place of birth for the foreign-born population - Malaysia (%)
Place of birth for the foreign-born population - Philippines (%)
Place of birth for the foreign-born population - Singapore (%)
Place of birth for the foreign-born population - Thailand (%)
Place of birth for the foreign-born population - Vietnam (%)
Place of birth for the foreign-born population - Other South Eastern Asia (%)
Place of birth for the foreign-born population - Armenia (%)
Place of birth for the foreign-born population - Iraq (%)
Place of birth for the foreign-born population - Israel (%)
Place of birth for the foreign-born population - Jordan (%)
Place of birth for the foreign-born population - Kuwait (%)
Place of birth for the foreign-born population - Lebanon (%)
Place of birth for the foreign-born population - Saudi Arabia (%)
Place of birth for the foreign-born population - Syria (%)
Place of birth for the foreign-born population - Turkey (%)
Place of birth for the foreign-born population - Yemen (%)
Place of birth for the foreign-born population - Other Western Asia (%)
Place of birth for the foreign-born population - Eritrea (%)
Place of birth for the foreign-born population - Ethiopia (%)
Place of birth for the foreign-born population - Kenya (%)
Place of birth for the foreign-born population - Somalia (%)
Place of birth for the foreign-born population - Uganda (%)
Place of birth for the foreign-born population - Zimbabwe (%)
Place of birth for the foreign-born population - Other Eastern Africa (%)
Place of birth for the foreign-born population - Cameroon (%)
Place of birth for the foreign-born population - Congo (%)
Place of birth for the foreign-born population - Democratic Republic of Congo (Zaire) (%)
Place of birth for the foreign-born population - Other Middle Africa (%)
Place of birth for the foreign-born population - Egypt (%)
Place of birth for the foreign-born population - Morocco (%)
Place of birth for the foreign-born population - Sudan (%)
Place of birth for the foreign-born population - Other Northern Africa (%)
Place of birth for the foreign-born population - South Africa (%)
Place of birth for the foreign-born population - Other Southern Africa (%)
Place of birth for the foreign-born population - Cabo Verde (%)
Place of birth for the foreign-born population - Ghana (%)
Place of birth for the foreign-born population - Liberia (%)
Place of birth for the foreign-born population - Nigeria (%)
Place of birth for the foreign-born population - Senegal (%)
Place of birth for the foreign-born population - Sierra Leone (%)
Place of birth for the foreign-born population - Other Western Africa (%)
Place of birth for the foreign-born population - Australia (%)
Place of birth for the foreign-born population - New Zealand (%)
Place of birth for the foreign-born population - Fiji (%)
Place of birth for the foreign-born population - Micronesia (%)
Place of birth for the foreign-born population - Bahamas (%)
Place of birth for the foreign-born population - Barbados (%)
Place of birth for the foreign-born population - Cuba (%)
Place of birth for the foreign-born population - Dominica (%)
Place of birth for the foreign-born population - Dominican Republic (%)
Place of birth for the foreign-born population - Grenada (%)
Place of birth for the foreign-born population - Haiti (%)
Place of birth for the foreign-born population - Jamaica (%)
Place of birth for the foreign-born population - St. Vincent and the Grenadines (%)
Place of birth for the foreign-born population - Trinidad and Tobago (%)
Place of birth for the foreign-born population - West Indies (%)
Place of birth for the foreign-born population - Other Caribbean (%)
Place of birth for the foreign-born population - Belize (%)
Place of birth for the foreign-born population - Costa Rica (%)
Place of birth for the foreign-born population - El Salvador (%)
Place of birth for the foreign-born population - Guatemala (%)
Place of birth for the foreign-born population - Honduras (%)
Place of birth for the foreign-born population - Mexico (%)
Place of birth for the foreign-born population - Nicaragua (%)
Place of birth for the foreign-born population - Panama (%)
Place of birth for the foreign-born population - Other Central America (%)
Place of birth for the foreign-born population - Argentina (%)
Place of birth for the foreign-born population - Bolivia (%)
Place of birth for the foreign-born population - Brazil (%)
Place of birth for the foreign-born population - Chile (%)
Place of birth for the foreign-born population - Colombia (%)
Place of birth for the foreign-born population - Ecuador (%)
Place of birth for the foreign-born population - Guyana (%)
Place of birth for the foreign-born population - Peru (%)
Place of birth for the foreign-born population - Uruguay (%)
Place of birth for the foreign-born population - Venezuela (%)
Place of birth for the foreign-born population - Other South America (%)
Place of birth for the foreign-born population - Canada (%)
Place of birth for the foreign-born population - Other Northern America (%)
Place of birth for the foreign-born population - Other (%)
Latest news about races in Madisonville, KY collected exclusively by city-data.com from local newspapers, TV, and radio stations
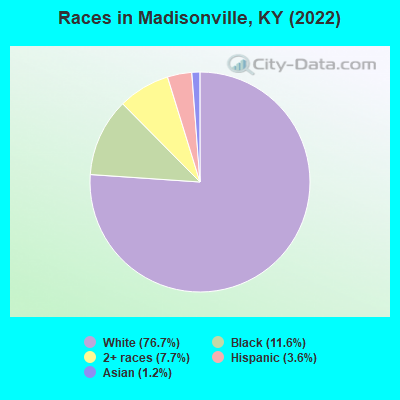
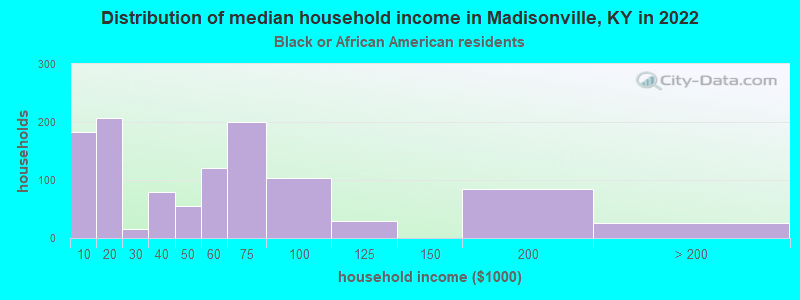
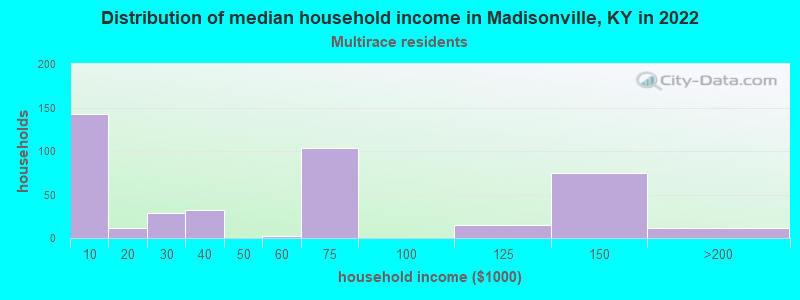
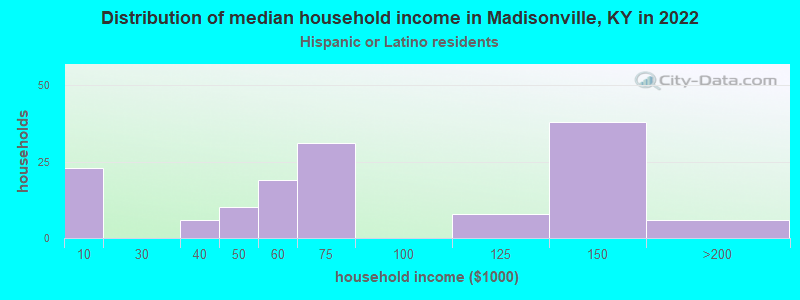
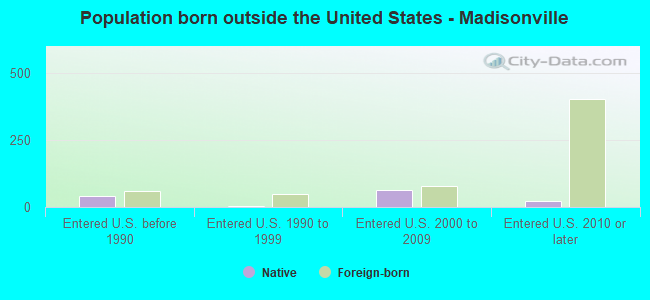
According to 2022 data, the most numerous races in Madisonville, KY are White alone (14,938 residents), Black alone (2,250 residents), and Hispanic (704 residents). 96.5% of Madisonville residents speak English at home. 3.0% of Madisonville, KY residents are foreign-born (1.3% born in Asia, 0.9% born in Latin America, 0.5% born in Europe), which is 34.5% less than the foreign-born rate of 4.0% across the entire state of Kentucky.
Race distribution in Madisonville
2000 2022
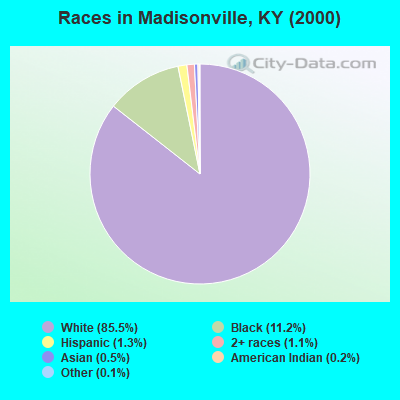
3,608,013 89.3% White alone 293,639 7.3% Black alone 59,939 1.5% Hispanic 37,750 0.9% Two or more races 29,368 0.7% Asian alone 7,939 0.2% American Indian alone 3,846 0.10% Other race alone 1,275 0.03% Native Hawaiian and Other
3,710,998 82.2% White alone 343,194 7.6% Black alone 187,483 4.2% Hispanic 187,394 4.2% Two or more races 62,240 1.4% Asian alone 13,529 0.3% Other race alone 4,302 0.10% American Indian alone 3,170 0.07% Native Hawaiian and Other
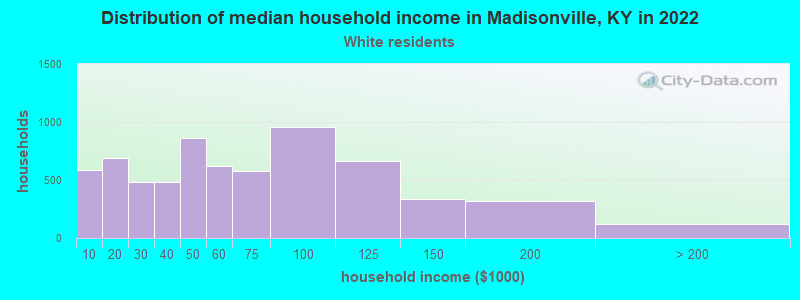
Income and house value in Madisonville Median household income in 2022 $53,638 White non-Hispanic householders$50,573 Black householders$68,611 Hispanic or Latino race householdersMedian 2022 house value $174,150 White Non-Hispanic householders$105,414 Black or African American householders $322,763 Asian householders$178,769 Two or more races householders$176,596 Hispanic or Latino householders
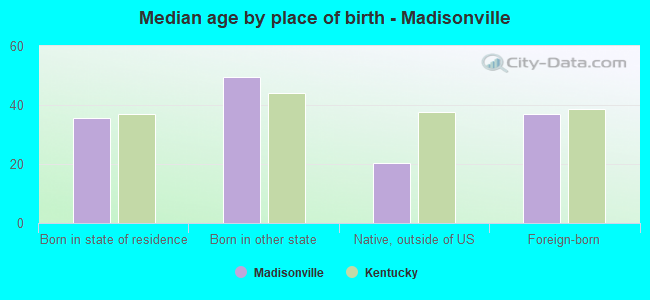
Median age by race in Madisonville
39.9 Median age for White residents37.4 42.7 45.7 Median age for Black or African American residents45.8 48.6 6.2 Median age for American Indian / Alaska Native residents21.9 0.0 39.9 Median age for Asian residents-688,492,062.8 40.7 -755,186,721.2 Median age for Native Hawaiian / Pacific Islander residents-724,043,715.1 -853,801,168.7 30.0 Median age for Other race residents31.5 -736,990,154.0 17.9 Median age for Two or more races residents20.8 15.4 39.8 Median age for White alone residents37.7 42.5 22.0 Median age for Hispanic or Latino residents26.1 9.9
Owner/renter occupied households by race in Madisonville
House owners and renters - White residents 4,408 65.6% Owner occupied2,312 34.4% Renter occupiedHouse owners and renters - Black or African American residents 499 45.2% Owner occupied606 54.8% Renter occupiedHouse owners and renters - American Indian / Alaska Native residents 4 100.0% Owner occupiedHouse owners and renters - Other race residents 20 100.0% Renter occupiedHouse owners and renters - Two or more races residents 132 35.1% Owner occupied245 64.9% Renter occupiedHouse owners and renters - White alone residents 4,386 65.2% Owner occupied2,342 34.8% Renter occupiedHouse owners and renters - Hispanic or Latino residents 55 43.7% Owner occupied71 56.3% Renter occupied
Language usage in Madisonville
English speakers - Total 96.5% of residents of Madisonville speak English at home.
1.9% of residents speak Spanish at home 149 42.6% Speak English very well201 57.4% Speak English less than very well1.6% of residents speak other language at home 297 100.0% Speak English very well
English speakers - Born in the United States 97.7% of residents of Madisonville speak English at home.
2.0% of residents speak Spanish at home 56 74.7% Speak English very well19 25.3% Speak English less than very well0.2% of residents speak other language at home 6 100.0% Speak English very well
English speakers - Native, born elsewhere 88.6% of residents of Madisonville speak English at home.
7.9% of residents speak Spanish at home 11 100.0% Speak English very well
English speakers - Foreign-born 19.6% of residents of Madisonville speak English at home.
33.3% of residents speak Spanish at home 4 2.2% Speak English very well181 97.8% Speak English less than very well47.1% of residents speak other language at home 262 100.0% Speak English very well
White (Caucasian) - Speak only English Native:
99.6% (13,983)Foreign-born:
57.2% (49)
White (Caucasian) - Speak another language Native:
0.5% (65)Foreign-born:
49.3% (43)
Black or African American - Speak only English Native:
99.6% (2,083)Foreign-born:
84.3% (20)
Black or African American - Speak another language Native:
0.6% (12)Foreign-born:
23.1% (5)
American Indian / Alaska Native - Speak another language Native:
100.0% (107)Foreign-born:
98.8% (55)
Asian - Speak only English Native:
97.9% (51)Foreign-born:
15.5% (30)
Two or more races - Speak only English Native:
97.6% (1,376)Foreign-born:
1.5% (3)
Two or more races - Speak another language Native:
1.6% (22)Foreign-born:
97.5% (207)
White alone - Speak only English Native:
99.8% (13,922)Foreign-born:
53.6% (52)
White alone - Speak another language Native:
0.1% (13)Foreign-born:
47.8% (47)
Hispanic or Latino - Speak another language Native:
38.0% (161)Foreign-born:
100.0% (181)
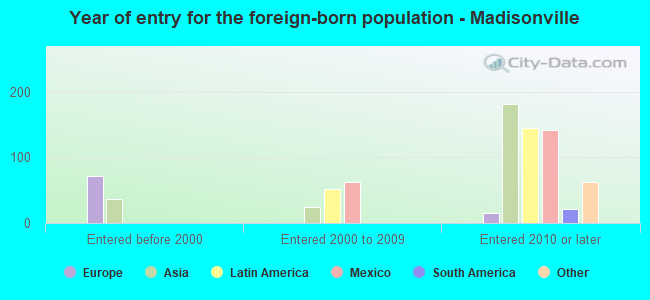
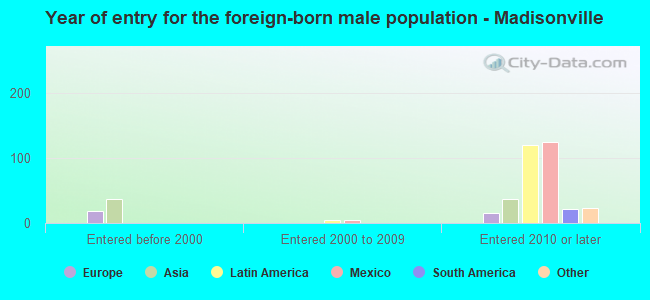
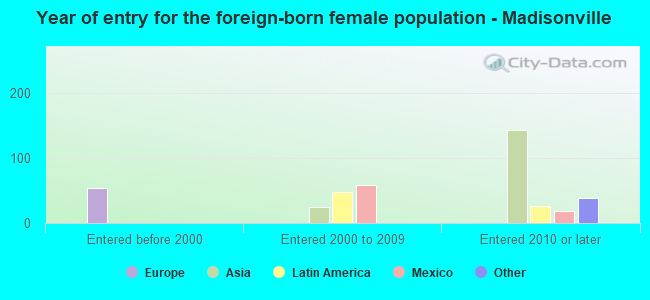
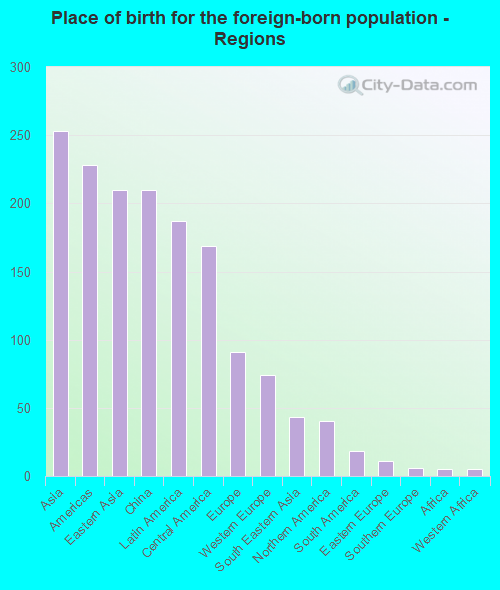
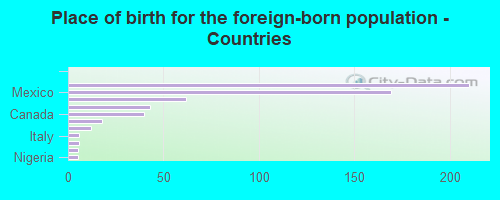
Foreign-born residents in Madisonville 579 residents are foreign born (1.3% Asia , 0.9% Latin America , 0.5% Europe ).
This city:
3.0%Kentucky:
4.1%
Marital status for residents in Madisonville Marital status - White (Caucasian) population 15 years and over
Males 26.7% Never married53.6% Now married3.3% Separated3.6% Widowed12.8% DivorcedFemales 20.6% Never married46.1% Now married1.7% Separated12.1% Widowed19.4% DivorcedWomen who gave birth in the past 12 months Now married:
44.7% (91)Unmarried:
55.3% (112)
Women who did not give birth in the past 12 months Now married:
47.1% (1,585)Unmarried:
52.9% (1,781)
Marital status - Black or African American population 15 years and over
Males 39.0% Never married34.6% Now married0.3% Separated0.0% Widowed26.1% DivorcedFemales 38.5% Never married15.9% Now married2.1% Separated9.4% Widowed34.2% DivorcedWomen who gave birth in the past 12 months Now married:
48.8% (20)Unmarried:
51.2% (21)
Women who did not give birth in the past 12 months Now married:
9.0% (43)Unmarried:
91.0% (441)
Marital status - American Indian / Alaska Native population 15 years and over
Males 54.4% Never married10.5% Now married0.0% Separated0.0% Widowed35.1% DivorcedFemales 100.0% Never married0.0% Now married0.0% Separated0.0% Widowed0.0% DivorcedWomen who did not give birth in the past 12 months Now married:
0.0% (0)Unmarried:
100.0% (13)
Marital status - Asian population 15 years and over
Males 48.2% Never married51.8% Now married0.0% Separated0.0% Widowed0.0% DivorcedFemales 10.1% Never married89.9% Now married0.0% Separated0.0% Widowed0.0% DivorcedWomen who did not give birth in the past 12 months Now married:
89.9% (119)Unmarried:
10.1% (13)
Marital status - Other race population 15 years and over
Males 85.3% Never married14.7% Now married0.0% Separated0.0% Widowed0.0% DivorcedFemales 100.0% Never married0.0% Now married0.0% Separated0.0% Widowed0.0% DivorcedWomen who did not give birth in the past 12 months Now married:
0.0% (0)Unmarried:
100.0% (25)
Marital status - Two or more races population 15 years and over
Males 67.5% Never married30.8% Now married0.0% Separated0.9% Widowed0.7% DivorcedFemales 71.4% Never married18.7% Now married4.1% Separated0.0% Widowed5.8% DivorcedWomen who gave birth in the past 12 months Now married:
25.0% (16)Unmarried:
75.0% (47)
Women who did not give birth in the past 12 months Now married:
24.6% (63)Unmarried:
75.4% (194)
Marital status - White alone, not Hispanic / Latino population 15 years and over
Males 26.3% Never married53.8% Now married3.2% Separated3.7% Widowed13.0% DivorcedFemales 20.5% Never married46.3% Now married1.8% Separated12.1% Widowed19.4% DivorcedWomen who gave birth in the past 12 months Now married:
44.7% (92)Unmarried:
55.3% (113)
Women who did not give birth in the past 12 months Now married:
47.6% (1,600)Unmarried:
52.4% (1,759)
Marital status - Hispanic or Latino population 15 years and over
Males 54.2% Never married34.3% Now married3.0% Separated0.0% Widowed8.5% DivorcedFemales 66.7% Never married19.8% Now married0.0% Separated3.7% Widowed9.9% DivorcedWomen who gave birth in the past 12 months Now married:
0.0% (0)Unmarried:
100.0% (36)
Women who did not give birth in the past 12 months Now married:
23.2% (24)Unmarried:
76.8% (79)
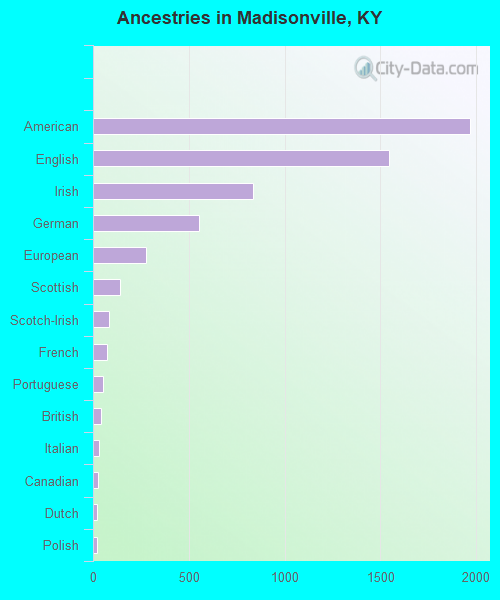
Ancestries in Madisonville
1,969 21.7% American1,546 17.1% English836 9.2% Irish553 6.1% German277 3.1% European140 1.5% Scottish82 0.9% Scotch-Irish71 0.8% French54 0.6% Portuguese42 0.5% British30 0.3% Italian28 0.3% Canadian20 0.2% Dutch20 0.2% Polish17 0.2% Nigerian13 0.1% Australian11 0.1% Pennsylvania German11 0.1% Swedish9 0.10% French Canadian9 0.10% African7 0.08% Dutch West Indian6 0.07% Welsh5 0.06% Syrian5 0.06% Eastern European4 0.04% Danish4 0.04% Russian3 0.03% Hungarian
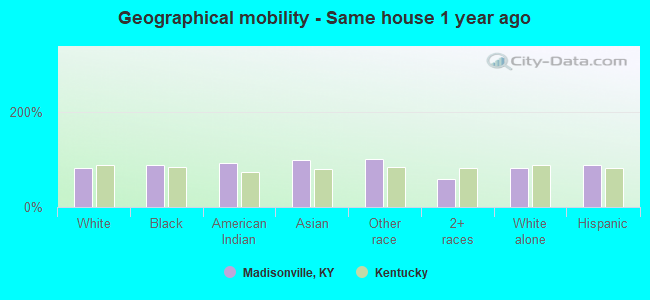
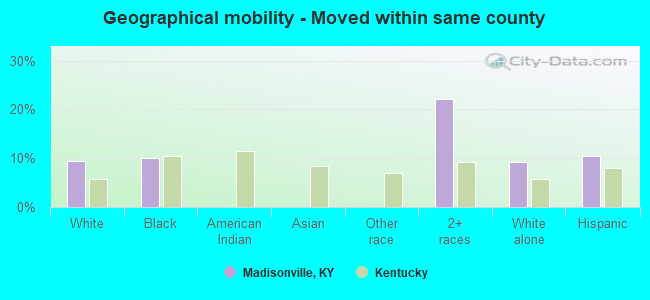
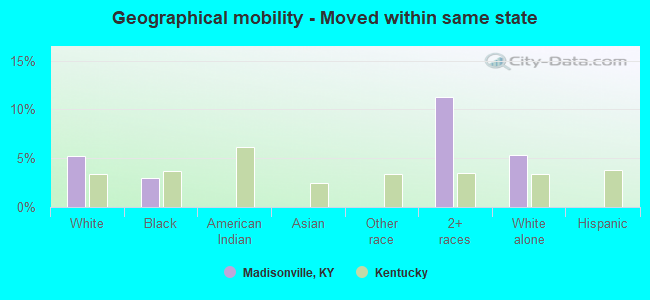
Geographical mobility in Madisonville Same house 1 year ago 12,041 81.1% White (Caucasian)1,972 88.0% Black or African American154 91.6% American Indian / Alaska Native237 97.9% Asian68 100.0% Other race1,003 57.9% Two or more races12,031 81.3% White alone, not Hispanic / Latino527 88.2% Hispanic or LatinoMoved within same county 1,404 9.5% White / Caucasian225 10.0% Black or African American383 22.1% Two or more races1,367 9.2% White alone, not Hispanic / Latino63 10.5% Hispanic or LatinoMoved within same state 781 5.3% White / Caucasian67 3.0% Black or African American195 11.3% Two or more races788 5.3% White alone, not Hispanic / LatinoMoved from different state 521 3.5% White / Caucasian108 6.2% Two or more races531 3.6% White alone, not Hispanic / LatinoMoved from abroad 20 0.1% White21 0.1% White alone, not Hispanic / Latino
Children Nativity (place of birth) in Madisonville
Children under 6 years - Living with two parents Both parents native 774 100.0% NativeBoth parents foreign-born 3 71.9% Native1 28.1% Foreign-bornChildren under 6 years - Living with one parent Native parent 558 99.8% Native1 0.2% Foreign-bornForeign-born parent 1 83.8% NativeChildren 6 to 17 years - Living with two parents Both parents native 1,251 97.7% Native29 2.3% Foreign-bornBoth parents foreign-born 14 23.1% Native48 76.9% Foreign-bornOne native, one foreign-born parent 14 100.0% Foreign-bornChildren 6 to 17 years - Living with one parent Native parent 1,304 100.0% NativeForeign-born parent 87 49.5% Native88 50.5% Foreign-born
Grandparents responsible for own grandchildren in Madisonville
Grandparents (30 to 59 years) White / Caucasian 47 73.8% Responsible for grandchildren17 26.2% Not responsible for grandchildrenBlack or African American 120 85.3% Responsible for grandchildren21 14.7% Not responsible for grandchildrenTwo or more races 52 100.0% Responsible for grandchildrenWhite alone, not Hispanic / Latino 47 73.5% Responsible for grandchildren17 26.5% Not responsible for grandchildrenHispanic or Latino 27 100.0% Responsible for grandchildrenGrandparents (60 years and over) White / Caucasian 86 38.1% Responsible for grandchildren140 61.9% Not responsible for grandchildrenBlack or African American 44 36.8% Responsible for grandchildren76 63.2% Not responsible for grandchildrenWhite alone, not Hispanic / Latino 86 37.9% Responsible for grandchildren141 62.1% Not responsible for grandchildren