Races in Madras, Oregon (OR) Detailed Stats
Data:
Races - White alone (%)
Races - White alone (% change since 2000)
Races - Black alone (%)
Races - Black alone (% change since 2000)
Races - American Indian alone (%)
Races - American Indian alone (% change since 2000)
Races - Asian alone (%)
Races - Asian alone (% change since 2000)
Races - Hispanic (%)
Races - Hispanic (% change since 2000)
Races - Native Hawaiian and Other Pacific Islander alone (%)
Races - Native Hawaiian and Other Pacific Islander alone (% change since 2000)
Races - Two or more races(%)
Races - Two or more races(% change since 2000)
Races - Other race alone (%)
Races - Other race alone (% change since 2000)
Racial diversity
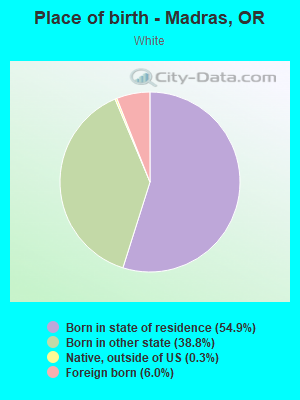
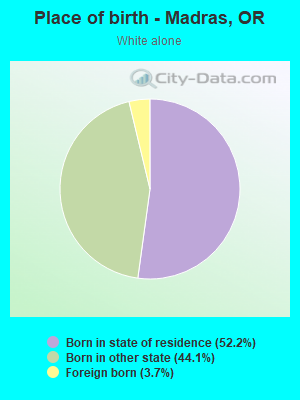
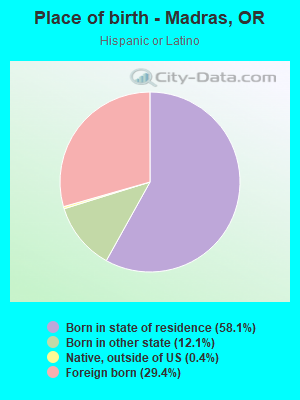
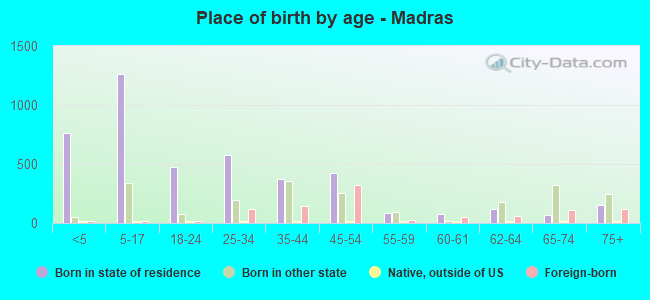
Place of birth - Born in state of residence (%)
Place of birth - Born in state of residence (%) - White
Place of birth - Born in state of residence (%) - Black or African American
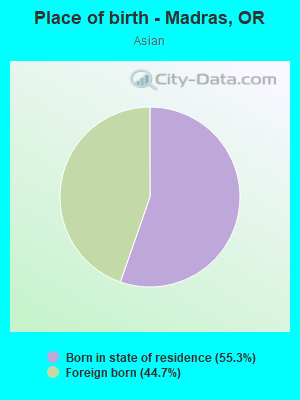
Place of birth - Born in state of residence (%) - Asian
Place of birth - Born in state of residence (%) - Hispanic or Latino
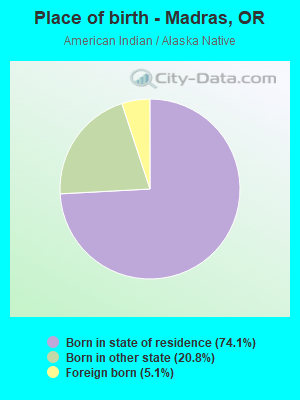
Place of birth - Born in state of residence (%) - American Indian and Alaska Native
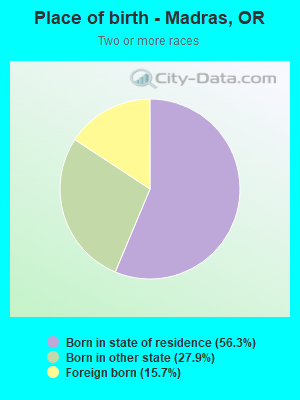
Place of birth - Born in state of residence (%) - Multirace
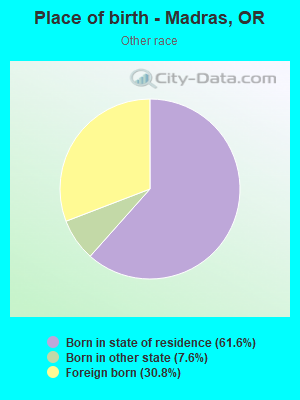
Place of birth - Born in state of residence (%) - Other Race
Place of birth - Born in other state (%)
Place of birth - Born in other state (%) - White
Place of birth - Born in other state (%) - Black or African American
Place of birth - Born in other state (%) - Asian
Place of birth - Born in other state (%) - Hispanic or Latino
Place of birth - Born in other state (%) - American Indian and Alaska Native
Place of birth - Born in other state (%) - Multirace
Place of birth - Born in other state (%) - Other Race
Place of birth - Native, outside of US (%)
Place of birth - Native, outside of US (%) - White
Place of birth - Native, outside of US (%) - Black or African American
Place of birth - Native, outside of US (%) - Asian
Place of birth - Native, outside of US (%) - Hispanic or Latino
Place of birth - Native, outside of US (%) - American Indian and Alaska Native
Place of birth - Native, outside of US (%) - Multirace
Place of birth - Native, outside of US (%) - Other Race
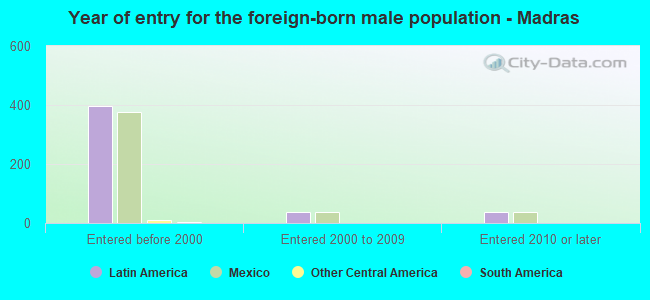
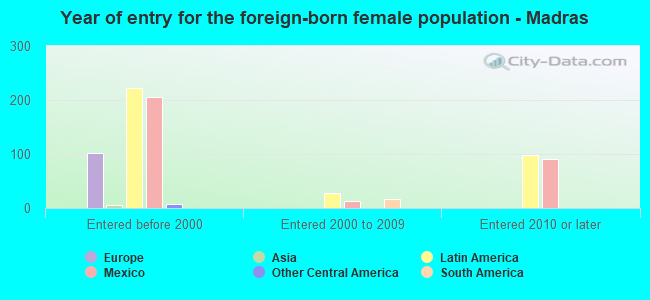
Place of birth - Foreign born (%)
Place of birth - Foreign born (%) - White
Place of birth - Foreign born (%) - Black or African American
Place of birth - Foreign born (%) - Asian
Place of birth - Foreign born (%) - Hispanic or Latino
Place of birth - Foreign born (%) - American Indian and Alaska Native
Place of birth - Foreign born (%) - Multirace
Place of birth - Foreign born (%) - Other Race
Residents speaking English at home (%)
Residents speaking English at home - Born in the United States (%)
Residents speaking English at home - Native, born elsewhere (%)
Residents speaking English at home - Foreign born (%)
Residents speaking Spanish at home (%)
Residents speaking Spanish at home - Born in the United States (%)
Residents speaking Spanish at home - Native, born elsewhere (%)
Residents speaking Spanish at home - Foreign born (%)
Residents speaking other language at home (%)
Residents speaking other language at home - Born in the United States (%)
Residents speaking other language at home - Native, born elsewhere (%)
Residents speaking other language at home - Foreign born (%)
Marital status - Never married (%)
Marital status - Now married (%)
Marital status - Separated (%)
Marital status - Widowed (%)
Marital status - Divorced (%)
Ancestries Reported - Arab (%)
Ancestries Reported - Czech (%)
Ancestries Reported - Danish (%)
Ancestries Reported - Dutch (%)
Ancestries Reported - English (%)
Ancestries Reported - French (%)
Ancestries Reported - French Canadian (%)
Ancestries Reported - German (%)
Ancestries Reported - Greek (%)
Ancestries Reported - Hungarian (%)
Ancestries Reported - Irish (%)
Ancestries Reported - Italian (%)
Ancestries Reported - Lithuanian (%)
Ancestries Reported - Norwegian (%)
Ancestries Reported - Polish (%)
Ancestries Reported - Portuguese (%)
Ancestries Reported - Russian (%)
Ancestries Reported - Scotch-Irish (%)
Ancestries Reported - Scottish (%)
Ancestries Reported - Slovak (%)
Ancestries Reported - Subsaharan African (%)
Ancestries Reported - Swedish (%)
Ancestries Reported - Swiss (%)
Ancestries Reported - Ukrainian (%)
Ancestries Reported - United States (%)
Ancestries Reported - Welsh (%)
Ancestries Reported - West Indian (%)
Ancestries Reported - Other (%)
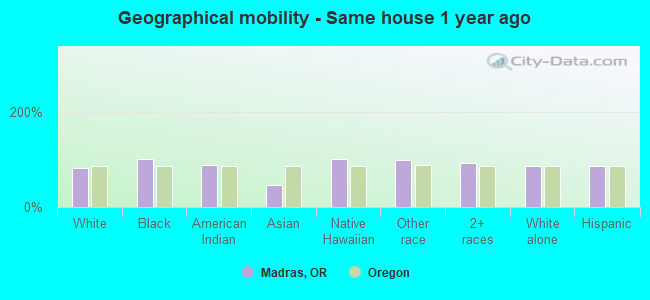
Geographical mobility - Same house 1 year ago (%)
Geographical mobility - Same house 1 year ago (%) - White
Geographical mobility - Same house 1 year ago (%) - Black or African American
Geographical mobility - Same house 1 year ago (%) - Asian
Geographical mobility - Same house 1 year ago (%) - Hispanic or Latino
Geographical mobility - Same house 1 year ago (%) - American Indian and Alaska Native
Geographical mobility - Same house 1 year ago (%) - Multirace
Geographical mobility - Same house 1 year ago (%) - Other Race
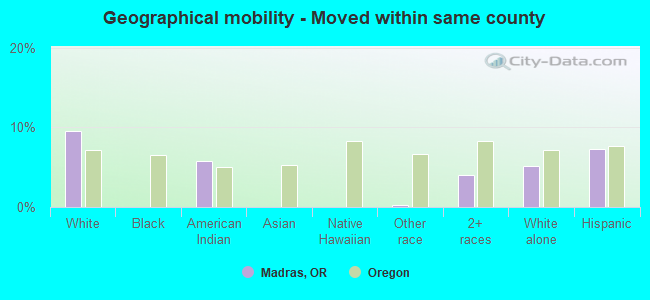
Geographical mobility - Moved within same county (%)
Geographical mobility - Moved within same county (%) - White
Geographical mobility - Moved within same county (%) - Black or African American
Geographical mobility - Moved within same county (%) - Asian
Geographical mobility - Moved within same county (%) - Hispanic or Latino
Geographical mobility - Moved within same county (%) - American Indian and Alaska Native
Geographical mobility - Moved within same county (%) - Multirace
Geographical mobility - Moved within same county (%) - Other Race
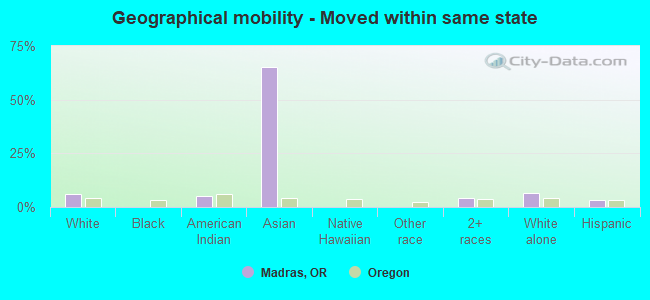
Geographical mobility - Moved from different county within same state (%)
Geographical mobility - Moved from different county within same state (%) - White
Geographical mobility - Moved from different county within same state (%) - Black or African American
Geographical mobility - Moved from different county within same state (%) - Asian
Geographical mobility - Moved from different county within same state (%) - Hispanic or Latino
Geographical mobility - Moved from different county within same state (%) - American Indian and Alaska Native
Geographical mobility - Moved from different county within same state (%) - Multirace
Geographical mobility - Moved from different county within same state (%) - Other Race
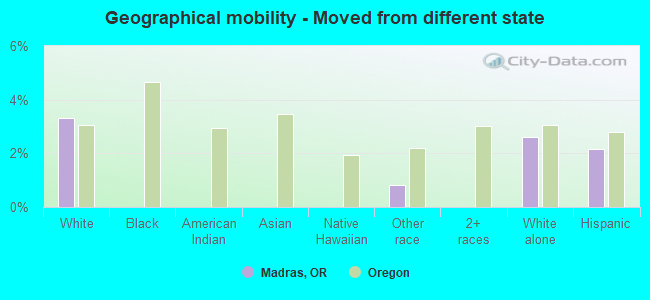
Geographical mobility - Moved from different state (%)
Geographical mobility - Moved from different state (%) - White
Geographical mobility - Moved from different state (%) - Black or African American
Geographical mobility - Moved from different state (%) - Asian
Geographical mobility - Moved from different state (%) - Hispanic or Latino
Geographical mobility - Moved from different state (%) - American Indian and Alaska Native
Geographical mobility - Moved from different state (%) - Multirace
Geographical mobility - Moved from different state (%) - Other Race
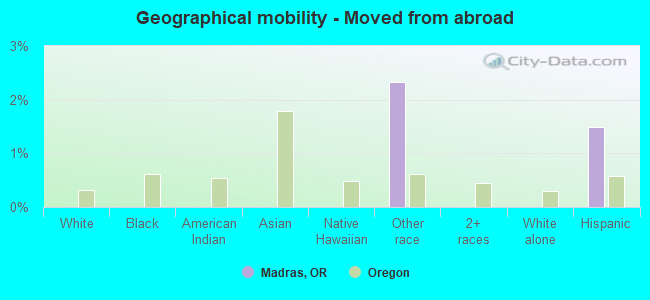
Geographical mobility - Moved from abroad (%)
Geographical mobility - Moved from abroad (%) - White
Geographical mobility - Moved from abroad (%) - Black or African American
Geographical mobility - Moved from abroad (%) - Asian
Geographical mobility - Moved from abroad (%) - Hispanic or Latino
Geographical mobility - Moved from abroad (%) - American Indian and Alaska Native
Geographical mobility - Moved from abroad (%) - Multirace
Geographical mobility - Moved from abroad (%) - Other Race
Place of birth for the foreign-born population - Ireland (%)
Place of birth for the foreign-born population - Denmark (%)
Place of birth for the foreign-born population - Norway (%)
Place of birth for the foreign-born population - Sweden (%)
Place of birth for the foreign-born population - United Kingdom (%)
Place of birth for the foreign-born population - England (%)
Place of birth for the foreign-born population - Scotland (%)
Place of birth for the foreign-born population - Other Northern Europe (%)
Place of birth for the foreign-born population - Austria (%)
Place of birth for the foreign-born population - Belgium (%)
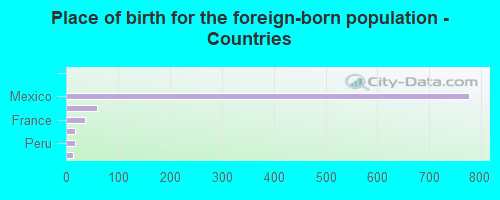
Place of birth for the foreign-born population - France (%)
Place of birth for the foreign-born population - Germany (%)
Place of birth for the foreign-born population - Netherlands (%)
Place of birth for the foreign-born population - Switzerland (%)
Place of birth for the foreign-born population - Other Western Europe (%)
Place of birth for the foreign-born population - Greece (%)
Place of birth for the foreign-born population - Italy (%)
Place of birth for the foreign-born population - Portugal (%)
Place of birth for the foreign-born population - Spain (%)
Place of birth for the foreign-born population - Other Southern Europe (%)
Place of birth for the foreign-born population - Albania (%)
Place of birth for the foreign-born population - Belarus (%)
Place of birth for the foreign-born population - Bosnia and Herzegovina (%)
Place of birth for the foreign-born population - Bulgaria (%)
Place of birth for the foreign-born population - Croatia (%)
Place of birth for the foreign-born population - Czechoslovakia (%)
Place of birth for the foreign-born population - Hungary (%)
Place of birth for the foreign-born population - Latvia (%)
Place of birth for the foreign-born population - Lithuania (%)
Place of birth for the foreign-born population - North Macedonia (Macedonia) (%)
Place of birth for the foreign-born population - Moldova (%)
Place of birth for the foreign-born population - Poland (%)
Place of birth for the foreign-born population - Romania (%)
Place of birth for the foreign-born population - Russia (%)
Place of birth for the foreign-born population - Serbia (%)
Place of birth for the foreign-born population - Ukraine (%)
Place of birth for the foreign-born population - Other Eastern Europe (%)
Place of birth for the foreign-born population - China (%)
Place of birth for the foreign-born population - Hong Kong (%)
Place of birth for the foreign-born population - Taiwan (%)
Place of birth for the foreign-born population - Japan (%)
Place of birth for the foreign-born population - Korea (%)
Place of birth for the foreign-born population - Other Eastern Asia (%)
Place of birth for the foreign-born population - Afghanistan (%)
Place of birth for the foreign-born population - Bangladesh (%)
Place of birth for the foreign-born population - India (%)
Place of birth for the foreign-born population - Iran (%)
Place of birth for the foreign-born population - Kazakhstan (%)
Place of birth for the foreign-born population - Nepal (%)
Place of birth for the foreign-born population - Pakistan (%)
Place of birth for the foreign-born population - Sri Lanka (%)
Place of birth for the foreign-born population - Uzbekistan (%)
Place of birth for the foreign-born population - Other South Central Asia (%)
Place of birth for the foreign-born population - Burma (%)
Place of birth for the foreign-born population - Cambodia (%)
Place of birth for the foreign-born population - Indonesia (%)
Place of birth for the foreign-born population - Laos (%)
Place of birth for the foreign-born population - Malaysia (%)
Place of birth for the foreign-born population - Philippines (%)
Place of birth for the foreign-born population - Singapore (%)
Place of birth for the foreign-born population - Thailand (%)
Place of birth for the foreign-born population - Vietnam (%)
Place of birth for the foreign-born population - Other South Eastern Asia (%)
Place of birth for the foreign-born population - Armenia (%)
Place of birth for the foreign-born population - Iraq (%)
Place of birth for the foreign-born population - Israel (%)
Place of birth for the foreign-born population - Jordan (%)
Place of birth for the foreign-born population - Kuwait (%)
Place of birth for the foreign-born population - Lebanon (%)
Place of birth for the foreign-born population - Saudi Arabia (%)
Place of birth for the foreign-born population - Syria (%)
Place of birth for the foreign-born population - Turkey (%)
Place of birth for the foreign-born population - Yemen (%)
Place of birth for the foreign-born population - Other Western Asia (%)
Place of birth for the foreign-born population - Eritrea (%)
Place of birth for the foreign-born population - Ethiopia (%)
Place of birth for the foreign-born population - Kenya (%)
Place of birth for the foreign-born population - Somalia (%)
Place of birth for the foreign-born population - Uganda (%)
Place of birth for the foreign-born population - Zimbabwe (%)
Place of birth for the foreign-born population - Other Eastern Africa (%)
Place of birth for the foreign-born population - Cameroon (%)
Place of birth for the foreign-born population - Congo (%)
Place of birth for the foreign-born population - Democratic Republic of Congo (Zaire) (%)
Place of birth for the foreign-born population - Other Middle Africa (%)
Place of birth for the foreign-born population - Egypt (%)
Place of birth for the foreign-born population - Morocco (%)
Place of birth for the foreign-born population - Sudan (%)
Place of birth for the foreign-born population - Other Northern Africa (%)
Place of birth for the foreign-born population - South Africa (%)
Place of birth for the foreign-born population - Other Southern Africa (%)
Place of birth for the foreign-born population - Cabo Verde (%)
Place of birth for the foreign-born population - Ghana (%)
Place of birth for the foreign-born population - Liberia (%)
Place of birth for the foreign-born population - Nigeria (%)
Place of birth for the foreign-born population - Senegal (%)
Place of birth for the foreign-born population - Sierra Leone (%)
Place of birth for the foreign-born population - Other Western Africa (%)
Place of birth for the foreign-born population - Australia (%)
Place of birth for the foreign-born population - New Zealand (%)
Place of birth for the foreign-born population - Fiji (%)
Place of birth for the foreign-born population - Micronesia (%)
Place of birth for the foreign-born population - Bahamas (%)
Place of birth for the foreign-born population - Barbados (%)
Place of birth for the foreign-born population - Cuba (%)
Place of birth for the foreign-born population - Dominica (%)
Place of birth for the foreign-born population - Dominican Republic (%)
Place of birth for the foreign-born population - Grenada (%)
Place of birth for the foreign-born population - Haiti (%)
Place of birth for the foreign-born population - Jamaica (%)
Place of birth for the foreign-born population - St. Vincent and the Grenadines (%)
Place of birth for the foreign-born population - Trinidad and Tobago (%)
Place of birth for the foreign-born population - West Indies (%)
Place of birth for the foreign-born population - Other Caribbean (%)
Place of birth for the foreign-born population - Belize (%)
Place of birth for the foreign-born population - Costa Rica (%)
Place of birth for the foreign-born population - El Salvador (%)
Place of birth for the foreign-born population - Guatemala (%)
Place of birth for the foreign-born population - Honduras (%)
Place of birth for the foreign-born population - Mexico (%)
Place of birth for the foreign-born population - Nicaragua (%)
Place of birth for the foreign-born population - Panama (%)
Place of birth for the foreign-born population - Other Central America (%)
Place of birth for the foreign-born population - Argentina (%)
Place of birth for the foreign-born population - Bolivia (%)
Place of birth for the foreign-born population - Brazil (%)
Place of birth for the foreign-born population - Chile (%)
Place of birth for the foreign-born population - Colombia (%)
Place of birth for the foreign-born population - Ecuador (%)
Place of birth for the foreign-born population - Guyana (%)
Place of birth for the foreign-born population - Peru (%)
Place of birth for the foreign-born population - Uruguay (%)
Place of birth for the foreign-born population - Venezuela (%)
Place of birth for the foreign-born population - Other South America (%)
Place of birth for the foreign-born population - Canada (%)
Place of birth for the foreign-born population - Other Northern America (%)
Place of birth for the foreign-born population - Other (%)
Latest news about races in Madras, OR collected exclusively by city-data.com from local newspapers, TV, and radio stations
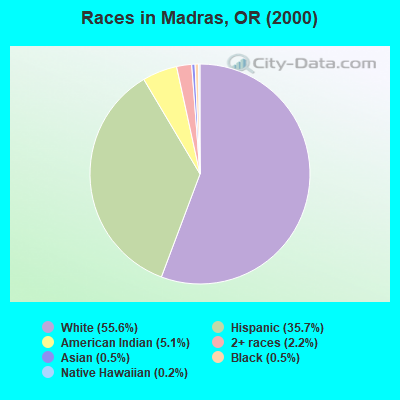
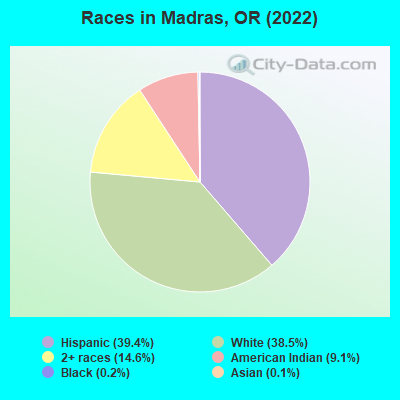
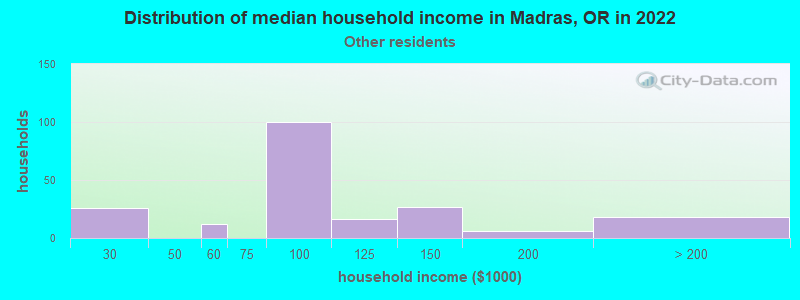
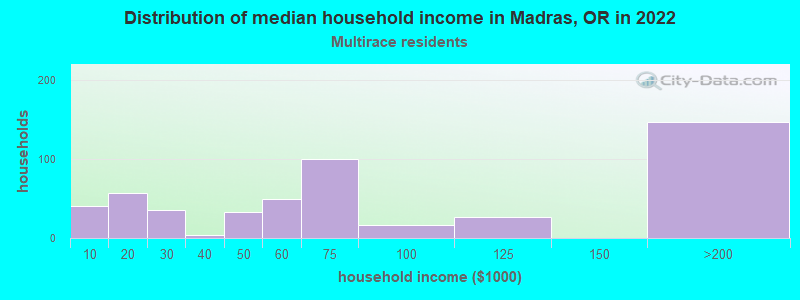
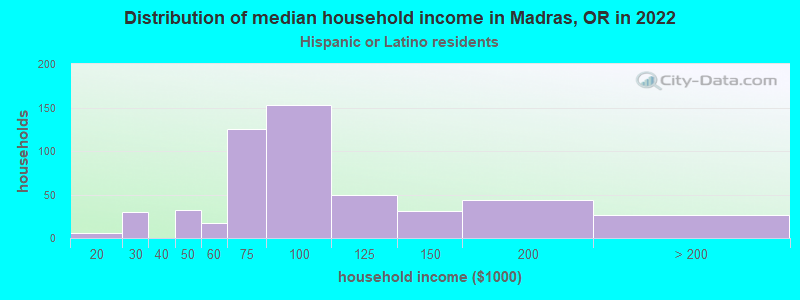
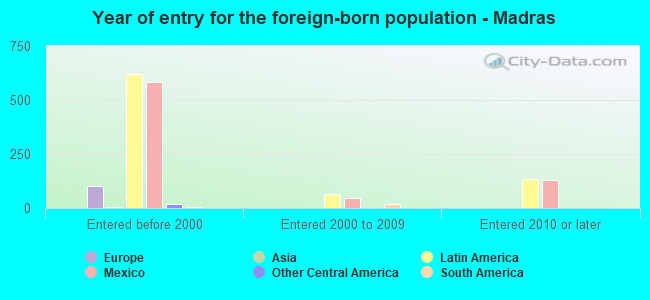
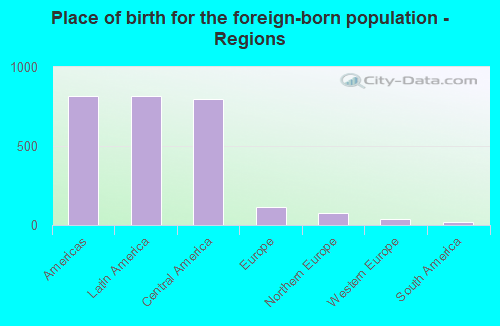
According to 2022 data, the most numerous races in Madras, OR are White alone (2,891 residents), Hispanic (2,962 residents), and Two or more races (1,095 residents). 69.8% of Madras residents speak English at home. 12.4% of Madras, OR residents are foreign-born (10.7% born in Latin America, 1.5% born in Europe), which is 27.4% greater than the foreign-born rate of 9.0% across the entire state of Oregon.
Race distribution in Madras
2000 2022
2,857,616 83.5% White alone 275,314 8.0% Hispanic 100,333 2.9% Asian alone 82,733 2.4% Two or more races 53,325 1.6% Black alone 40,130 1.2% American Indian alone 7,398 0.2% Native Hawaiian and Other 4,550 0.1% Other race alone
3,037,571 71.6% White alone 609,538 14.4% Hispanic 252,744 6.0% Two or more races 191,283 4.5% Asian alone 78,228 1.8% Black alone 29,399 0.7% American Indian alone 25,731 0.6% Other race alone 15,643 0.4% Native Hawaiian and Other
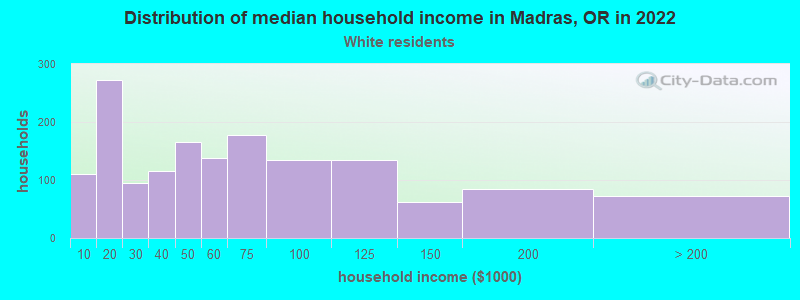
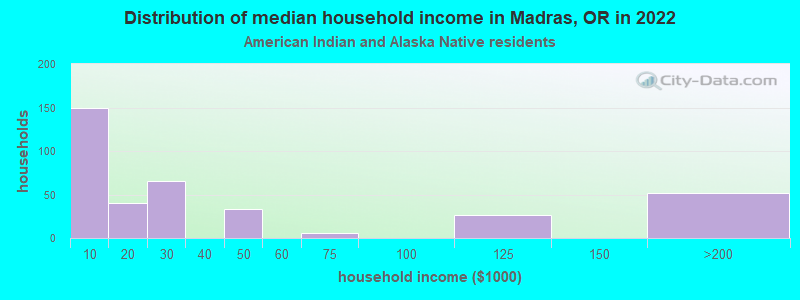
Income and house value in Madras Median household income in 2022 $46,577 White non-Hispanic householders$75,797 Some other race householders$72,126 Two or more races householders$74,841 Hispanic or Latino race householdersMedian 2022 house value $315,308 White Non-Hispanic householders$313,330 American Indian or Alaska Native householders $298,817 Asian householders$269,134 Some other race householders$313,330 Two or more races householders$275,400 Hispanic or Latino householders
Median age by race in Madras
44.2 Median age for White residents41.4 48.7 -664,634,145.7 Median age for Black or African American residents-692,929,292.2 -625,514,402.7 26.4 Median age for American Indian / Alaska Native residents26.5 23.5 -693,476,317.4 Median age for Asian residents-696,883,852.0 -681,895,092.4 -764,705,881.6 Median age for Native Hawaiian / Pacific Islander residents-764,119,600.6 -774,891,774.1 17.7 Median age for Other race residents19.2 17.7 26.2 Median age for Two or more races residents29.8 21.1 48.1 Median age for White alone residents44.9 49.2 21.3 Median age for Hispanic or Latino residents25.9 19.9
Owner/renter occupied households by race in Madras
House owners and renters - White residents 841 53.9% Owner occupied720 46.1% Renter occupiedHouse owners and renters - American Indian / Alaska Native residents 24 6.7% Owner occupied337 93.3% Renter occupiedHouse owners and renters - Native Hawaiian / Pacific Islander residents 6 100.0% Owner occupiedHouse owners and renters - Other race residents 78 36.2% Owner occupied137 63.8% Renter occupiedHouse owners and renters - Two or more races residents 370 73.1% Owner occupied136 26.9% Renter occupiedHouse owners and renters - White alone residents 797 56.5% Owner occupied615 43.5% Renter occupiedHouse owners and renters - Hispanic or Latino residents 215 41.2% Owner occupied307 58.8% Renter occupied
Language usage in Madras
English speakers - Total 69.8% of residents of Madras speak English at home.
28.1% of residents speak Spanish at home 1,203 64.2% Speak English very well670 35.8% Speak English less than very well2.4% of residents speak other language at home 148 93.7% Speak English very well10 6.3% Speak English less than very well
English speakers - Born in the United States 87.1% of residents of Madras speak English at home.
9.4% of residents speak Spanish at home 150 76.1% Speak English very well47 23.9% Speak English less than very well3.5% of residents speak other language at home 73 100.0% Speak English very well
All residents speak only English at home
English speakers - Foreign-born 10.3% of residents of Madras speak English at home.
89.8% of residents speak Spanish at home 274 32.7% Speak English very well565 67.3% Speak English less than very well3.5% of residents speak other language at home 33 100.0% Speak English very well
White (Caucasian) - Speak only English Native:
87.8% (2,721)Foreign-born:
33.2% (71)
White (Caucasian) - Speak another language Native:
10.2% (315)Foreign-born:
64.6% (137)
American Indian / Alaska Native - Speak another language Native:
14.6% (109)Foreign-born:
100.0% (45)
Asian - Speak only English Native:
100.0% (6)Foreign-born:
100.0% (5)
Other race - Speak another language Native:
57.6% (541)Foreign-born:
100.0% (512)
Two or more races - Speak only English Native:
79.2% (1,029)Foreign-born:
6.1% (19)
Two or more races - Speak another language Native:
21.0% (273)Foreign-born:
94.1% (291)
White alone - Speak only English Native:
98.5% (2,621)Foreign-born:
68.9% (75)
White alone - Speak another language Native:
1.5% (41)Foreign-born:
31.9% (35)
Hispanic or Latino - Speak only English Native:
36.8% (614)Foreign-born:
1.8% (15)
Hispanic or Latino - Speak another language Native:
61.7% (1,030)Foreign-born:
97.8% (839)
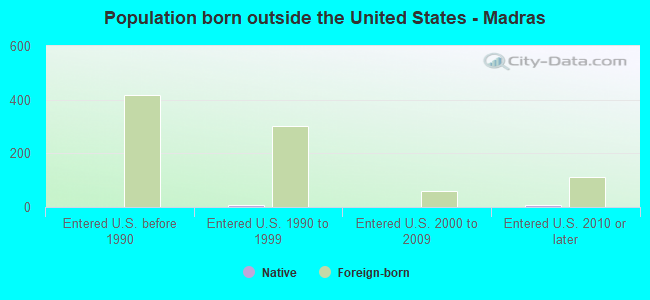
Foreign-born residents in Madras 932 residents are foreign born (10.7% Latin America , 1.5% Europe ).
This city:
12.4%Oregon:
9.8%
Marital status for residents in Madras Marital status - White (Caucasian) population 15 years and over
Males 34.4% Never married40.5% Now married1.7% Separated6.0% Widowed17.4% DivorcedFemales 22.6% Never married38.2% Now married6.9% Separated15.0% Widowed17.3% DivorcedWomen who did not give birth in the past 12 months Now married:
42.0% (319)Unmarried:
58.0% (440)
Marital status - American Indian / Alaska Native population 15 years and over
Males 58.0% Never married14.0% Now married0.0% Separated24.1% Widowed3.9% DivorcedFemales 47.7% Never married26.8% Now married0.0% Separated7.3% Widowed18.1% DivorcedWomen who gave birth in the past 12 months Now married:
0.0% (0)Unmarried:
100.0% (16)
Women who did not give birth in the past 12 months Now married:
28.9% (77)Unmarried:
71.1% (188)
Marital status - Other race population 15 years and over
Males 31.4% Never married53.7% Now married0.0% Separated0.0% Widowed14.9% DivorcedFemales 60.7% Never married39.3% Now married0.0% Separated0.0% Widowed0.0% DivorcedWomen who gave birth in the past 12 months Now married:
100.0% (108)Unmarried:
0.0% (0)
Women who did not give birth in the past 12 months Now married:
23.0% (116)Unmarried:
77.0% (388)
Marital status - Two or more races population 15 years and over
Males 18.6% Never married72.6% Now married0.0% Separated0.0% Widowed8.8% DivorcedFemales 33.0% Never married50.6% Now married4.7% Separated8.1% Widowed3.7% DivorcedWomen who did not give birth in the past 12 months Now married:
50.3% (238)Unmarried:
49.7% (236)
Marital status - White alone, not Hispanic / Latino population 15 years and over
Males 31.3% Never married39.9% Now married2.2% Separated7.5% Widowed19.2% DivorcedFemales 16.0% Never married36.3% Now married8.5% Separated18.4% Widowed20.8% DivorcedWomen who did not give birth in the past 12 months Now married:
47.1% (289)Unmarried:
52.9% (325)
Marital status - Hispanic or Latino population 15 years and over
Males 33.0% Never married54.6% Now married0.0% Separated0.0% Widowed12.4% DivorcedFemales 54.4% Never married45.0% Now married0.0% Separated0.0% Widowed0.6% DivorcedWomen who gave birth in the past 12 months Now married:
100.0% (83)Unmarried:
0.0% (0)
Women who did not give birth in the past 12 months Now married:
25.6% (190)Unmarried:
74.4% (552)
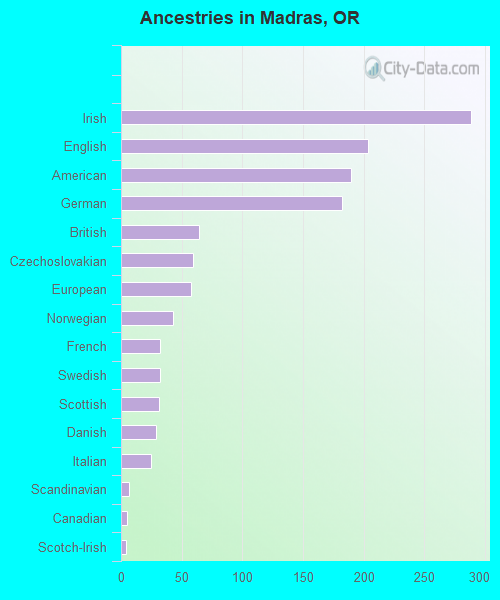
Ancestries in Madras
289 8.1% Irish204 5.7% English190 5.3% American182 5.1% German64 1.8% British59 1.7% Czechoslovakian58 1.6% European43 1.2% Norwegian32 0.9% French32 0.9% Swedish31 0.9% Scottish29 0.8% Danish25 0.7% Italian7 0.2% Scandinavian5 0.1% Canadian4 0.1% Scotch-Irish
Children Nativity (place of birth) in Madras
Children under 6 years - Living with two parents Both parents native 360 100.0% NativeBoth parents foreign-born 164 100.0% NativeOne native, one foreign-born parent 36 100.0% NativeChildren under 6 years - Living with one parent Native parent 253 100.0% NativeChildren 6 to 17 years - Living with two parents Both parents native 422 100.0% NativeBoth parents foreign-born 481 100.0% NativeChildren 6 to 17 years - Living with one parent Native parent 567 100.0% NativeForeign-born parent 6 50.1% Native6 49.9% Foreign-born
Grandparents responsible for own grandchildren in Madras
Grandparents (30 to 59 years) White / Caucasian 2 32.0% Responsible for grandchildren5 68.0% Not responsible for grandchildrenAmerican Indian / Alaska Native 17 100.0% Responsible for grandchildrenOther race 6 100.0% Responsible for grandchildrenWhite alone, not Hispanic / Latino 2 100.0% Responsible for grandchildrenHispanic or Latino 15 75.9% Responsible for grandchildren5 24.1% Not responsible for grandchildrenGrandparents (60 years and over) White / Caucasian 2 35.0% Responsible for grandchildren4 65.0% Not responsible for grandchildrenAmerican Indian / Alaska Native 99 100.0% Responsible for grandchildrenWhite alone, not Hispanic / Latino 2 34.8% Responsible for grandchildren4 65.2% Not responsible for grandchildrenHispanic or Latino 28 100.0% Not responsible for grandchildren