Races in Marietta, Ohio (OH) Detailed Stats
Data:
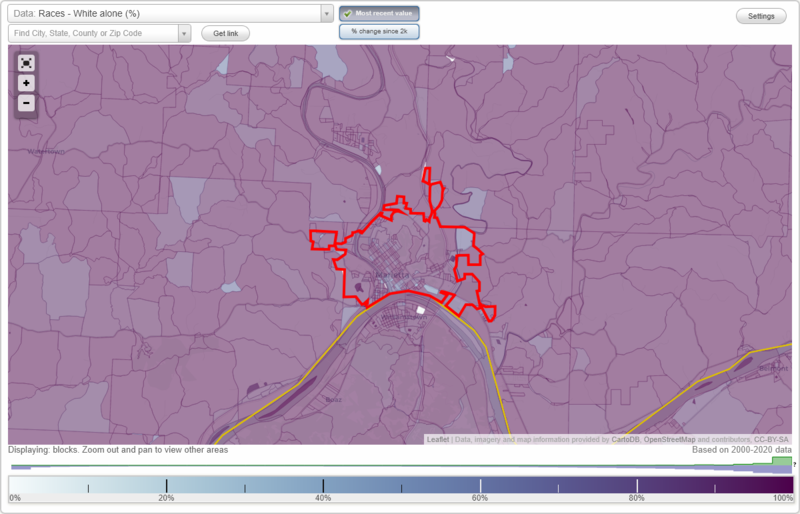
Races - White alone (%)
Races - White alone (% change since 2000)
Races - Black alone (%)
Races - Black alone (% change since 2000)
Races - American Indian alone (%)
Races - American Indian alone (% change since 2000)
Races - Asian alone (%)
Races - Asian alone (% change since 2000)
Races - Hispanic (%)
Races - Hispanic (% change since 2000)
Races - Native Hawaiian and Other Pacific Islander alone (%)
Races - Native Hawaiian and Other Pacific Islander alone (% change since 2000)
Races - Two or more races(%)
Races - Two or more races(% change since 2000)
Races - Other race alone (%)
Races - Other race alone (% change since 2000)
Racial diversity
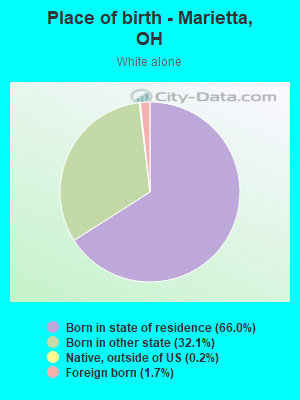
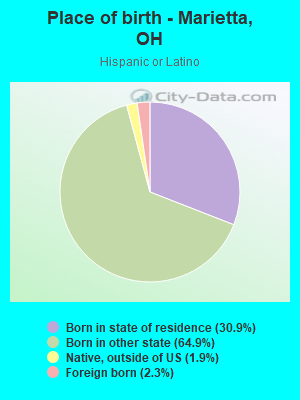
Place of birth - Born in state of residence (%)
Place of birth - Born in state of residence (%) - White
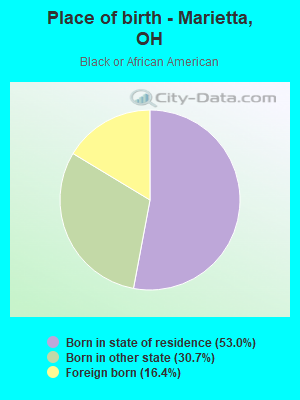
Place of birth - Born in state of residence (%) - Black or African American
Place of birth - Born in state of residence (%) - Asian
Place of birth - Born in state of residence (%) - Hispanic or Latino
Place of birth - Born in state of residence (%) - American Indian and Alaska Native
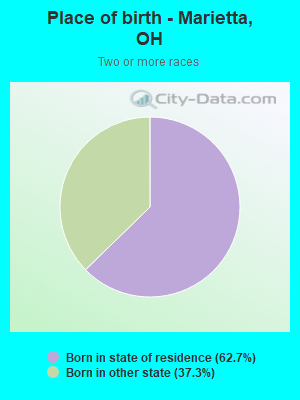
Place of birth - Born in state of residence (%) - Multirace
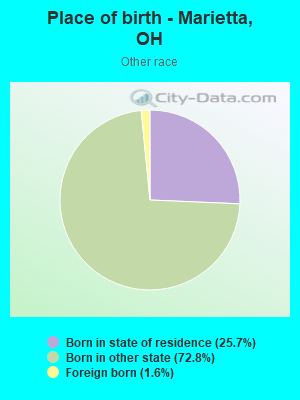
Place of birth - Born in state of residence (%) - Other Race
Place of birth - Born in other state (%)
Place of birth - Born in other state (%) - White
Place of birth - Born in other state (%) - Black or African American
Place of birth - Born in other state (%) - Asian
Place of birth - Born in other state (%) - Hispanic or Latino
Place of birth - Born in other state (%) - American Indian and Alaska Native
Place of birth - Born in other state (%) - Multirace
Place of birth - Born in other state (%) - Other Race
Place of birth - Native, outside of US (%)
Place of birth - Native, outside of US (%) - White
Place of birth - Native, outside of US (%) - Black or African American
Place of birth - Native, outside of US (%) - Asian
Place of birth - Native, outside of US (%) - Hispanic or Latino
Place of birth - Native, outside of US (%) - American Indian and Alaska Native
Place of birth - Native, outside of US (%) - Multirace
Place of birth - Native, outside of US (%) - Other Race
Place of birth - Foreign born (%)
Place of birth - Foreign born (%) - White
Place of birth - Foreign born (%) - Black or African American
Place of birth - Foreign born (%) - Asian
Place of birth - Foreign born (%) - Hispanic or Latino
Place of birth - Foreign born (%) - American Indian and Alaska Native
Place of birth - Foreign born (%) - Multirace
Place of birth - Foreign born (%) - Other Race
Residents speaking English at home (%)
Residents speaking English at home - Born in the United States (%)
Residents speaking English at home - Native, born elsewhere (%)
Residents speaking English at home - Foreign born (%)
Residents speaking Spanish at home (%)
Residents speaking Spanish at home - Born in the United States (%)
Residents speaking Spanish at home - Native, born elsewhere (%)
Residents speaking Spanish at home - Foreign born (%)
Residents speaking other language at home (%)
Residents speaking other language at home - Born in the United States (%)
Residents speaking other language at home - Native, born elsewhere (%)
Residents speaking other language at home - Foreign born (%)
Marital status - Never married (%)
Marital status - Now married (%)
Marital status - Separated (%)
Marital status - Widowed (%)
Marital status - Divorced (%)
Ancestries Reported - Arab (%)
Ancestries Reported - Czech (%)
Ancestries Reported - Danish (%)
Ancestries Reported - Dutch (%)
Ancestries Reported - English (%)
Ancestries Reported - French (%)
Ancestries Reported - French Canadian (%)
Ancestries Reported - German (%)
Ancestries Reported - Greek (%)
Ancestries Reported - Hungarian (%)
Ancestries Reported - Irish (%)
Ancestries Reported - Italian (%)
Ancestries Reported - Lithuanian (%)
Ancestries Reported - Norwegian (%)
Ancestries Reported - Polish (%)
Ancestries Reported - Portuguese (%)
Ancestries Reported - Russian (%)
Ancestries Reported - Scotch-Irish (%)
Ancestries Reported - Scottish (%)
Ancestries Reported - Slovak (%)
Ancestries Reported - Subsaharan African (%)
Ancestries Reported - Swedish (%)
Ancestries Reported - Swiss (%)
Ancestries Reported - Ukrainian (%)
Ancestries Reported - United States (%)
Ancestries Reported - Welsh (%)
Ancestries Reported - West Indian (%)
Ancestries Reported - Other (%)
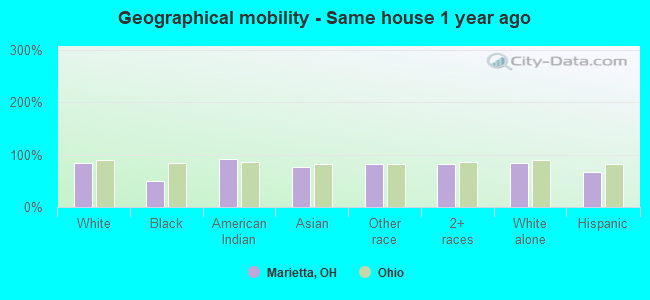
Geographical mobility - Same house 1 year ago (%)
Geographical mobility - Same house 1 year ago (%) - White
Geographical mobility - Same house 1 year ago (%) - Black or African American
Geographical mobility - Same house 1 year ago (%) - Asian
Geographical mobility - Same house 1 year ago (%) - Hispanic or Latino
Geographical mobility - Same house 1 year ago (%) - American Indian and Alaska Native
Geographical mobility - Same house 1 year ago (%) - Multirace
Geographical mobility - Same house 1 year ago (%) - Other Race
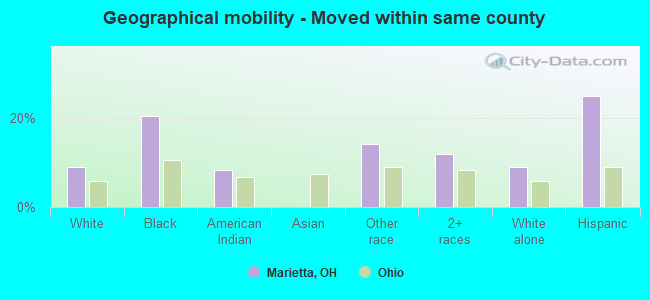
Geographical mobility - Moved within same county (%)
Geographical mobility - Moved within same county (%) - White
Geographical mobility - Moved within same county (%) - Black or African American
Geographical mobility - Moved within same county (%) - Asian
Geographical mobility - Moved within same county (%) - Hispanic or Latino
Geographical mobility - Moved within same county (%) - American Indian and Alaska Native
Geographical mobility - Moved within same county (%) - Multirace
Geographical mobility - Moved within same county (%) - Other Race
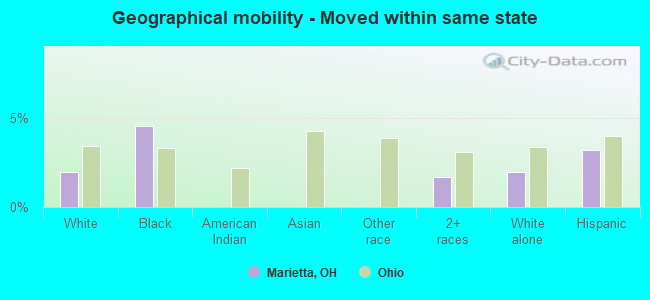
Geographical mobility - Moved from different county within same state (%)
Geographical mobility - Moved from different county within same state (%) - White
Geographical mobility - Moved from different county within same state (%) - Black or African American
Geographical mobility - Moved from different county within same state (%) - Asian
Geographical mobility - Moved from different county within same state (%) - Hispanic or Latino
Geographical mobility - Moved from different county within same state (%) - American Indian and Alaska Native
Geographical mobility - Moved from different county within same state (%) - Multirace
Geographical mobility - Moved from different county within same state (%) - Other Race
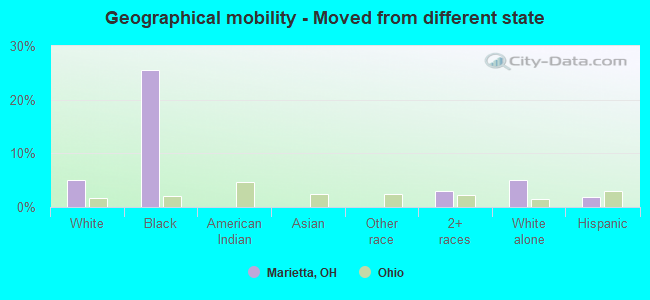
Geographical mobility - Moved from different state (%)
Geographical mobility - Moved from different state (%) - White
Geographical mobility - Moved from different state (%) - Black or African American
Geographical mobility - Moved from different state (%) - Asian
Geographical mobility - Moved from different state (%) - Hispanic or Latino
Geographical mobility - Moved from different state (%) - American Indian and Alaska Native
Geographical mobility - Moved from different state (%) - Multirace
Geographical mobility - Moved from different state (%) - Other Race
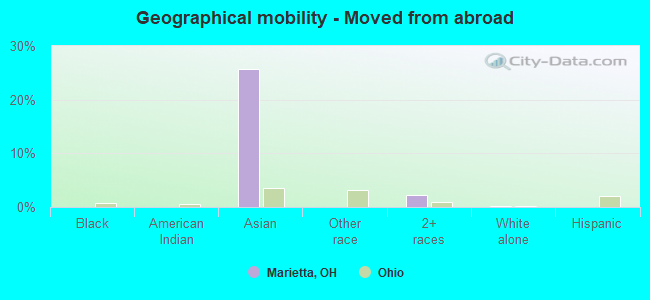
Geographical mobility - Moved from abroad (%)
Geographical mobility - Moved from abroad (%) - White
Geographical mobility - Moved from abroad (%) - Black or African American
Geographical mobility - Moved from abroad (%) - Asian
Geographical mobility - Moved from abroad (%) - Hispanic or Latino
Geographical mobility - Moved from abroad (%) - American Indian and Alaska Native
Geographical mobility - Moved from abroad (%) - Multirace
Geographical mobility - Moved from abroad (%) - Other Race
Place of birth for the foreign-born population - Ireland (%)
Place of birth for the foreign-born population - Denmark (%)
Place of birth for the foreign-born population - Norway (%)
Place of birth for the foreign-born population - Sweden (%)
Place of birth for the foreign-born population - United Kingdom (%)
Place of birth for the foreign-born population - England (%)
Place of birth for the foreign-born population - Scotland (%)
Place of birth for the foreign-born population - Other Northern Europe (%)
Place of birth for the foreign-born population - Austria (%)
Place of birth for the foreign-born population - Belgium (%)
Place of birth for the foreign-born population - France (%)
Place of birth for the foreign-born population - Germany (%)
Place of birth for the foreign-born population - Netherlands (%)
Place of birth for the foreign-born population - Switzerland (%)
Place of birth for the foreign-born population - Other Western Europe (%)
Place of birth for the foreign-born population - Greece (%)
Place of birth for the foreign-born population - Italy (%)
Place of birth for the foreign-born population - Portugal (%)
Place of birth for the foreign-born population - Spain (%)
Place of birth for the foreign-born population - Other Southern Europe (%)
Place of birth for the foreign-born population - Albania (%)
Place of birth for the foreign-born population - Belarus (%)
Place of birth for the foreign-born population - Bosnia and Herzegovina (%)
Place of birth for the foreign-born population - Bulgaria (%)
Place of birth for the foreign-born population - Croatia (%)
Place of birth for the foreign-born population - Czechoslovakia (%)
Place of birth for the foreign-born population - Hungary (%)
Place of birth for the foreign-born population - Latvia (%)
Place of birth for the foreign-born population - Lithuania (%)
Place of birth for the foreign-born population - North Macedonia (Macedonia) (%)
Place of birth for the foreign-born population - Moldova (%)
Place of birth for the foreign-born population - Poland (%)
Place of birth for the foreign-born population - Romania (%)
Place of birth for the foreign-born population - Russia (%)
Place of birth for the foreign-born population - Serbia (%)
Place of birth for the foreign-born population - Ukraine (%)
Place of birth for the foreign-born population - Other Eastern Europe (%)
Place of birth for the foreign-born population - China (%)
Place of birth for the foreign-born population - Hong Kong (%)
Place of birth for the foreign-born population - Taiwan (%)
Place of birth for the foreign-born population - Japan (%)
Place of birth for the foreign-born population - Korea (%)
Place of birth for the foreign-born population - Other Eastern Asia (%)
Place of birth for the foreign-born population - Afghanistan (%)
Place of birth for the foreign-born population - Bangladesh (%)
Place of birth for the foreign-born population - India (%)
Place of birth for the foreign-born population - Iran (%)
Place of birth for the foreign-born population - Kazakhstan (%)
Place of birth for the foreign-born population - Nepal (%)
Place of birth for the foreign-born population - Pakistan (%)
Place of birth for the foreign-born population - Sri Lanka (%)
Place of birth for the foreign-born population - Uzbekistan (%)
Place of birth for the foreign-born population - Other South Central Asia (%)
Place of birth for the foreign-born population - Burma (%)
Place of birth for the foreign-born population - Cambodia (%)
Place of birth for the foreign-born population - Indonesia (%)
Place of birth for the foreign-born population - Laos (%)
Place of birth for the foreign-born population - Malaysia (%)
Place of birth for the foreign-born population - Philippines (%)
Place of birth for the foreign-born population - Singapore (%)
Place of birth for the foreign-born population - Thailand (%)
Place of birth for the foreign-born population - Vietnam (%)
Place of birth for the foreign-born population - Other South Eastern Asia (%)
Place of birth for the foreign-born population - Armenia (%)
Place of birth for the foreign-born population - Iraq (%)
Place of birth for the foreign-born population - Israel (%)
Place of birth for the foreign-born population - Jordan (%)
Place of birth for the foreign-born population - Kuwait (%)
Place of birth for the foreign-born population - Lebanon (%)
Place of birth for the foreign-born population - Saudi Arabia (%)
Place of birth for the foreign-born population - Syria (%)
Place of birth for the foreign-born population - Turkey (%)
Place of birth for the foreign-born population - Yemen (%)
Place of birth for the foreign-born population - Other Western Asia (%)
Place of birth for the foreign-born population - Eritrea (%)
Place of birth for the foreign-born population - Ethiopia (%)
Place of birth for the foreign-born population - Kenya (%)
Place of birth for the foreign-born population - Somalia (%)
Place of birth for the foreign-born population - Uganda (%)
Place of birth for the foreign-born population - Zimbabwe (%)
Place of birth for the foreign-born population - Other Eastern Africa (%)
Place of birth for the foreign-born population - Cameroon (%)
Place of birth for the foreign-born population - Congo (%)
Place of birth for the foreign-born population - Democratic Republic of Congo (Zaire) (%)
Place of birth for the foreign-born population - Other Middle Africa (%)
Place of birth for the foreign-born population - Egypt (%)
Place of birth for the foreign-born population - Morocco (%)
Place of birth for the foreign-born population - Sudan (%)
Place of birth for the foreign-born population - Other Northern Africa (%)
Place of birth for the foreign-born population - South Africa (%)
Place of birth for the foreign-born population - Other Southern Africa (%)
Place of birth for the foreign-born population - Cabo Verde (%)
Place of birth for the foreign-born population - Ghana (%)
Place of birth for the foreign-born population - Liberia (%)
Place of birth for the foreign-born population - Nigeria (%)
Place of birth for the foreign-born population - Senegal (%)
Place of birth for the foreign-born population - Sierra Leone (%)
Place of birth for the foreign-born population - Other Western Africa (%)
Place of birth for the foreign-born population - Australia (%)
Place of birth for the foreign-born population - New Zealand (%)
Place of birth for the foreign-born population - Fiji (%)
Place of birth for the foreign-born population - Micronesia (%)
Place of birth for the foreign-born population - Bahamas (%)
Place of birth for the foreign-born population - Barbados (%)
Place of birth for the foreign-born population - Cuba (%)
Place of birth for the foreign-born population - Dominica (%)
Place of birth for the foreign-born population - Dominican Republic (%)
Place of birth for the foreign-born population - Grenada (%)
Place of birth for the foreign-born population - Haiti (%)
Place of birth for the foreign-born population - Jamaica (%)
Place of birth for the foreign-born population - St. Vincent and the Grenadines (%)
Place of birth for the foreign-born population - Trinidad and Tobago (%)
Place of birth for the foreign-born population - West Indies (%)
Place of birth for the foreign-born population - Other Caribbean (%)
Place of birth for the foreign-born population - Belize (%)
Place of birth for the foreign-born population - Costa Rica (%)
Place of birth for the foreign-born population - El Salvador (%)
Place of birth for the foreign-born population - Guatemala (%)
Place of birth for the foreign-born population - Honduras (%)
Place of birth for the foreign-born population - Mexico (%)
Place of birth for the foreign-born population - Nicaragua (%)
Place of birth for the foreign-born population - Panama (%)
Place of birth for the foreign-born population - Other Central America (%)
Place of birth for the foreign-born population - Argentina (%)
Place of birth for the foreign-born population - Bolivia (%)
Place of birth for the foreign-born population - Brazil (%)
Place of birth for the foreign-born population - Chile (%)
Place of birth for the foreign-born population - Colombia (%)
Place of birth for the foreign-born population - Ecuador (%)
Place of birth for the foreign-born population - Guyana (%)
Place of birth for the foreign-born population - Peru (%)
Place of birth for the foreign-born population - Uruguay (%)
Place of birth for the foreign-born population - Venezuela (%)
Place of birth for the foreign-born population - Other South America (%)
Place of birth for the foreign-born population - Canada (%)
Place of birth for the foreign-born population - Other Northern America (%)
Place of birth for the foreign-born population - Other (%)
Latest news about races in Marietta, OH collected exclusively by city-data.com from local newspapers, TV, and radio stations
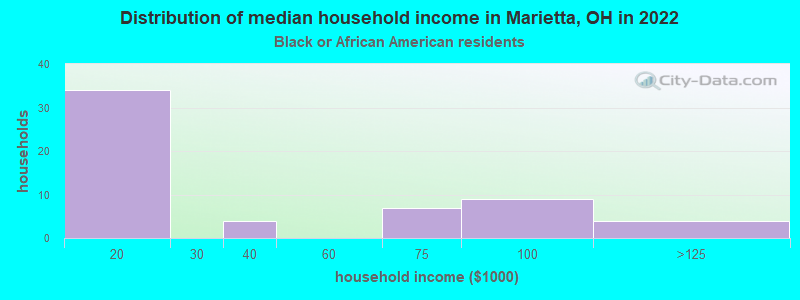
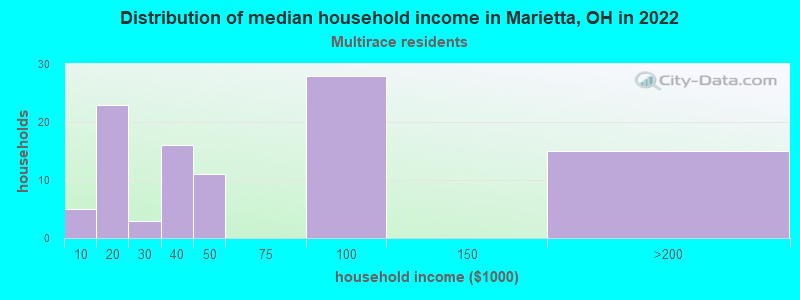
According to 2022 data, the most numerous races in Marietta, OH are White alone (12,078 residents), Black alone (295 residents), and Two or more races (332 residents). 96.3% of Marietta residents speak English at home. 3.7% of Marietta, OH residents are foreign-born (1.7% born in Asia, 1.2% born in Europe), which is 8.7% less than the foreign-born rate of 4.0% across the entire state of Ohio.
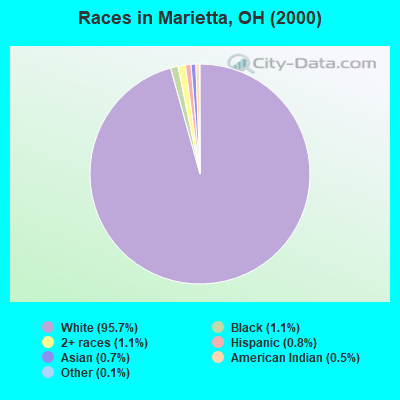
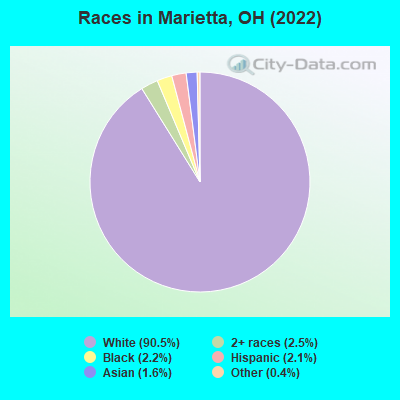
Race distribution in Marietta
2000 2022
9,538,111 84.0% White alone 1,290,662 11.4% Black alone 217,123 1.9% Hispanic 137,770 1.2% Two or more races 131,670 1.2% Asian alone 21,985 0.2% American Indian alone 13,483 0.1% Other race alone 2,336 0.02% Native Hawaiian and Other
8,948,793 76.1% White alone 1,401,403 11.9% Black alone 529,291 4.5% Two or more races 517,232 4.4% Hispanic 293,387 2.5% Asian alone 52,805 0.4% Other race alone 9,785 0.08% American Indian alone 3,362 0.03% Native Hawaiian and Other
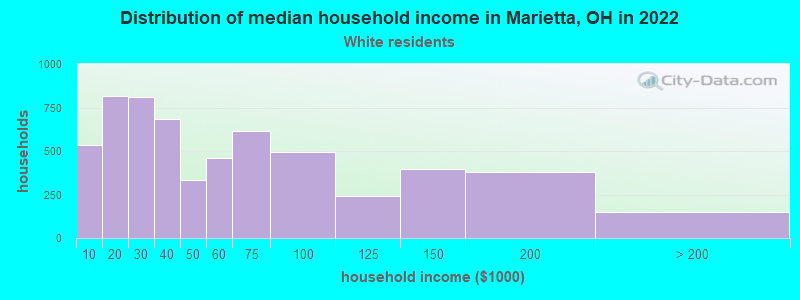
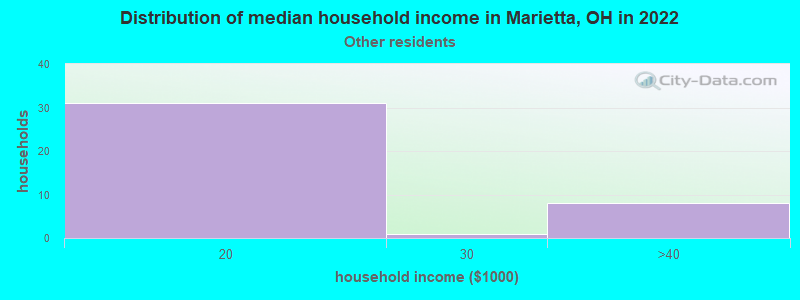
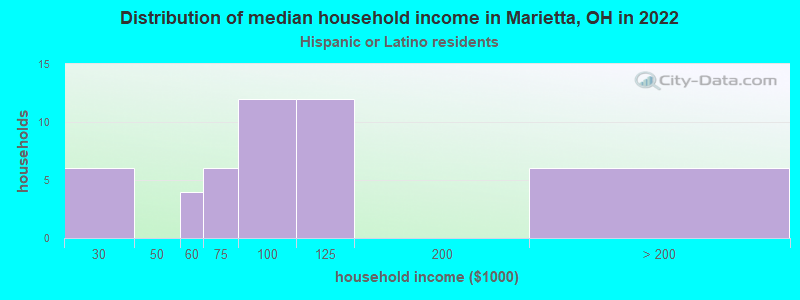
Income and house value in Marietta Median household income in 2022 $44,059 White non-Hispanic householders$80,029 Hispanic or Latino race householdersMedian 2022 house value $161,407 White Non-Hispanic householders$205,130 Black or African American householders $513,153 Asian householders$299,104 Native Hawaiian and other Pacific Islander householders
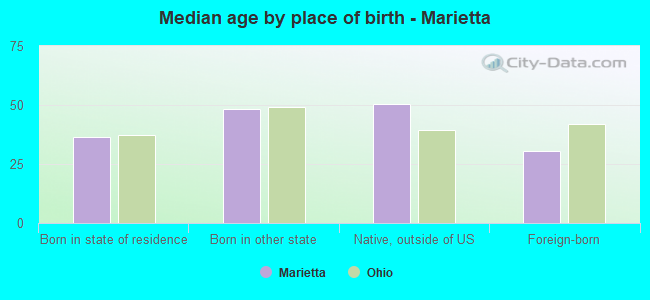
Median age by race in Marietta
41.5 Median age for White residents43.1 40.7 25.6 Median age for Black or African American residents24.3 41.8 -676,818,950.3 Median age for American Indian / Alaska Native residents-685,185,184.5 -658,163,264.6 23.5 Median age for Asian residents23.6 26.3 -800,387,596.1 Median age for Native Hawaiian / Pacific Islander residents-750,242,953.6 -805,394,989.6 41.5 Median age for Other race residents42.8 5.6 12.5 Median age for Two or more races residents11.2 12.7 42.4 Median age for White alone residents44.1 41.3 22.0 Median age for Hispanic or Latino residents10.1 27.9
Owner/renter occupied households by race in Marietta
House owners and renters - White residents 3,380 57.7% Owner occupied2,478 42.3% Renter occupiedHouse owners and renters - Black or African American residents 45 70.5% Owner occupied19 29.5% Renter occupiedHouse owners and renters - American Indian / Alaska Native residents 8 100.0% Renter occupiedHouse owners and renters - Asian residents 27 100.0% Renter occupiedHouse owners and renters - Other race residents 52 97.6% Owner occupied1 2.4% Renter occupiedHouse owners and renters - Two or more races residents 33 32.3% Owner occupied68 67.7% Renter occupiedHouse owners and renters - White alone residents 3,373 57.4% Owner occupied2,499 42.6% Renter occupiedHouse owners and renters - Hispanic or Latino residents 20 44.0% Owner occupied25 56.0% Renter occupied
Language usage in Marietta
English speakers - Total 96.3% of residents of Marietta speak English at home.
0.5% of residents speak Spanish at home 39 60.0% Speak English very well26 40.0% Speak English less than very well3.0% of residents speak other language at home 221 58.0% Speak English very well160 42.0% Speak English less than very well
English speakers - Born in the United States 98.7% of residents of Marietta speak English at home.
0.1% of residents speak Spanish at home 5 100.0% Speak English less than very well1.1% of residents speak other language at home 33 73.3% Speak English very well12 26.7% Speak English less than very well
English speakers - Native, born elsewhere 82.1% of residents of Marietta speak English at home.
17.9% of residents speak Spanish at home 5 100.0% Speak English less than very well
English speakers - Foreign-born 41.5% of residents of Marietta speak English at home.
0.2% of residents speak Spanish at home 1 100.0% Speak English very well56.8% of residents speak other language at home 135 48.4% Speak English very well144 51.6% Speak English less than very well
White (Caucasian) - Speak only English Native:
98.9% (11,268)Foreign-born:
64.7% (123)
White (Caucasian) - Speak another language Native:
1.2% (137)Foreign-born:
39.3% (75)
Black or African American - Speak another language Native:
2.9% (6)Foreign-born:
97.3% (47)
White alone - Speak only English Native:
98.7% (11,171)Foreign-born:
61.3% (126)
White alone - Speak another language Native:
1.3% (143)Foreign-born:
39.4% (81)
Hispanic or Latino - Speak another language Native:
4.6% (11)Foreign-born:
100.0% (6)
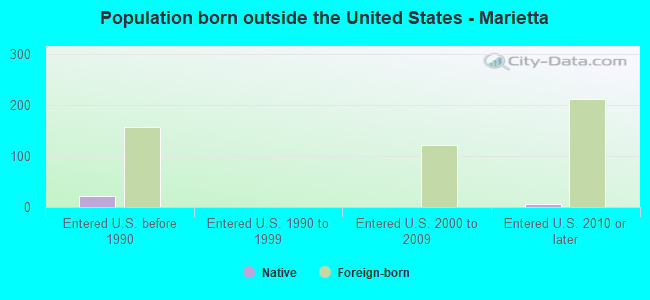
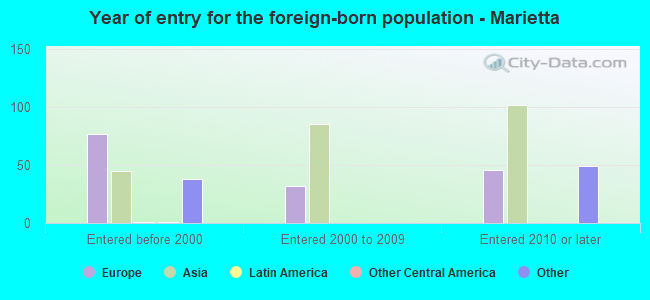
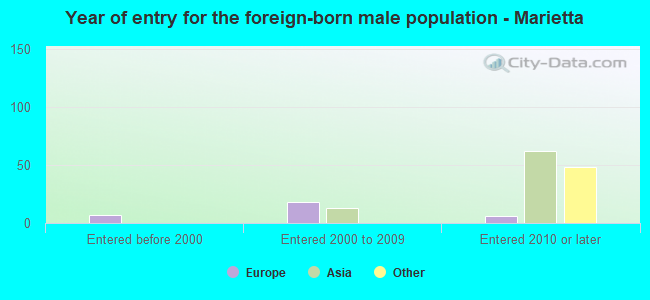
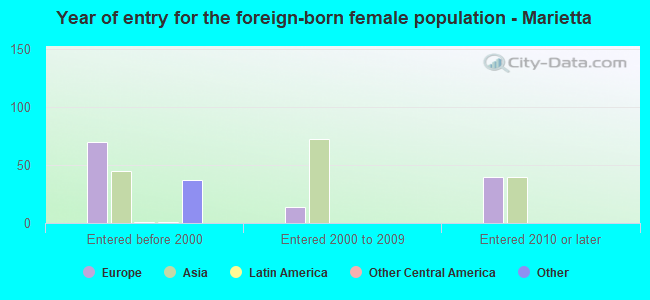
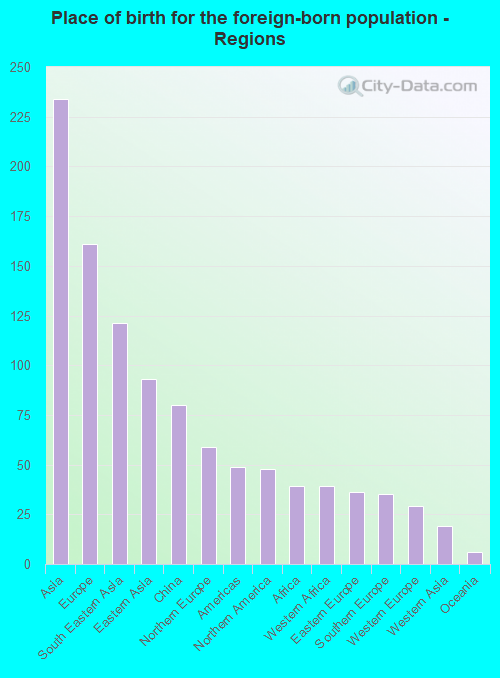
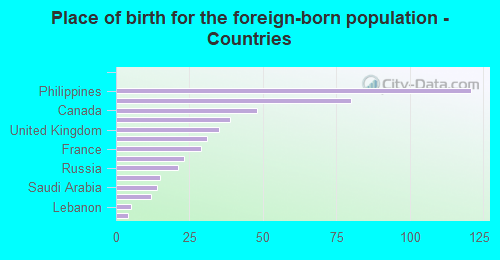
Foreign-born residents in Marietta 491 residents are foreign born (1.7% Asia , 1.2% Europe ).
Marital status for residents in Marietta Marital status - White (Caucasian) population 15 years and over
Males 37.1% Never married37.5% Now married2.2% Separated5.8% Widowed17.4% DivorcedFemales 32.1% Never married34.8% Now married2.0% Separated15.2% Widowed15.8% DivorcedWomen who gave birth in the past 12 months Now married:
32.3% (71)Unmarried:
67.7% (150)
Women who did not give birth in the past 12 months Now married:
30.1% (789)Unmarried:
69.9% (1,830)
Marital status - Black or African American population 15 years and over
Males 61.5% Never married36.2% Now married0.0% Separated0.0% Widowed2.3% DivorcedFemales 7.0% Never married76.7% Now married0.0% Separated16.3% Widowed0.0% DivorcedWomen who did not give birth in the past 12 months Now married:
91.7% (32)Unmarried:
8.3% (3)
Marital status - Asian population 15 years and over
Males 69.2% Never married30.8% Now married0.0% Separated0.0% Widowed0.0% DivorcedFemales 8.1% Never married91.9% Now married0.0% Separated0.0% Widowed0.0% DivorcedWomen who did not give birth in the past 12 months Now married:
81.1% (30)Unmarried:
18.9% (7)
Marital status - Other race population 15 years and over
Males 100.0% Never married0.0% Now married0.0% Separated0.0% Widowed0.0% DivorcedFemales 0.0% Never married80.0% Now married0.0% Separated0.0% Widowed20.0% DivorcedWomen who did not give birth in the past 12 months Now married:
100.0% (5)Unmarried:
0.0% (0)
Marital status - Two or more races population 15 years and over
Males 48.4% Never married29.0% Now married0.0% Separated0.0% Widowed22.6% DivorcedFemales 35.7% Never married26.8% Now married0.0% Separated0.0% Widowed37.5% DivorcedWomen who did not give birth in the past 12 months Now married:
16.7% (5)Unmarried:
83.3% (27)
Marital status - White alone, not Hispanic / Latino population 15 years and over
Males 36.7% Never married37.6% Now married2.2% Separated5.8% Widowed17.6% DivorcedFemales 32.3% Never married34.2% Now married2.0% Separated15.5% Widowed16.0% DivorcedWomen who gave birth in the past 12 months Now married:
32.3% (72)Unmarried:
67.7% (151)
Women who did not give birth in the past 12 months Now married:
28.7% (738)Unmarried:
71.3% (1,833)
Marital status - Hispanic or Latino population 15 years and over
Males 82.1% Never married17.9% Now married0.0% Separated0.0% Widowed0.0% DivorcedFemales 18.1% Never married80.9% Now married0.0% Separated0.0% Widowed1.1% DivorcedWomen who did not give birth in the past 12 months Now married:
79.3% (69)Unmarried:
20.7% (18)
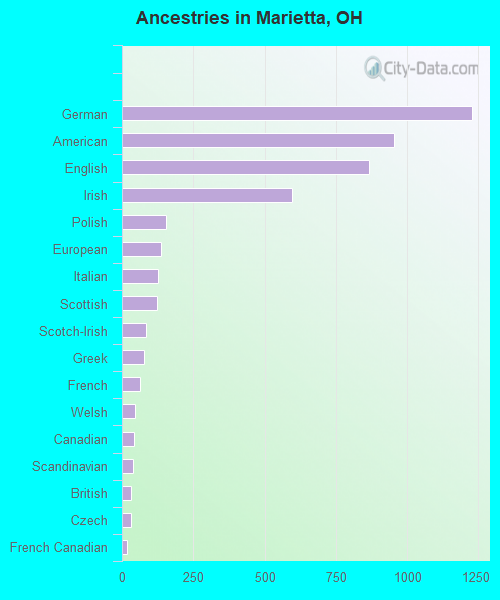
Ancestries in Marietta
1,226 22.8% German953 17.7% American865 16.1% English597 11.1% Irish153 2.8% Polish138 2.6% European126 2.3% Italian122 2.3% Scottish85 1.6% Scotch-Irish76 1.4% Greek64 1.2% French46 0.9% Welsh41 0.8% Canadian40 0.7% Scandinavian33 0.6% British33 0.6% Czech17 0.3% French Canadian10 0.2% Croatian10 0.2% Norwegian9 0.2% Palestinian8 0.1% Slovak7 0.1% Dutch6 0.1% Swedish5 0.09% Danish5 0.09% Eastern European3 0.06% African
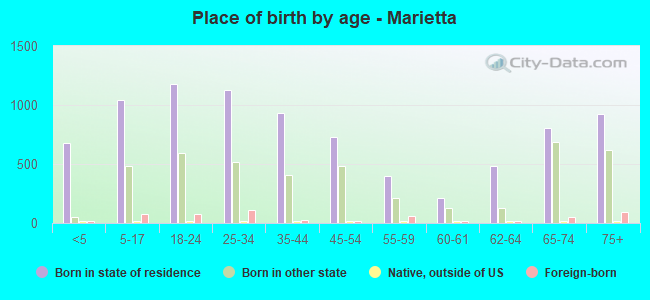
Children Nativity (place of birth) in Marietta
Children under 6 years - Living with two parents Both parents native 487 100.0% NativeChildren under 6 years - Living with one parent Native parent 384 100.0% NativeForeign-born parent 12 100.0% NativeChildren 6 to 17 years - Living with two parents Both parents native 512 87.2% Native76 12.8% Foreign-bornChildren 6 to 17 years - Living with one parent Native parent 737 100.0% Native
Grandparents responsible for own grandchildren in Marietta
Grandparents (30 to 59 years) White / Caucasian 29 100.0% Responsible for grandchildrenOther race 1 100.0% Responsible for grandchildrenWhite alone, not Hispanic / Latino 29 100.0% Responsible for grandchildrenHispanic or Latino 1 100.0% Responsible for grandchildrenGrandparents (60 years and over) White / Caucasian 13 41.4% Responsible for grandchildren19 58.6% Not responsible for grandchildrenWhite alone, not Hispanic / Latino 13 41.2% Responsible for grandchildren19 58.8% Not responsible for grandchildren