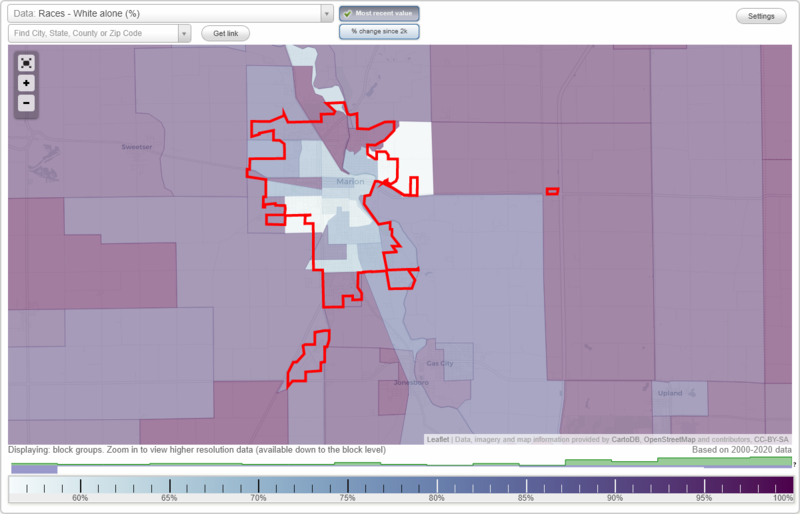
Races in Marion, Indiana (IN) Detailed Stats
Data:
Races - White alone (%)
Races - White alone (% change since 2000)
Races - Black alone (%)
Races - Black alone (% change since 2000)
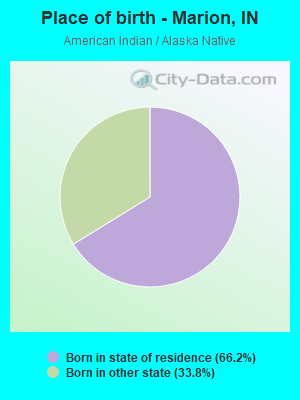
Races - American Indian alone (%)
Races - American Indian alone (% change since 2000)
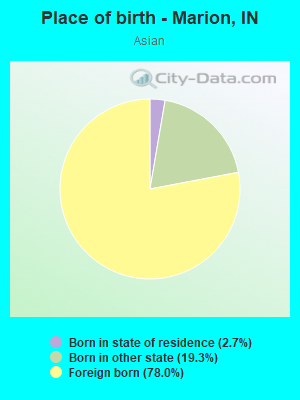
Races - Asian alone (%)
Races - Asian alone (% change since 2000)
Races - Hispanic (%)
Races - Hispanic (% change since 2000)
Races - Native Hawaiian and Other Pacific Islander alone (%)
Races - Native Hawaiian and Other Pacific Islander alone (% change since 2000)
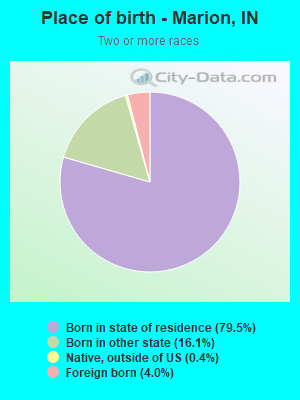
Races - Two or more races(%)
Races - Two or more races(% change since 2000)
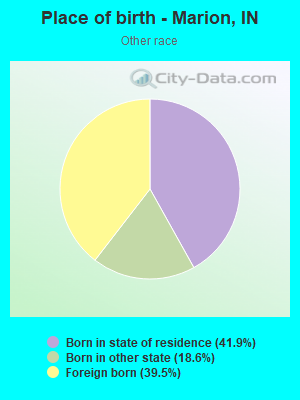
Races - Other race alone (%)
Races - Other race alone (% change since 2000)
Racial diversity
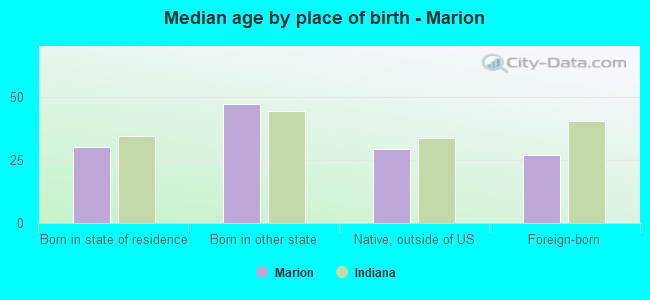
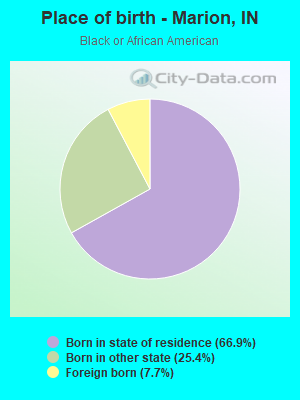
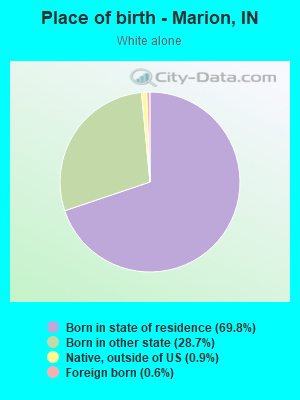
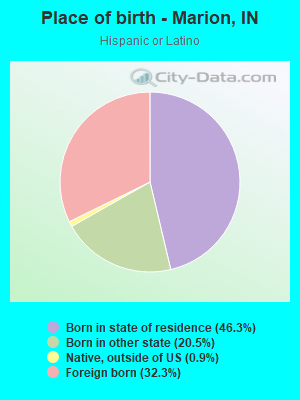
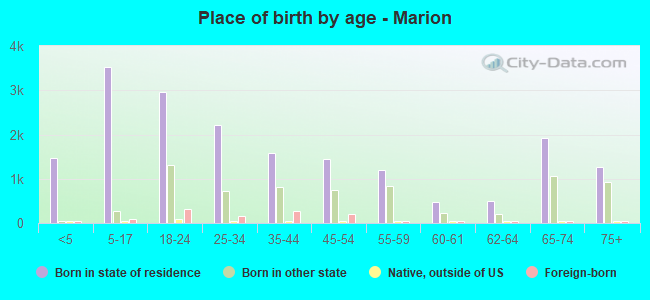
Place of birth - Born in state of residence (%)
Place of birth - Born in state of residence (%) - White
Place of birth - Born in state of residence (%) - Black or African American
Place of birth - Born in state of residence (%) - Asian
Place of birth - Born in state of residence (%) - Hispanic or Latino
Place of birth - Born in state of residence (%) - American Indian and Alaska Native
Place of birth - Born in state of residence (%) - Multirace
Place of birth - Born in state of residence (%) - Other Race
Place of birth - Born in other state (%)
Place of birth - Born in other state (%) - White
Place of birth - Born in other state (%) - Black or African American
Place of birth - Born in other state (%) - Asian
Place of birth - Born in other state (%) - Hispanic or Latino
Place of birth - Born in other state (%) - American Indian and Alaska Native
Place of birth - Born in other state (%) - Multirace
Place of birth - Born in other state (%) - Other Race
Place of birth - Native, outside of US (%)
Place of birth - Native, outside of US (%) - White
Place of birth - Native, outside of US (%) - Black or African American
Place of birth - Native, outside of US (%) - Asian
Place of birth - Native, outside of US (%) - Hispanic or Latino
Place of birth - Native, outside of US (%) - American Indian and Alaska Native
Place of birth - Native, outside of US (%) - Multirace
Place of birth - Native, outside of US (%) - Other Race
Place of birth - Foreign born (%)
Place of birth - Foreign born (%) - White
Place of birth - Foreign born (%) - Black or African American
Place of birth - Foreign born (%) - Asian
Place of birth - Foreign born (%) - Hispanic or Latino
Place of birth - Foreign born (%) - American Indian and Alaska Native
Place of birth - Foreign born (%) - Multirace
Place of birth - Foreign born (%) - Other Race
Residents speaking English at home (%)
Residents speaking English at home - Born in the United States (%)
Residents speaking English at home - Native, born elsewhere (%)
Residents speaking English at home - Foreign born (%)
Residents speaking Spanish at home (%)
Residents speaking Spanish at home - Born in the United States (%)
Residents speaking Spanish at home - Native, born elsewhere (%)
Residents speaking Spanish at home - Foreign born (%)
Residents speaking other language at home (%)
Residents speaking other language at home - Born in the United States (%)
Residents speaking other language at home - Native, born elsewhere (%)
Residents speaking other language at home - Foreign born (%)
Marital status - Never married (%)
Marital status - Now married (%)
Marital status - Separated (%)
Marital status - Widowed (%)
Marital status - Divorced (%)
Ancestries Reported - Arab (%)
Ancestries Reported - Czech (%)
Ancestries Reported - Danish (%)
Ancestries Reported - Dutch (%)
Ancestries Reported - English (%)
Ancestries Reported - French (%)
Ancestries Reported - French Canadian (%)
Ancestries Reported - German (%)
Ancestries Reported - Greek (%)
Ancestries Reported - Hungarian (%)
Ancestries Reported - Irish (%)
Ancestries Reported - Italian (%)
Ancestries Reported - Lithuanian (%)
Ancestries Reported - Norwegian (%)
Ancestries Reported - Polish (%)
Ancestries Reported - Portuguese (%)
Ancestries Reported - Russian (%)
Ancestries Reported - Scotch-Irish (%)
Ancestries Reported - Scottish (%)
Ancestries Reported - Slovak (%)
Ancestries Reported - Subsaharan African (%)
Ancestries Reported - Swedish (%)
Ancestries Reported - Swiss (%)
Ancestries Reported - Ukrainian (%)
Ancestries Reported - United States (%)
Ancestries Reported - Welsh (%)
Ancestries Reported - West Indian (%)
Ancestries Reported - Other (%)
Geographical mobility - Same house 1 year ago (%)
Geographical mobility - Same house 1 year ago (%) - White
Geographical mobility - Same house 1 year ago (%) - Black or African American
Geographical mobility - Same house 1 year ago (%) - Asian
Geographical mobility - Same house 1 year ago (%) - Hispanic or Latino
Geographical mobility - Same house 1 year ago (%) - American Indian and Alaska Native
Geographical mobility - Same house 1 year ago (%) - Multirace
Geographical mobility - Same house 1 year ago (%) - Other Race
Geographical mobility - Moved within same county (%)
Geographical mobility - Moved within same county (%) - White
Geographical mobility - Moved within same county (%) - Black or African American
Geographical mobility - Moved within same county (%) - Asian
Geographical mobility - Moved within same county (%) - Hispanic or Latino
Geographical mobility - Moved within same county (%) - American Indian and Alaska Native
Geographical mobility - Moved within same county (%) - Multirace
Geographical mobility - Moved within same county (%) - Other Race
Geographical mobility - Moved from different county within same state (%)
Geographical mobility - Moved from different county within same state (%) - White
Geographical mobility - Moved from different county within same state (%) - Black or African American
Geographical mobility - Moved from different county within same state (%) - Asian
Geographical mobility - Moved from different county within same state (%) - Hispanic or Latino
Geographical mobility - Moved from different county within same state (%) - American Indian and Alaska Native
Geographical mobility - Moved from different county within same state (%) - Multirace
Geographical mobility - Moved from different county within same state (%) - Other Race
Geographical mobility - Moved from different state (%)
Geographical mobility - Moved from different state (%) - White
Geographical mobility - Moved from different state (%) - Black or African American
Geographical mobility - Moved from different state (%) - Asian
Geographical mobility - Moved from different state (%) - Hispanic or Latino
Geographical mobility - Moved from different state (%) - American Indian and Alaska Native
Geographical mobility - Moved from different state (%) - Multirace
Geographical mobility - Moved from different state (%) - Other Race
Geographical mobility - Moved from abroad (%)
Geographical mobility - Moved from abroad (%) - White
Geographical mobility - Moved from abroad (%) - Black or African American
Geographical mobility - Moved from abroad (%) - Asian
Geographical mobility - Moved from abroad (%) - Hispanic or Latino
Geographical mobility - Moved from abroad (%) - American Indian and Alaska Native
Geographical mobility - Moved from abroad (%) - Multirace
Geographical mobility - Moved from abroad (%) - Other Race
Place of birth for the foreign-born population - Ireland (%)
Place of birth for the foreign-born population - Denmark (%)
Place of birth for the foreign-born population - Norway (%)
Place of birth for the foreign-born population - Sweden (%)
Place of birth for the foreign-born population - United Kingdom (%)
Place of birth for the foreign-born population - England (%)
Place of birth for the foreign-born population - Scotland (%)
Place of birth for the foreign-born population - Other Northern Europe (%)
Place of birth for the foreign-born population - Austria (%)
Place of birth for the foreign-born population - Belgium (%)
Place of birth for the foreign-born population - France (%)
Place of birth for the foreign-born population - Germany (%)
Place of birth for the foreign-born population - Netherlands (%)
Place of birth for the foreign-born population - Switzerland (%)
Place of birth for the foreign-born population - Other Western Europe (%)
Place of birth for the foreign-born population - Greece (%)
Place of birth for the foreign-born population - Italy (%)
Place of birth for the foreign-born population - Portugal (%)
Place of birth for the foreign-born population - Spain (%)
Place of birth for the foreign-born population - Other Southern Europe (%)
Place of birth for the foreign-born population - Albania (%)
Place of birth for the foreign-born population - Belarus (%)
Place of birth for the foreign-born population - Bosnia and Herzegovina (%)
Place of birth for the foreign-born population - Bulgaria (%)
Place of birth for the foreign-born population - Croatia (%)
Place of birth for the foreign-born population - Czechoslovakia (%)
Place of birth for the foreign-born population - Hungary (%)
Place of birth for the foreign-born population - Latvia (%)
Place of birth for the foreign-born population - Lithuania (%)
Place of birth for the foreign-born population - North Macedonia (Macedonia) (%)
Place of birth for the foreign-born population - Moldova (%)
Place of birth for the foreign-born population - Poland (%)
Place of birth for the foreign-born population - Romania (%)
Place of birth for the foreign-born population - Russia (%)
Place of birth for the foreign-born population - Serbia (%)
Place of birth for the foreign-born population - Ukraine (%)
Place of birth for the foreign-born population - Other Eastern Europe (%)
Place of birth for the foreign-born population - China (%)
Place of birth for the foreign-born population - Hong Kong (%)
Place of birth for the foreign-born population - Taiwan (%)
Place of birth for the foreign-born population - Japan (%)
Place of birth for the foreign-born population - Korea (%)
Place of birth for the foreign-born population - Other Eastern Asia (%)
Place of birth for the foreign-born population - Afghanistan (%)
Place of birth for the foreign-born population - Bangladesh (%)
Place of birth for the foreign-born population - India (%)
Place of birth for the foreign-born population - Iran (%)
Place of birth for the foreign-born population - Kazakhstan (%)
Place of birth for the foreign-born population - Nepal (%)
Place of birth for the foreign-born population - Pakistan (%)
Place of birth for the foreign-born population - Sri Lanka (%)
Place of birth for the foreign-born population - Uzbekistan (%)
Place of birth for the foreign-born population - Other South Central Asia (%)
Place of birth for the foreign-born population - Burma (%)
Place of birth for the foreign-born population - Cambodia (%)
Place of birth for the foreign-born population - Indonesia (%)
Place of birth for the foreign-born population - Laos (%)
Place of birth for the foreign-born population - Malaysia (%)
Place of birth for the foreign-born population - Philippines (%)
Place of birth for the foreign-born population - Singapore (%)
Place of birth for the foreign-born population - Thailand (%)
Place of birth for the foreign-born population - Vietnam (%)
Place of birth for the foreign-born population - Other South Eastern Asia (%)
Place of birth for the foreign-born population - Armenia (%)
Place of birth for the foreign-born population - Iraq (%)
Place of birth for the foreign-born population - Israel (%)
Place of birth for the foreign-born population - Jordan (%)
Place of birth for the foreign-born population - Kuwait (%)
Place of birth for the foreign-born population - Lebanon (%)
Place of birth for the foreign-born population - Saudi Arabia (%)
Place of birth for the foreign-born population - Syria (%)
Place of birth for the foreign-born population - Turkey (%)
Place of birth for the foreign-born population - Yemen (%)
Place of birth for the foreign-born population - Other Western Asia (%)
Place of birth for the foreign-born population - Eritrea (%)
Place of birth for the foreign-born population - Ethiopia (%)
Place of birth for the foreign-born population - Kenya (%)
Place of birth for the foreign-born population - Somalia (%)
Place of birth for the foreign-born population - Uganda (%)
Place of birth for the foreign-born population - Zimbabwe (%)
Place of birth for the foreign-born population - Other Eastern Africa (%)
Place of birth for the foreign-born population - Cameroon (%)
Place of birth for the foreign-born population - Congo (%)
Place of birth for the foreign-born population - Democratic Republic of Congo (Zaire) (%)
Place of birth for the foreign-born population - Other Middle Africa (%)
Place of birth for the foreign-born population - Egypt (%)
Place of birth for the foreign-born population - Morocco (%)
Place of birth for the foreign-born population - Sudan (%)
Place of birth for the foreign-born population - Other Northern Africa (%)
Place of birth for the foreign-born population - South Africa (%)
Place of birth for the foreign-born population - Other Southern Africa (%)
Place of birth for the foreign-born population - Cabo Verde (%)
Place of birth for the foreign-born population - Ghana (%)
Place of birth for the foreign-born population - Liberia (%)
Place of birth for the foreign-born population - Nigeria (%)
Place of birth for the foreign-born population - Senegal (%)
Place of birth for the foreign-born population - Sierra Leone (%)
Place of birth for the foreign-born population - Other Western Africa (%)
Place of birth for the foreign-born population - Australia (%)
Place of birth for the foreign-born population - New Zealand (%)
Place of birth for the foreign-born population - Fiji (%)
Place of birth for the foreign-born population - Micronesia (%)
Place of birth for the foreign-born population - Bahamas (%)
Place of birth for the foreign-born population - Barbados (%)
Place of birth for the foreign-born population - Cuba (%)
Place of birth for the foreign-born population - Dominica (%)
Place of birth for the foreign-born population - Dominican Republic (%)
Place of birth for the foreign-born population - Grenada (%)
Place of birth for the foreign-born population - Haiti (%)
Place of birth for the foreign-born population - Jamaica (%)
Place of birth for the foreign-born population - St. Vincent and the Grenadines (%)
Place of birth for the foreign-born population - Trinidad and Tobago (%)
Place of birth for the foreign-born population - West Indies (%)
Place of birth for the foreign-born population - Other Caribbean (%)
Place of birth for the foreign-born population - Belize (%)
Place of birth for the foreign-born population - Costa Rica (%)
Place of birth for the foreign-born population - El Salvador (%)
Place of birth for the foreign-born population - Guatemala (%)
Place of birth for the foreign-born population - Honduras (%)
Place of birth for the foreign-born population - Mexico (%)
Place of birth for the foreign-born population - Nicaragua (%)
Place of birth for the foreign-born population - Panama (%)
Place of birth for the foreign-born population - Other Central America (%)
Place of birth for the foreign-born population - Argentina (%)
Place of birth for the foreign-born population - Bolivia (%)
Place of birth for the foreign-born population - Brazil (%)
Place of birth for the foreign-born population - Chile (%)
Place of birth for the foreign-born population - Colombia (%)
Place of birth for the foreign-born population - Ecuador (%)
Place of birth for the foreign-born population - Guyana (%)
Place of birth for the foreign-born population - Peru (%)
Place of birth for the foreign-born population - Uruguay (%)
Place of birth for the foreign-born population - Venezuela (%)
Place of birth for the foreign-born population - Other South America (%)
Place of birth for the foreign-born population - Canada (%)
Place of birth for the foreign-born population - Other Northern America (%)
Place of birth for the foreign-born population - Other (%)
Latest news about races in Marion, IN collected exclusively by city-data.com from local newspapers, TV, and radio stations
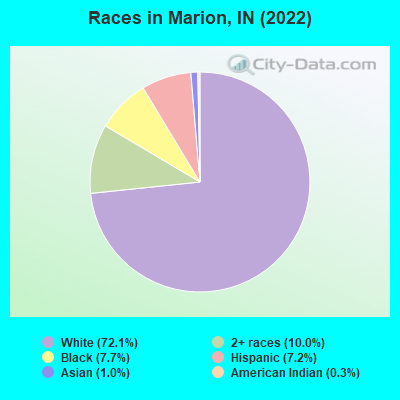
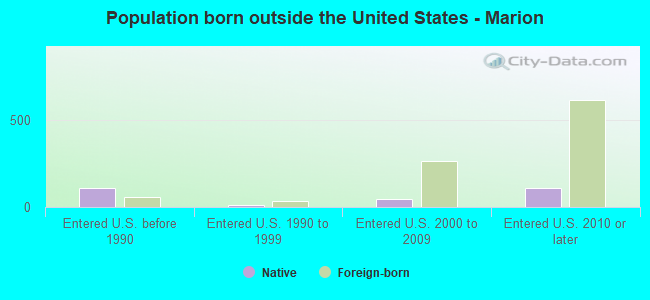
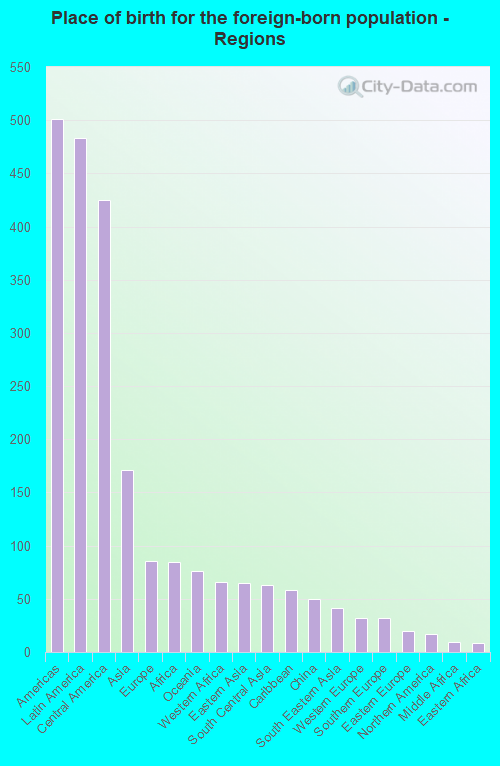
According to 2022 data, the most numerous races in Marion, IN are White alone (19,693 residents), Black alone (2,116 residents), and Hispanic (1,967 residents). 94.1% of Marion residents speak English at home. 3.4% of Marion, IN residents are foreign-born (1.6% born in Latin America, 0.6% born in Asia), which is 77.9% less than the foreign-born rate of 6.0% across the entire state of Indiana.
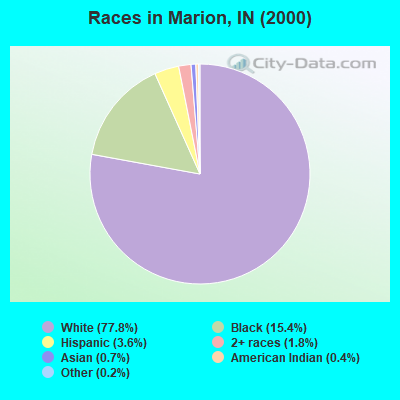
Race distribution in Marion
2000 2022
5,219,373 85.8% White alone 505,462 8.3% Black alone 214,536 3.5% Hispanic 61,115 1.0% Two or more races 58,424 1.0% Asian alone 13,654 0.2% American Indian alone 6,348 0.1% Other race alone 1,573 0.03% Native Hawaiian and Other
5,192,455 76.0% White alone 628,054 9.2% Black alone 534,528 7.8% Hispanic 263,242 3.9% Two or more races 172,880 2.5% Asian alone 33,467 0.5% Other race alone 5,866 0.09% American Indian alone 2,545 0.04% Native Hawaiian and Other
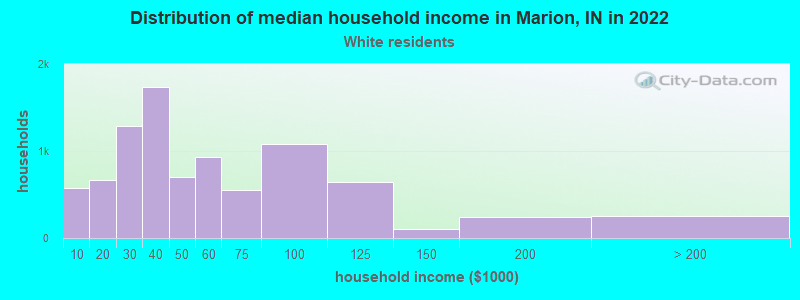
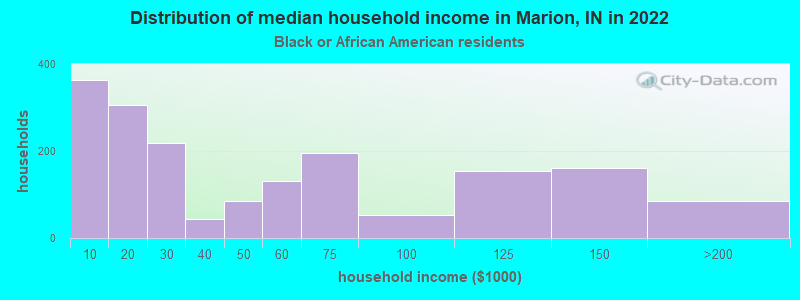
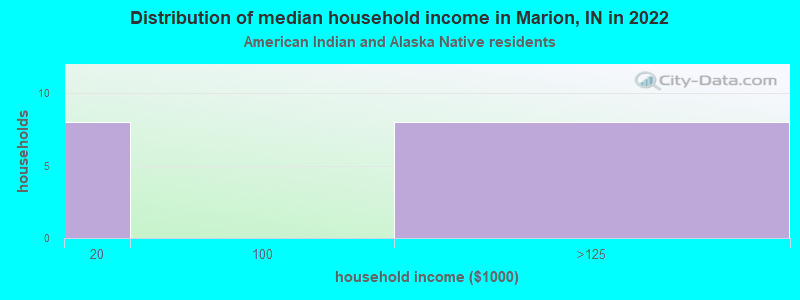
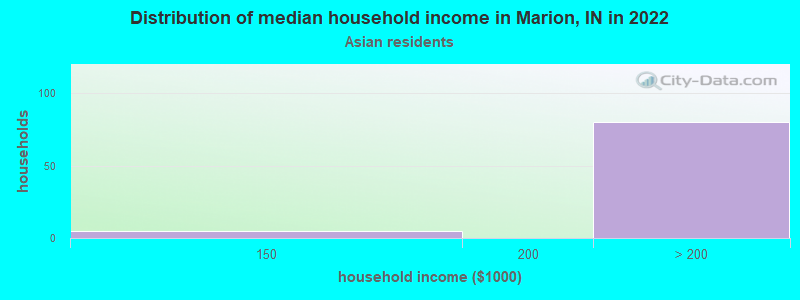
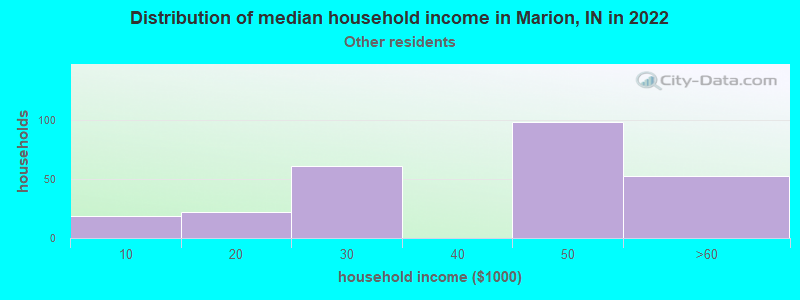
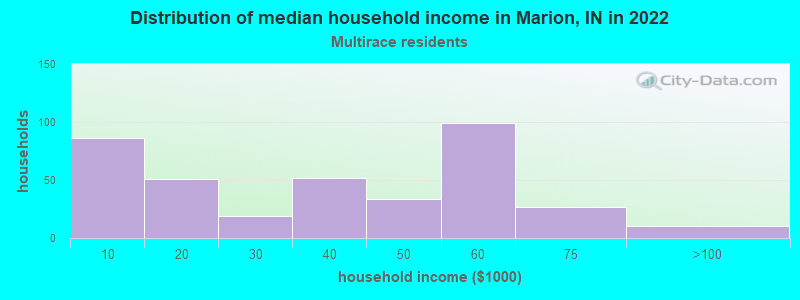
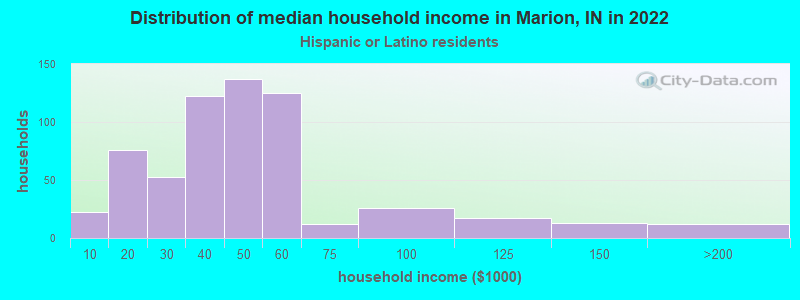
Income and house value in Marion Median household income in 2022 $40,808 White non-Hispanic householders$29,273 Black householders$44,047 Some other race householders$18,179 Two or more races householders$42,029 Hispanic or Latino race householdersMedian 2022 house value $84,677 White Non-Hispanic householders$78,607 Black or African American householders$91,042 American Indian or Alaska Native householders $179,420 Asian householders$111,027 Native Hawaiian and other Pacific Islander householders$94,595 Some other race householders$72,834 Two or more races householders$84,677 Hispanic or Latino householders
Median age by race in Marion
39.6 Median age for White residents39.1 37.7 29.0 Median age for Black or African American residents26.2 28.3 22.7 Median age for American Indian / Alaska Native residents10.8 30.1 26.0 Median age for Asian residents26.4 24.1 -666,666,666.0 Median age for Native Hawaiian / Pacific Islander residents-666,666,666.0 -666,666,666.0 30.4 Median age for Other race residents29.3 57.1 29.0 Median age for Two or more races residents36.3 16.9 41.2 Median age for White alone residents40.3 39.9 30.6 Median age for Hispanic or Latino residents22.2 29.4
Owner/renter occupied households by race in Marion
House owners and renters - White residents 5,927 70.5% Owner occupied2,482 29.5% Renter occupiedHouse owners and renters - Black or African American residents 686 38.5% Owner occupied1,096 61.5% Renter occupiedHouse owners and renters - American Indian / Alaska Native residents 13 40.0% Owner occupied19 60.0% Renter occupiedHouse owners and renters - Asian residents 81 100.0% Owner occupiedHouse owners and renters - Other race residents 53 22.8% Owner occupied179 77.2% Renter occupiedHouse owners and renters - Two or more races residents 86 23.2% Owner occupied283 76.8% Renter occupiedHouse owners and renters - White alone residents 5,819 71.2% Owner occupied2,352 28.8% Renter occupiedHouse owners and renters - Hispanic or Latino residents 169 30.3% Owner occupied390 69.7% Renter occupied
Language usage in Marion
English speakers - Total 94.1% of residents of Marion speak English at home.
4.0% of residents speak Spanish at home 610 59.0% Speak English very well424 41.0% Speak English less than very well1.5% of residents speak other language at home 313 79.2% Speak English very well82 20.8% Speak English less than very well
English speakers - Born in the United States 93.3% of residents of Marion speak English at home.
5.1% of residents speak Spanish at home 290 76.9% Speak English very well87 23.1% Speak English less than very well1.6% of residents speak other language at home 119 100.0% Speak English very well
English speakers - Native, born elsewhere 92.0% of residents of Marion speak English at home.
8.0% of residents speak Spanish at home 22 100.0% Speak English less than very well
English speakers - Foreign-born 35.3% of residents of Marion speak English at home.
43.3% of residents speak Spanish at home 138 34.5% Speak English very well262 65.5% Speak English less than very well19.6% of residents speak other language at home 153 84.5% Speak English very well28 15.5% Speak English less than very well
White (Caucasian) - Speak only English Native:
97.8% (19,183)Foreign-born:
32.9% (47)
White (Caucasian) - Speak another language Native:
2.2% (441)Foreign-born:
66.7% (96)
Black or African American - Speak only English Native:
98.8% (3,236)Foreign-born:
58.8% (129)
Black or African American - Speak another language Native:
0.9% (31)Foreign-born:
15.7% (34)
Asian - Speak only English Native:
50.2% (29)Foreign-born:
45.0% (95)
Asian - Speak another language Native:
49.4% (28)Foreign-born:
55.5% (117)
Other race - Speak only English Native:
61.6% (201)Foreign-born:
16.5% (39)
Other race - Speak another language Native:
39.7% (130)Foreign-born:
84.5% (201)
Two or more races - Speak only English Native:
89.5% (1,638)Foreign-born:
13.3% (19)
Two or more races - Speak another language Native:
9.0% (165)Foreign-born:
86.7% (126)
White alone - Speak only English Native:
98.2% (18,707)Foreign-born:
47.4% (53)
White alone - Speak another language Native:
1.8% (343)Foreign-born:
51.6% (58)
Hispanic or Latino - Speak only English Native:
68.2% (910)Foreign-born:
8.8% (35)
Hispanic or Latino - Speak another language Native:
31.0% (414)Foreign-born:
91.1% (367)
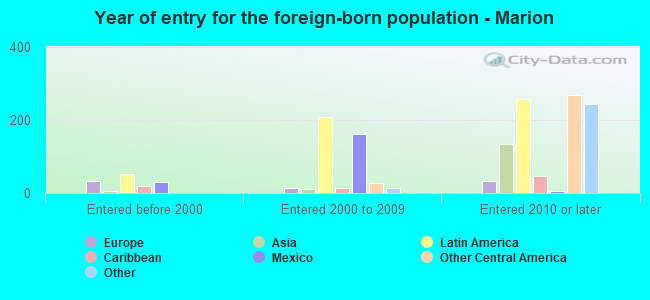
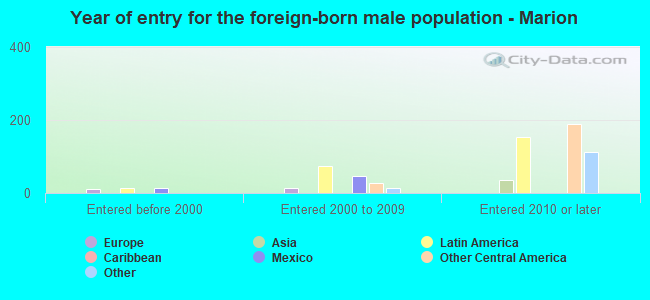
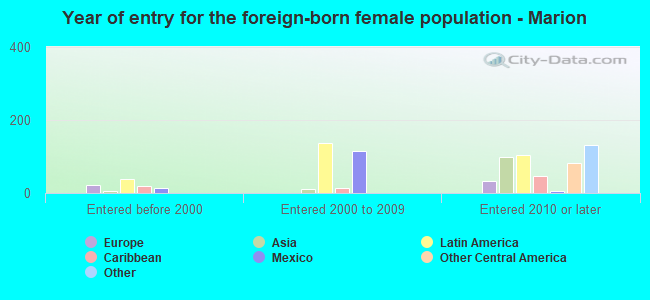
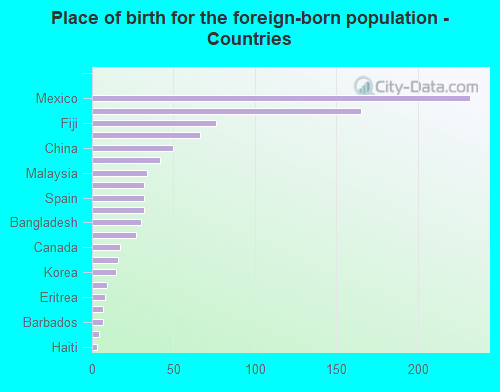
Foreign-born residents in Marion 921 residents are foreign born (1.6% Latin America , 0.6% Asia ).
This city:
3.4%Indiana:
5.6%
Marital status for residents in Marion Marital status - White (Caucasian) population 15 years and over
Males 39.0% Never married34.8% Now married0.5% Separated3.3% Widowed22.4% DivorcedFemales 39.0% Never married30.6% Now married0.9% Separated12.4% Widowed17.0% DivorcedWomen who gave birth in the past 12 months Now married:
43.1% (52)Unmarried:
56.9% (69)
Women who did not give birth in the past 12 months Now married:
24.8% (1,306)Unmarried:
75.2% (3,966)
Marital status - Black or African American population 15 years and over
Males 48.8% Never married31.3% Now married3.6% Separated2.0% Widowed14.3% DivorcedFemales 49.2% Never married18.8% Now married2.4% Separated7.6% Widowed22.0% DivorcedWomen who gave birth in the past 12 months Now married:
0.0% (0)Unmarried:
100.0% (209)
Women who did not give birth in the past 12 months Now married:
18.3% (135)Unmarried:
81.7% (601)
Marital status - American Indian / Alaska Native population 15 years and over
Males 0.0% Never married0.0% Now married77.8% Separated22.2% Widowed0.0% DivorcedFemales 76.0% Never married0.0% Now married0.0% Separated0.0% Widowed24.0% DivorcedWomen who did not give birth in the past 12 months Now married:
0.0% (0)Unmarried:
100.0% (59)
Marital status - Asian population 15 years and over
Males 100.0% Never married0.0% Now married0.0% Separated0.0% Widowed0.0% DivorcedFemales 66.1% Never married2.7% Now married0.0% Separated0.0% Widowed31.2% DivorcedWomen who did not give birth in the past 12 months Now married:
3.1% (6)Unmarried:
96.9% (198)
Marital status - Other race population 15 years and over
Males 29.7% Never married41.6% Now married0.0% Separated10.5% Widowed18.2% DivorcedFemales 56.4% Never married13.3% Now married0.0% Separated14.2% Widowed16.1% DivorcedWomen who gave birth in the past 12 months Now married:
0.0% (0)Unmarried:
100.0% (45)
Women who did not give birth in the past 12 months Now married:
45.2% (34)Unmarried:
54.8% (41)
Marital status - Two or more races population 15 years and over
Males 55.9% Never married16.2% Now married0.0% Separated17.8% Widowed10.0% DivorcedFemales 53.1% Never married15.7% Now married2.0% Separated0.0% Widowed29.1% DivorcedWomen who gave birth in the past 12 months Now married:
0.0% (0)Unmarried:
100.0% (30)
Women who did not give birth in the past 12 months Now married:
16.9% (92)Unmarried:
83.1% (451)
Marital status - White alone, not Hispanic / Latino population 15 years and over
Males 38.9% Never married34.3% Now married0.5% Separated3.5% Widowed22.8% DivorcedFemales 39.2% Never married30.7% Now married1.0% Separated11.9% Widowed17.3% DivorcedWomen who gave birth in the past 12 months Now married:
43.1% (52)Unmarried:
56.9% (69)
Women who did not give birth in the past 12 months Now married:
25.0% (1,266)Unmarried:
75.0% (3,803)
Marital status - Hispanic or Latino population 15 years and over
Males 31.7% Never married43.0% Now married0.0% Separated9.6% Widowed15.8% DivorcedFemales 43.9% Never married18.0% Now married0.0% Separated18.7% Widowed19.4% DivorcedWomen who gave birth in the past 12 months Now married:
0.0% (0)Unmarried:
100.0% (40)
Women who did not give birth in the past 12 months Now married:
16.9% (75)Unmarried:
83.1% (369)
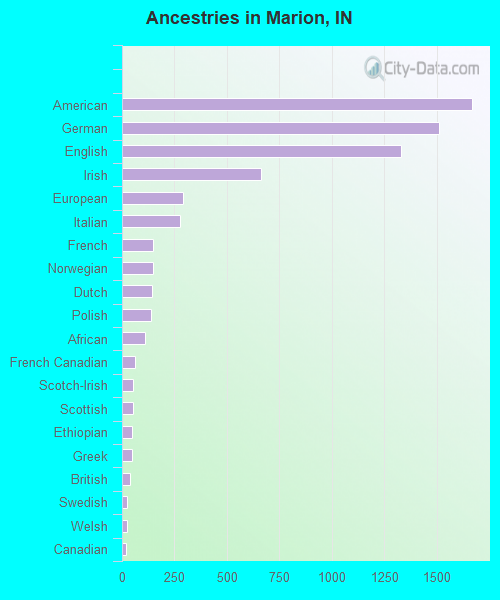
Ancestries in Marion
1,665 13.1% American1,512 11.9% German1,328 10.5% English662 5.2% Irish291 2.3% European278 2.2% Italian148 1.2% French147 1.2% Norwegian144 1.1% Dutch140 1.1% Polish109 0.9% African61 0.5% French Canadian54 0.4% Scotch-Irish52 0.4% Scottish49 0.4% Ethiopian47 0.4% Greek37 0.3% British25 0.2% Swedish25 0.2% Welsh17 0.1% Canadian15 0.1% Jamaican14 0.1% Pennsylvania German14 0.1% Russian13 0.1% Iranian13 0.1% Scandinavian9 0.07% Slovak9 0.07% Swiss9 0.07% Ukrainian7 0.06% Hungarian7 0.06% Turkish6 0.05% Lithuanian6 0.05% Barbadian5 0.04% Haitian2 0.02% Finnish1 0.01% Bulgarian
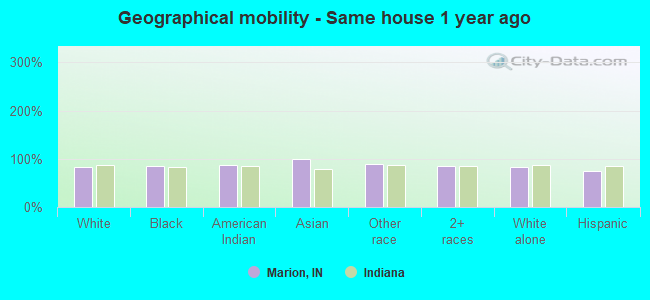
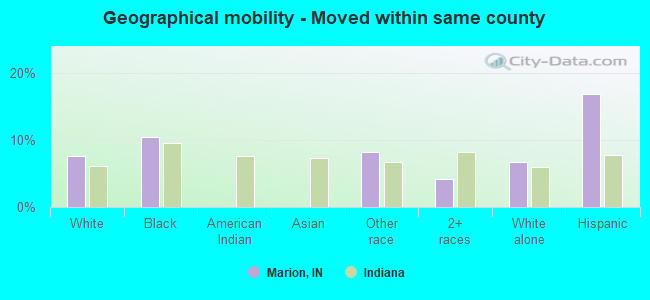
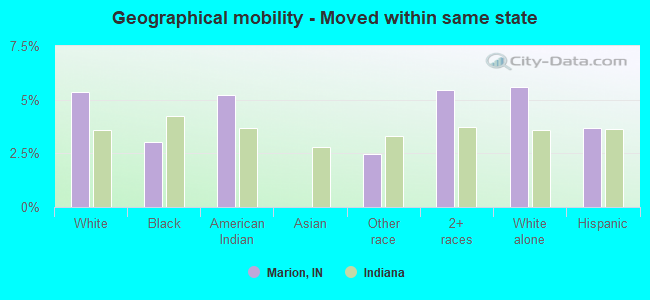
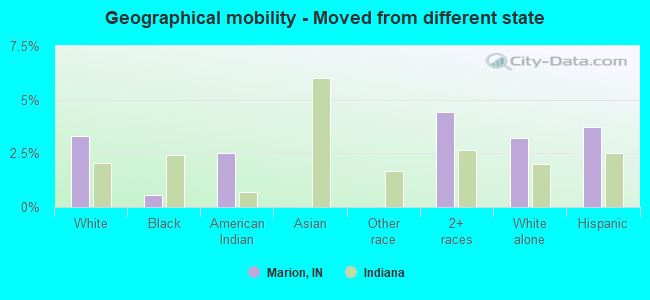
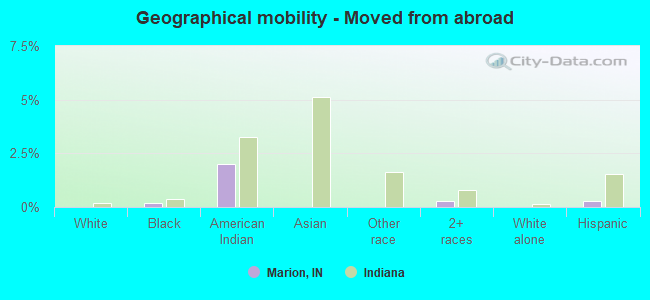
Geographical mobility in Marion Same house 1 year ago 16,854 82.9% White (Caucasian)3,181 86.2% Black or African American128 87.0% American Indian / Alaska Native269 99.5% Asian533 90.1% Other race2,012 85.6% Two or more races16,421 83.8% White alone, not Hispanic / Latino1,452 74.8% Hispanic or LatinoMoved within same county 1,556 7.7% White / Caucasian382 10.4% Black or African American49 8.2% Other race97 4.1% Two or more races1,303 6.6% White alone, not Hispanic / Latino328 16.9% Hispanic or LatinoMoved within same state 1,085 5.3% White / Caucasian112 3.0% Black or African American8 5.2% American Indian / Alaska Native15 2.5% Other race128 5.4% Two or more races1,091 5.6% White alone, not Hispanic / Latino71 3.7% Hispanic or LatinoMoved from different state 673 3.3% White / Caucasian20 0.6% Black or African American4 2.5% American Indian / Alaska Native104 4.4% Two or more races626 3.2% White alone, not Hispanic / Latino72 3.7% Hispanic or LatinoMoved from abroad 4 0.0% White7 0.2% Black or African American3 2.0% American Indian / Alaska Native7 0.3% Two or more races4 0.0% White alone, not Hispanic / Latino5 0.3% Hispanic or Latino
Children Nativity (place of birth) in Marion
Children under 6 years - Living with two parents Both parents native 595 100.0% NativeBoth parents foreign-born 31 100.0% NativeOne native, one foreign-born parent 43 100.0% NativeChildren under 6 years - Living with one parent Native parent 987 100.0% NativeChildren 6 to 17 years - Living with two parents Both parents native 1,260 100.0% NativeBoth parents foreign-born 74 100.0% Foreign-bornOne native, one foreign-born parent 30 100.0% NativeChildren 6 to 17 years - Living with one parent Native parent 1,491 100.0% NativeForeign-born parent 72 55.5% Native57 44.5% Foreign-born
Grandparents responsible for own grandchildren in Marion
Grandparents (30 to 59 years) White / Caucasian 185 90.5% Responsible for grandchildren19 9.5% Not responsible for grandchildrenBlack or African American 97 78.6% Responsible for grandchildren27 21.4% Not responsible for grandchildrenTwo or more races 6 100.0% Responsible for grandchildrenWhite alone, not Hispanic / Latino 191 90.3% Responsible for grandchildren21 9.7% Not responsible for grandchildrenGrandparents (60 years and over) White / Caucasian 194 57.7% Responsible for grandchildren142 42.3% Not responsible for grandchildrenBlack or African American 20 13.6% Responsible for grandchildren126 86.4% Not responsible for grandchildrenWhite alone, not Hispanic / Latino 176 54.9% Responsible for grandchildren144 45.1% Not responsible for grandchildren