Races in Marshall, Texas (TX) Detailed Stats
Data:
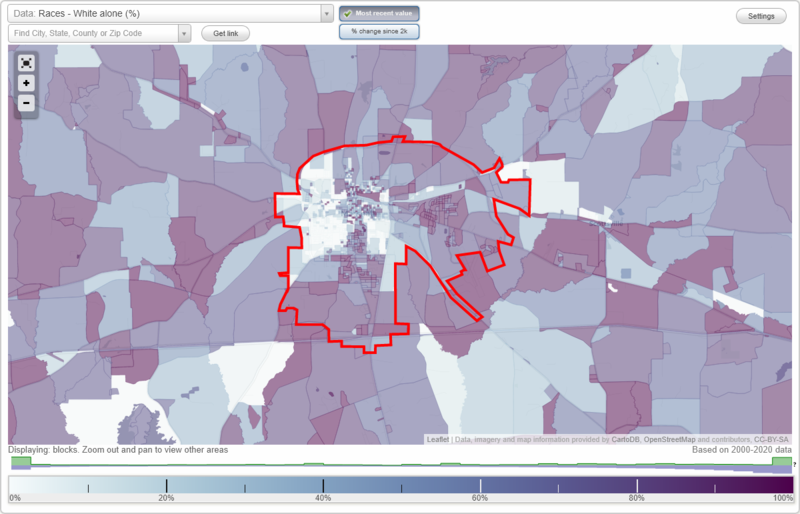
Races - White alone (%)
Races - White alone (% change since 2000)
Races - Black alone (%)
Races - Black alone (% change since 2000)
Races - American Indian alone (%)
Races - American Indian alone (% change since 2000)
Races - Asian alone (%)
Races - Asian alone (% change since 2000)
Races - Hispanic (%)
Races - Hispanic (% change since 2000)
Races - Native Hawaiian and Other Pacific Islander alone (%)
Races - Native Hawaiian and Other Pacific Islander alone (% change since 2000)
Races - Two or more races(%)
Races - Two or more races(% change since 2000)
Races - Other race alone (%)
Races - Other race alone (% change since 2000)
Racial diversity
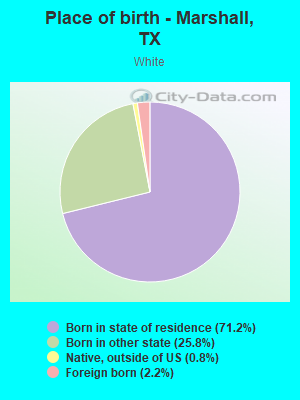
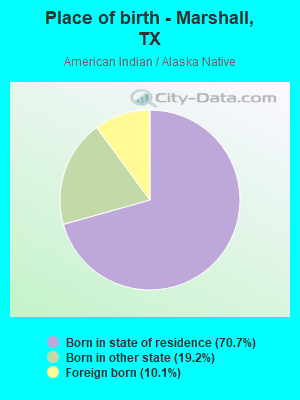
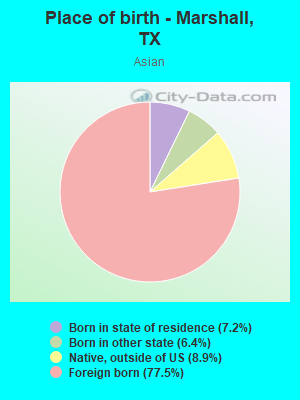
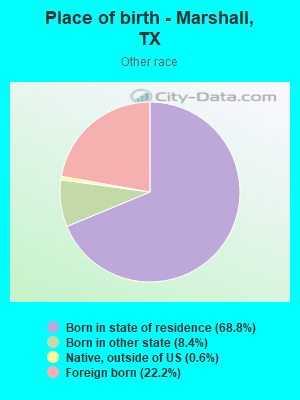
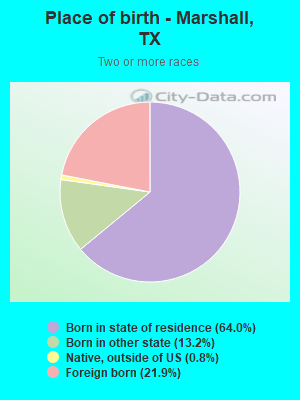
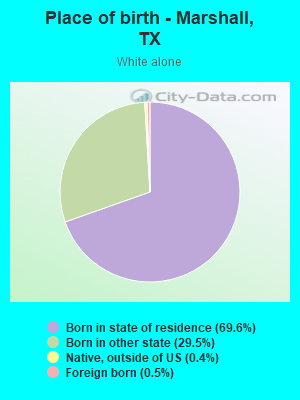
Place of birth - Born in state of residence (%)
Place of birth - Born in state of residence (%) - White
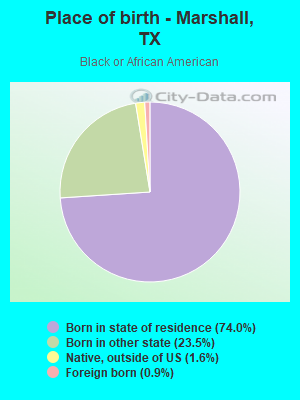
Place of birth - Born in state of residence (%) - Black or African American
Place of birth - Born in state of residence (%) - Asian
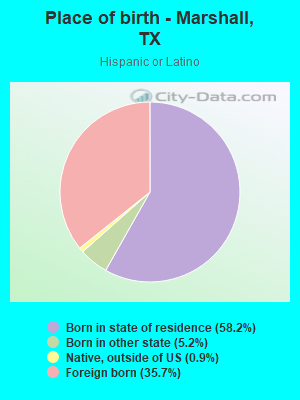
Place of birth - Born in state of residence (%) - Hispanic or Latino
Place of birth - Born in state of residence (%) - American Indian and Alaska Native
Place of birth - Born in state of residence (%) - Multirace
Place of birth - Born in state of residence (%) - Other Race
Place of birth - Born in other state (%)
Place of birth - Born in other state (%) - White
Place of birth - Born in other state (%) - Black or African American
Place of birth - Born in other state (%) - Asian
Place of birth - Born in other state (%) - Hispanic or Latino
Place of birth - Born in other state (%) - American Indian and Alaska Native
Place of birth - Born in other state (%) - Multirace
Place of birth - Born in other state (%) - Other Race
Place of birth - Native, outside of US (%)
Place of birth - Native, outside of US (%) - White
Place of birth - Native, outside of US (%) - Black or African American
Place of birth - Native, outside of US (%) - Asian
Place of birth - Native, outside of US (%) - Hispanic or Latino
Place of birth - Native, outside of US (%) - American Indian and Alaska Native
Place of birth - Native, outside of US (%) - Multirace
Place of birth - Native, outside of US (%) - Other Race
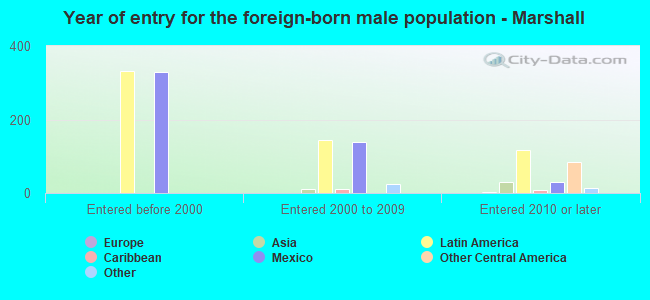
Place of birth - Foreign born (%)
Place of birth - Foreign born (%) - White
Place of birth - Foreign born (%) - Black or African American
Place of birth - Foreign born (%) - Asian
Place of birth - Foreign born (%) - Hispanic or Latino
Place of birth - Foreign born (%) - American Indian and Alaska Native
Place of birth - Foreign born (%) - Multirace
Place of birth - Foreign born (%) - Other Race
Residents speaking English at home (%)
Residents speaking English at home - Born in the United States (%)
Residents speaking English at home - Native, born elsewhere (%)
Residents speaking English at home - Foreign born (%)
Residents speaking Spanish at home (%)
Residents speaking Spanish at home - Born in the United States (%)
Residents speaking Spanish at home - Native, born elsewhere (%)
Residents speaking Spanish at home - Foreign born (%)
Residents speaking other language at home (%)
Residents speaking other language at home - Born in the United States (%)
Residents speaking other language at home - Native, born elsewhere (%)
Residents speaking other language at home - Foreign born (%)
Marital status - Never married (%)
Marital status - Now married (%)
Marital status - Separated (%)
Marital status - Widowed (%)
Marital status - Divorced (%)
Ancestries Reported - Arab (%)
Ancestries Reported - Czech (%)
Ancestries Reported - Danish (%)
Ancestries Reported - Dutch (%)
Ancestries Reported - English (%)
Ancestries Reported - French (%)
Ancestries Reported - French Canadian (%)
Ancestries Reported - German (%)
Ancestries Reported - Greek (%)
Ancestries Reported - Hungarian (%)
Ancestries Reported - Irish (%)
Ancestries Reported - Italian (%)
Ancestries Reported - Lithuanian (%)
Ancestries Reported - Norwegian (%)
Ancestries Reported - Polish (%)
Ancestries Reported - Portuguese (%)
Ancestries Reported - Russian (%)
Ancestries Reported - Scotch-Irish (%)
Ancestries Reported - Scottish (%)
Ancestries Reported - Slovak (%)
Ancestries Reported - Subsaharan African (%)
Ancestries Reported - Swedish (%)
Ancestries Reported - Swiss (%)
Ancestries Reported - Ukrainian (%)
Ancestries Reported - United States (%)
Ancestries Reported - Welsh (%)
Ancestries Reported - West Indian (%)
Ancestries Reported - Other (%)
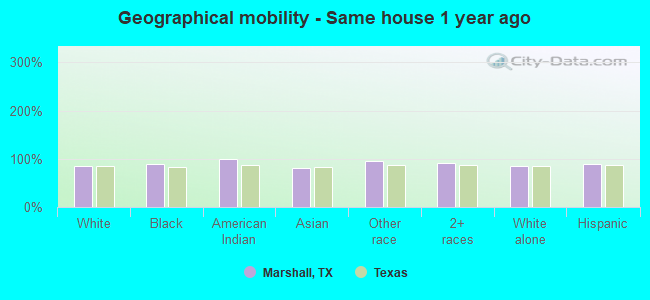
Geographical mobility - Same house 1 year ago (%)
Geographical mobility - Same house 1 year ago (%) - White
Geographical mobility - Same house 1 year ago (%) - Black or African American
Geographical mobility - Same house 1 year ago (%) - Asian
Geographical mobility - Same house 1 year ago (%) - Hispanic or Latino
Geographical mobility - Same house 1 year ago (%) - American Indian and Alaska Native
Geographical mobility - Same house 1 year ago (%) - Multirace
Geographical mobility - Same house 1 year ago (%) - Other Race
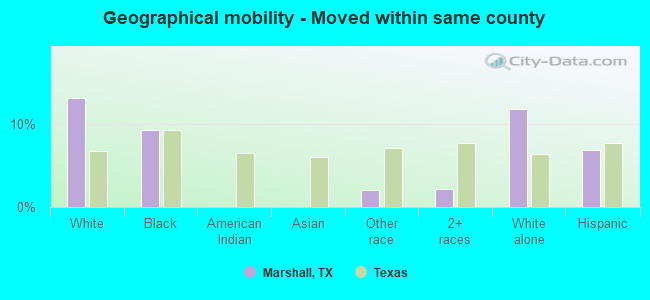
Geographical mobility - Moved within same county (%)
Geographical mobility - Moved within same county (%) - White
Geographical mobility - Moved within same county (%) - Black or African American
Geographical mobility - Moved within same county (%) - Asian
Geographical mobility - Moved within same county (%) - Hispanic or Latino
Geographical mobility - Moved within same county (%) - American Indian and Alaska Native
Geographical mobility - Moved within same county (%) - Multirace
Geographical mobility - Moved within same county (%) - Other Race
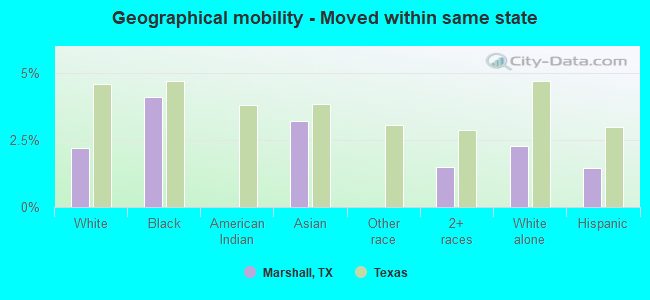
Geographical mobility - Moved from different county within same state (%)
Geographical mobility - Moved from different county within same state (%) - White
Geographical mobility - Moved from different county within same state (%) - Black or African American
Geographical mobility - Moved from different county within same state (%) - Asian
Geographical mobility - Moved from different county within same state (%) - Hispanic or Latino
Geographical mobility - Moved from different county within same state (%) - American Indian and Alaska Native
Geographical mobility - Moved from different county within same state (%) - Multirace
Geographical mobility - Moved from different county within same state (%) - Other Race
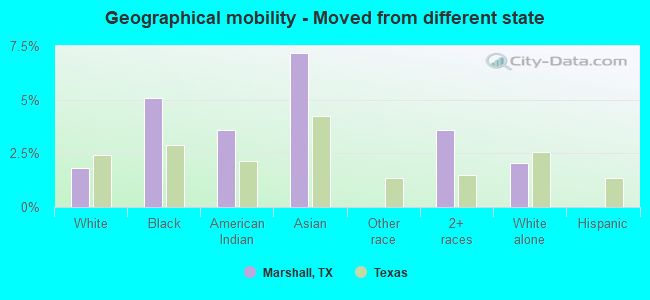
Geographical mobility - Moved from different state (%)
Geographical mobility - Moved from different state (%) - White
Geographical mobility - Moved from different state (%) - Black or African American
Geographical mobility - Moved from different state (%) - Asian
Geographical mobility - Moved from different state (%) - Hispanic or Latino
Geographical mobility - Moved from different state (%) - American Indian and Alaska Native
Geographical mobility - Moved from different state (%) - Multirace
Geographical mobility - Moved from different state (%) - Other Race
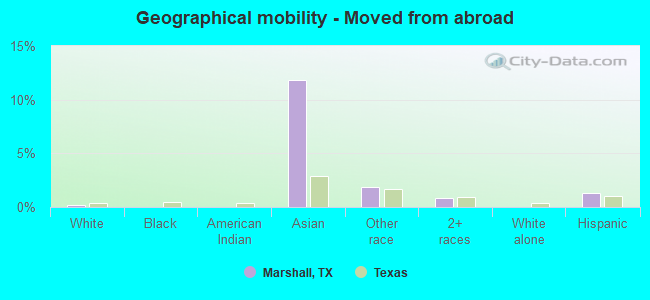
Geographical mobility - Moved from abroad (%)
Geographical mobility - Moved from abroad (%) - White
Geographical mobility - Moved from abroad (%) - Black or African American
Geographical mobility - Moved from abroad (%) - Asian
Geographical mobility - Moved from abroad (%) - Hispanic or Latino
Geographical mobility - Moved from abroad (%) - American Indian and Alaska Native
Geographical mobility - Moved from abroad (%) - Multirace
Geographical mobility - Moved from abroad (%) - Other Race
Place of birth for the foreign-born population - Ireland (%)
Place of birth for the foreign-born population - Denmark (%)
Place of birth for the foreign-born population - Norway (%)
Place of birth for the foreign-born population - Sweden (%)
Place of birth for the foreign-born population - United Kingdom (%)
Place of birth for the foreign-born population - England (%)
Place of birth for the foreign-born population - Scotland (%)
Place of birth for the foreign-born population - Other Northern Europe (%)
Place of birth for the foreign-born population - Austria (%)
Place of birth for the foreign-born population - Belgium (%)
Place of birth for the foreign-born population - France (%)
Place of birth for the foreign-born population - Germany (%)
Place of birth for the foreign-born population - Netherlands (%)
Place of birth for the foreign-born population - Switzerland (%)
Place of birth for the foreign-born population - Other Western Europe (%)
Place of birth for the foreign-born population - Greece (%)
Place of birth for the foreign-born population - Italy (%)
Place of birth for the foreign-born population - Portugal (%)
Place of birth for the foreign-born population - Spain (%)
Place of birth for the foreign-born population - Other Southern Europe (%)
Place of birth for the foreign-born population - Albania (%)
Place of birth for the foreign-born population - Belarus (%)
Place of birth for the foreign-born population - Bosnia and Herzegovina (%)
Place of birth for the foreign-born population - Bulgaria (%)
Place of birth for the foreign-born population - Croatia (%)
Place of birth for the foreign-born population - Czechoslovakia (%)
Place of birth for the foreign-born population - Hungary (%)
Place of birth for the foreign-born population - Latvia (%)
Place of birth for the foreign-born population - Lithuania (%)
Place of birth for the foreign-born population - North Macedonia (Macedonia) (%)
Place of birth for the foreign-born population - Moldova (%)
Place of birth for the foreign-born population - Poland (%)
Place of birth for the foreign-born population - Romania (%)
Place of birth for the foreign-born population - Russia (%)
Place of birth for the foreign-born population - Serbia (%)
Place of birth for the foreign-born population - Ukraine (%)
Place of birth for the foreign-born population - Other Eastern Europe (%)
Place of birth for the foreign-born population - China (%)
Place of birth for the foreign-born population - Hong Kong (%)
Place of birth for the foreign-born population - Taiwan (%)
Place of birth for the foreign-born population - Japan (%)
Place of birth for the foreign-born population - Korea (%)
Place of birth for the foreign-born population - Other Eastern Asia (%)
Place of birth for the foreign-born population - Afghanistan (%)
Place of birth for the foreign-born population - Bangladesh (%)
Place of birth for the foreign-born population - India (%)
Place of birth for the foreign-born population - Iran (%)
Place of birth for the foreign-born population - Kazakhstan (%)
Place of birth for the foreign-born population - Nepal (%)
Place of birth for the foreign-born population - Pakistan (%)
Place of birth for the foreign-born population - Sri Lanka (%)
Place of birth for the foreign-born population - Uzbekistan (%)
Place of birth for the foreign-born population - Other South Central Asia (%)
Place of birth for the foreign-born population - Burma (%)
Place of birth for the foreign-born population - Cambodia (%)
Place of birth for the foreign-born population - Indonesia (%)
Place of birth for the foreign-born population - Laos (%)
Place of birth for the foreign-born population - Malaysia (%)
Place of birth for the foreign-born population - Philippines (%)
Place of birth for the foreign-born population - Singapore (%)
Place of birth for the foreign-born population - Thailand (%)
Place of birth for the foreign-born population - Vietnam (%)
Place of birth for the foreign-born population - Other South Eastern Asia (%)
Place of birth for the foreign-born population - Armenia (%)
Place of birth for the foreign-born population - Iraq (%)
Place of birth for the foreign-born population - Israel (%)
Place of birth for the foreign-born population - Jordan (%)
Place of birth for the foreign-born population - Kuwait (%)
Place of birth for the foreign-born population - Lebanon (%)
Place of birth for the foreign-born population - Saudi Arabia (%)
Place of birth for the foreign-born population - Syria (%)
Place of birth for the foreign-born population - Turkey (%)
Place of birth for the foreign-born population - Yemen (%)
Place of birth for the foreign-born population - Other Western Asia (%)
Place of birth for the foreign-born population - Eritrea (%)
Place of birth for the foreign-born population - Ethiopia (%)
Place of birth for the foreign-born population - Kenya (%)
Place of birth for the foreign-born population - Somalia (%)
Place of birth for the foreign-born population - Uganda (%)
Place of birth for the foreign-born population - Zimbabwe (%)
Place of birth for the foreign-born population - Other Eastern Africa (%)
Place of birth for the foreign-born population - Cameroon (%)
Place of birth for the foreign-born population - Congo (%)
Place of birth for the foreign-born population - Democratic Republic of Congo (Zaire) (%)
Place of birth for the foreign-born population - Other Middle Africa (%)
Place of birth for the foreign-born population - Egypt (%)
Place of birth for the foreign-born population - Morocco (%)
Place of birth for the foreign-born population - Sudan (%)
Place of birth for the foreign-born population - Other Northern Africa (%)
Place of birth for the foreign-born population - South Africa (%)
Place of birth for the foreign-born population - Other Southern Africa (%)
Place of birth for the foreign-born population - Cabo Verde (%)
Place of birth for the foreign-born population - Ghana (%)
Place of birth for the foreign-born population - Liberia (%)
Place of birth for the foreign-born population - Nigeria (%)
Place of birth for the foreign-born population - Senegal (%)
Place of birth for the foreign-born population - Sierra Leone (%)
Place of birth for the foreign-born population - Other Western Africa (%)
Place of birth for the foreign-born population - Australia (%)
Place of birth for the foreign-born population - New Zealand (%)
Place of birth for the foreign-born population - Fiji (%)
Place of birth for the foreign-born population - Micronesia (%)
Place of birth for the foreign-born population - Bahamas (%)
Place of birth for the foreign-born population - Barbados (%)
Place of birth for the foreign-born population - Cuba (%)
Place of birth for the foreign-born population - Dominica (%)
Place of birth for the foreign-born population - Dominican Republic (%)
Place of birth for the foreign-born population - Grenada (%)
Place of birth for the foreign-born population - Haiti (%)
Place of birth for the foreign-born population - Jamaica (%)
Place of birth for the foreign-born population - St. Vincent and the Grenadines (%)
Place of birth for the foreign-born population - Trinidad and Tobago (%)
Place of birth for the foreign-born population - West Indies (%)
Place of birth for the foreign-born population - Other Caribbean (%)
Place of birth for the foreign-born population - Belize (%)
Place of birth for the foreign-born population - Costa Rica (%)
Place of birth for the foreign-born population - El Salvador (%)
Place of birth for the foreign-born population - Guatemala (%)
Place of birth for the foreign-born population - Honduras (%)
Place of birth for the foreign-born population - Mexico (%)
Place of birth for the foreign-born population - Nicaragua (%)
Place of birth for the foreign-born population - Panama (%)
Place of birth for the foreign-born population - Other Central America (%)
Place of birth for the foreign-born population - Argentina (%)
Place of birth for the foreign-born population - Bolivia (%)
Place of birth for the foreign-born population - Brazil (%)
Place of birth for the foreign-born population - Chile (%)
Place of birth for the foreign-born population - Colombia (%)
Place of birth for the foreign-born population - Ecuador (%)
Place of birth for the foreign-born population - Guyana (%)
Place of birth for the foreign-born population - Peru (%)
Place of birth for the foreign-born population - Uruguay (%)
Place of birth for the foreign-born population - Venezuela (%)
Place of birth for the foreign-born population - Other South America (%)
Place of birth for the foreign-born population - Canada (%)
Place of birth for the foreign-born population - Other Northern America (%)
Place of birth for the foreign-born population - Other (%)
Latest news about races in Marshall, TX collected exclusively by city-data.com from local newspapers, TV, and radio stations
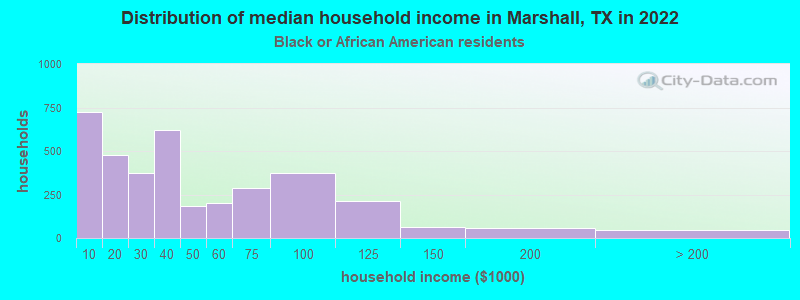
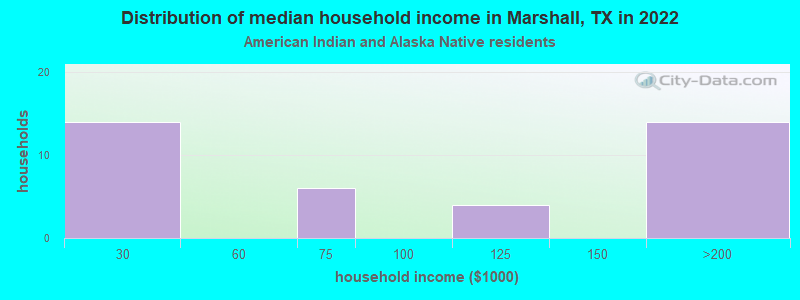
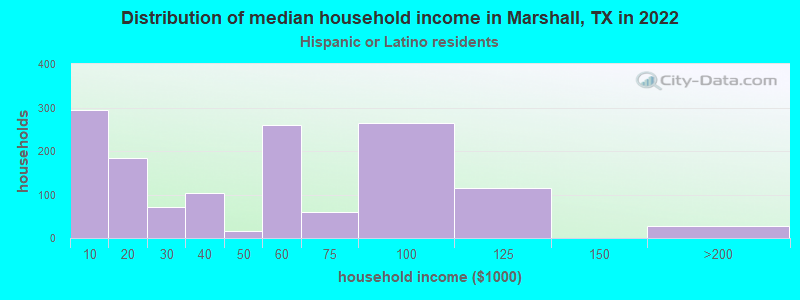
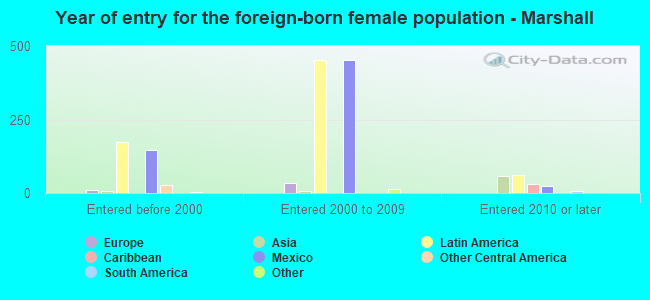
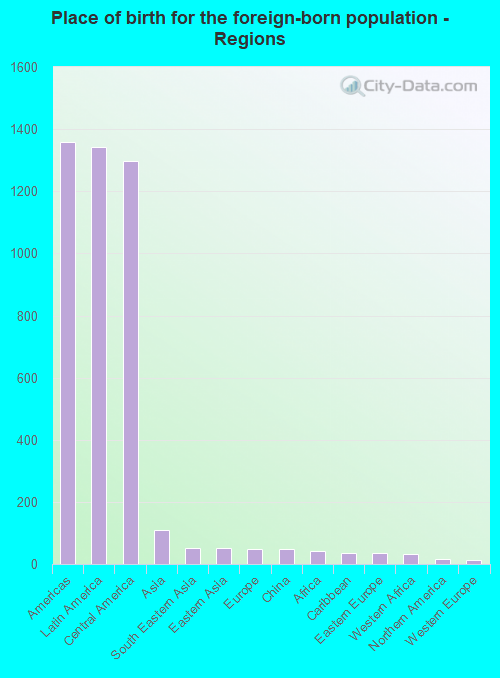
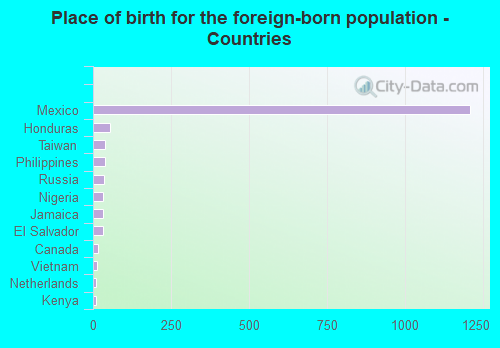
According to 2022 data, the most numerous races in Marshall, TX are Hispanic (5,001 residents), White alone (8,255 residents), and Black alone (9,632 residents). 85.0% of Marshall residents speak English at home. 6.6% of Marshall, TX residents are foreign-born (5.5% born in Latin America), which is 159.2% less than the foreign-born rate of 17.0% across the entire state of Texas.
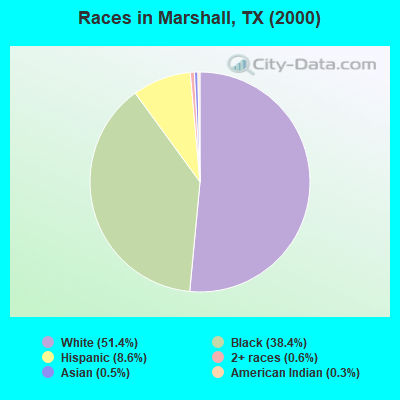
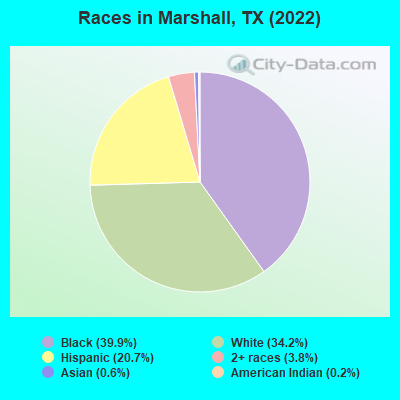
Race distribution in Marshall
2000 2022
10,933,313 52.4% White alone 6,669,666 32.0% Hispanic 2,364,255 11.3% Black alone 554,445 2.7% Asian alone 230,567 1.1% Two or more races 68,859 0.3% American Indian alone 19,958 0.10% Other race alone 10,757 0.05% Native Hawaiian and Other
12,070,642 40.2% Hispanic 11,683,430 38.9% White alone 3,508,706 11.7% Black alone 1,608,173 5.4% Asian alone 956,560 3.2% Two or more races 125,763 0.4% Other race alone 47,023 0.2% American Indian alone 29,275 0.10% Native Hawaiian and Other
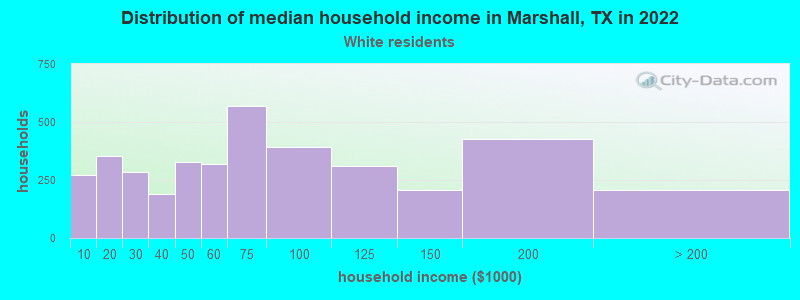
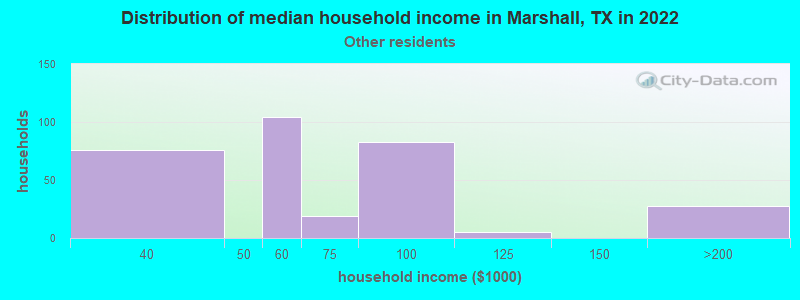
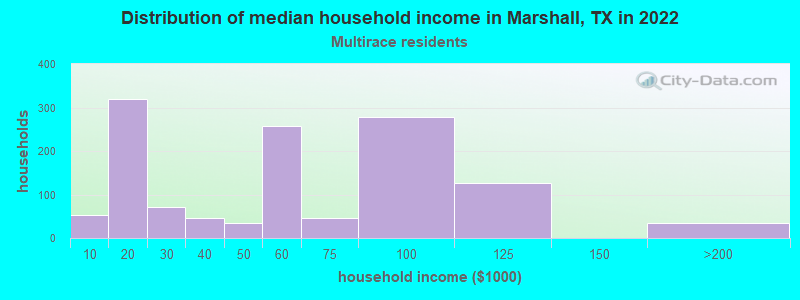
Income and house value in Marshall Median household income in 2022 $69,613 White non-Hispanic householders$51,808 Black householders$54,730 Some other race householders$64,010 Two or more races householders$54,950 Hispanic or Latino race householdersMedian 2022 house value $138,752 White Non-Hispanic householders$78,640 Black or African American householders$42,408 American Indian or Alaska Native householders $204,835 Asian householders$28,409 Some other race householders$62,582 Two or more races householders$55,995 Hispanic or Latino householders
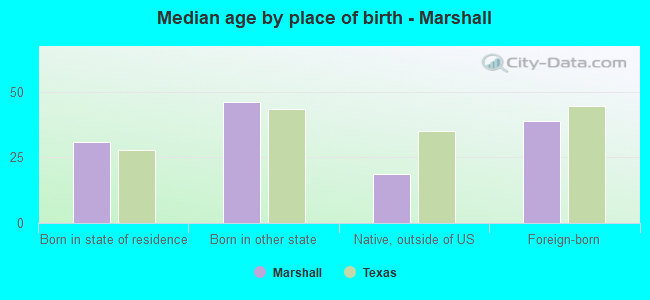
Median age by race in Marshall
44.0 Median age for White residents43.3 45.9 36.6 Median age for Black or African American residents31.1 37.2 24.7 Median age for American Indian / Alaska Native residents37.9 14.2 38.1 Median age for Asian residents19.4 38.2 -666,666,666.0 Median age for Native Hawaiian / Pacific Islander residents-666,666,666.0 -666,666,666.0 24.5 Median age for Other race residents37.0 18.4 27.3 Median age for Two or more races residents34.0 19.5 47.8 Median age for White alone residents43.4 50.8 28.5 Median age for Hispanic or Latino residents31.2 16.7
Owner/renter occupied households by race in Marshall
House owners and renters - White residents 2,855 78.5% Owner occupied783 21.5% Renter occupiedHouse owners and renters - Black or African American residents 1,724 57.2% Owner occupied1,292 42.8% Renter occupiedHouse owners and renters - American Indian / Alaska Native residents 33 88.8% Owner occupied4 11.2% Renter occupiedHouse owners and renters - Asian residents 9 100.0% Owner occupiedHouse owners and renters - Other race residents 244 79.7% Owner occupied62 20.3% Renter occupiedHouse owners and renters - Two or more races residents 1,061 63.0% Owner occupied623 37.0% Renter occupiedHouse owners and renters - White alone residents 2,756 80.9% Owner occupied650 19.1% Renter occupiedHouse owners and renters - Hispanic or Latino residents 1,026 72.6% Owner occupied388 27.4% Renter occupied
Language usage in Marshall
English speakers - Total 85.0% of residents of Marshall speak English at home.
14.1% of residents speak Spanish at home 2,097 65.5% Speak English very well1,105 34.5% Speak English less than very well0.8% of residents speak other language at home 140 75.7% Speak English very well45 24.3% Speak English less than very well
English speakers - Born in the United States 96.3% of residents of Marshall speak English at home.
3.2% of residents speak Spanish at home 154 89.5% Speak English very well18 10.5% Speak English less than very well0.2% of residents speak other language at home 9 100.0% Speak English very well
English speakers - Native, born elsewhere 77.5% of residents of Marshall speak English at home.
20.8% of residents speak Spanish at home 31 52.5% Speak English very well28 47.5% Speak English less than very well
English speakers - Foreign-born 18.4% of residents of Marshall speak English at home.
71.2% of residents speak Spanish at home 255 23.1% Speak English very well849 76.9% Speak English less than very well9.9% of residents speak other language at home 108 70.6% Speak English very well45 29.4% Speak English less than very well
White (Caucasian) - Speak only English Native:
100.0% (8,108)Foreign-born:
60.4% (125)
White (Caucasian) - Speak another language Native:
4.5% (367)Foreign-born:
58.3% (120)
Black or African American - Speak only English Native:
98.9% (8,855)Foreign-born:
41.8% (33)
Black or African American - Speak another language Native:
1.1% (100)Foreign-born:
56.6% (45)
American Indian / Alaska Native - Speak another language Native:
15.2% (14)Foreign-born:
98.9% (13)
Asian - Speak only English Native:
66.2% (22)Foreign-born:
30.9% (32)
Asian - Speak another language Native:
34.1% (11)Foreign-born:
69.8% (72)
Other race - Speak only English Native:
36.8% (350)Foreign-born:
5.4% (18)
Other race - Speak another language Native:
63.3% (604)Foreign-born:
94.6% (322)
Two or more races - Speak only English Native:
47.2% (1,624)Foreign-born:
10.4% (107)
Two or more races - Speak another language Native:
39.7% (1,367)Foreign-born:
93.2% (961)
White alone - Speak only English Native:
98.9% (7,998)Foreign-born:
43.6% (29)
White alone - Speak another language Native:
1.2% (97)Foreign-born:
56.4% (38)
Hispanic or Latino - Speak only English Native:
17.6% (460)Foreign-born:
10.7% (199)
Hispanic or Latino - Speak another language Native:
94.2% (2,465)Foreign-born:
97.2% (1,806)
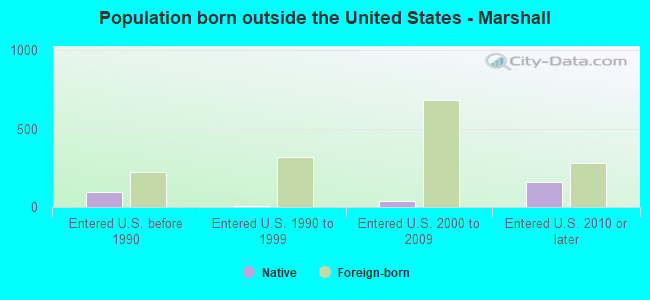
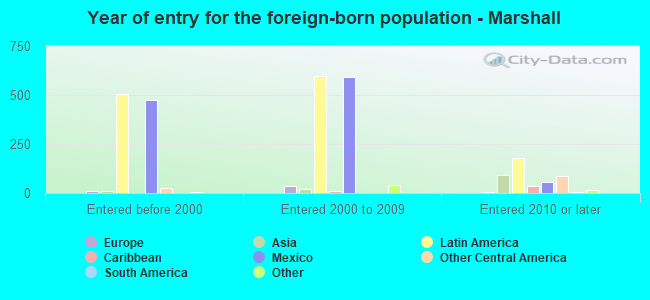
Foreign-born residents in Marshall 1,561 residents are foreign born (5.5% Latin America ).
This city:
6.6%Texas:
17.1%
Marital status for residents in Marshall Marital status - White (Caucasian) population 15 years and over
Males 39.2% Never married45.0% Now married1.3% Separated2.4% Widowed12.1% DivorcedFemales 28.6% Never married42.0% Now married1.5% Separated15.9% Widowed12.0% DivorcedWomen who gave birth in the past 12 months Now married:
50.0% (23)Unmarried:
50.0% (23)
Women who did not give birth in the past 12 months Now married:
33.8% (568)Unmarried:
66.2% (1,110)
Marital status - Black or African American population 15 years and over
Males 50.4% Never married31.7% Now married1.7% Separated1.3% Widowed14.9% DivorcedFemales 60.4% Never married14.1% Now married1.6% Separated12.2% Widowed11.6% DivorcedWomen who gave birth in the past 12 months Now married:
2.4% (5)Unmarried:
97.6% (207)
Women who did not give birth in the past 12 months Now married:
7.8% (206)Unmarried:
92.2% (2,426)
Marital status - American Indian / Alaska Native population 15 years and over
Males 25.0% Never married75.0% Now married0.0% Separated0.0% Widowed0.0% DivorcedFemales 0.0% Never married70.8% Now married0.0% Separated29.2% Widowed0.0% DivorcedWomen who gave birth in the past 12 months Now married:
100.0% (6)Unmarried:
0.0% (0)
Women who did not give birth in the past 12 months Now married:
100.0% (14)Unmarried:
0.0% (0)
Marital status - Asian population 15 years and over
Males 42.1% Never married28.9% Now married0.0% Separated0.0% Widowed28.9% DivorcedFemales 28.2% Never married41.0% Now married10.3% Separated0.0% Widowed20.5% DivorcedWomen who did not give birth in the past 12 months Now married:
42.3% (24)Unmarried:
57.7% (32)
Marital status - Other race population 15 years and over
Males 67.8% Never married26.0% Now married0.0% Separated0.0% Widowed6.2% DivorcedFemales 45.3% Never married37.5% Now married0.0% Separated0.0% Widowed17.2% DivorcedWomen who gave birth in the past 12 months Now married:
100.0% (15)Unmarried:
0.0% (0)
Women who did not give birth in the past 12 months Now married:
29.9% (146)Unmarried:
70.1% (341)
Marital status - Two or more races population 15 years and over
Males 46.2% Never married48.6% Now married0.0% Separated1.7% Widowed3.5% DivorcedFemales 43.8% Never married22.1% Now married17.8% Separated3.3% Widowed13.0% DivorcedWomen who gave birth in the past 12 months Now married:
0.0% (0)Unmarried:
100.0% (39)
Women who did not give birth in the past 12 months Now married:
38.7% (471)Unmarried:
61.3% (745)
Marital status - White alone, not Hispanic / Latino population 15 years and over
Males 36.8% Never married47.7% Now married1.5% Separated2.7% Widowed11.2% DivorcedFemales 24.2% Never married44.7% Now married1.1% Separated17.4% Widowed12.7% DivorcedWomen who gave birth in the past 12 months Now married:
57.1% (28)Unmarried:
42.9% (21)
Women who did not give birth in the past 12 months Now married:
37.1% (631)Unmarried:
62.9% (1,071)
Marital status - Hispanic or Latino population 15 years and over
Males 52.1% Never married38.8% Now married0.0% Separated1.0% Widowed8.1% DivorcedFemales 53.9% Never married24.4% Now married12.0% Separated2.9% Widowed6.9% DivorcedWomen who gave birth in the past 12 months Now married:
32.6% (16)Unmarried:
67.4% (32)
Women who did not give birth in the past 12 months Now married:
32.5% (447)Unmarried:
67.5% (929)
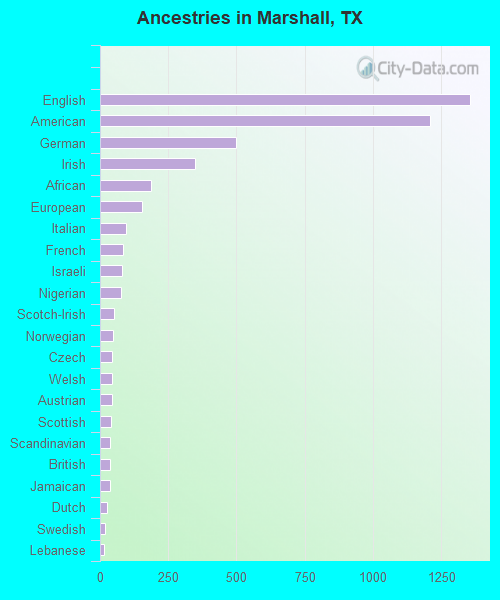
Ancestries in Marshall
1,358 9.6% English1,208 8.5% American499 3.5% German349 2.5% Irish187 1.3% African155 1.1% European95 0.7% Italian83 0.6% French82 0.6% Israeli76 0.5% Nigerian50 0.4% Scotch-Irish46 0.3% Norwegian45 0.3% Czech44 0.3% Welsh43 0.3% Austrian42 0.3% Scottish37 0.3% Scandinavian36 0.3% British36 0.3% Jamaican27 0.2% Dutch18 0.1% Swedish15 0.1% Lebanese11 0.08% Kenyan10 0.07% French Canadian6 0.04% Brazilian4 0.03% Trinidadian and Tobagonian3 0.02% Polish1 0.01% Hungarian
Geographical mobility in Marshall Same house 1 year ago 7,836 84.5% White (Caucasian)7,201 90.0% Black or African American131 99.2% American Indian / Alaska Native119 80.3% Asian1,466 96.5% Other race3,957 92.2% Two or more races7,106 85.7% White alone, not Hispanic / Latino4,484 90.2% Hispanic or LatinoMoved within same county 1,219 13.1% White / Caucasian748 9.4% Black or African American32 2.1% Other race92 2.1% Two or more races988 11.9% White alone, not Hispanic / Latino341 6.9% Hispanic or LatinoMoved within same state 205 2.2% White / Caucasian327 4.1% Black or African American5 3.2% Asian63 1.5% Two or more races190 2.3% White alone, not Hispanic / Latino72 1.5% Hispanic or LatinoMoved from different state 170 1.8% White / Caucasian407 5.1% Black or African American5 3.6% American Indian / Alaska Native11 7.2% Asian154 3.6% Two or more races170 2.0% White alone, not Hispanic / LatinoMoved from abroad 18 0.2% White17 11.8% Asian29 1.9% Other race38 0.9% Two or more races66 1.3% Hispanic or Latino
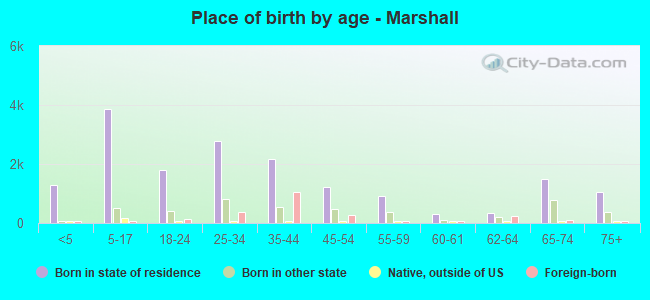
Children Nativity (place of birth) in Marshall
Children under 6 years - Living with two parents Both parents native 357 100.0% NativeBoth parents foreign-born 89 100.0% NativeOne native, one foreign-born parent 32 100.0% NativeChildren under 6 years - Living with one parent Native parent 822 100.0% NativeForeign-born parent 204 95.4% Native10 4.6% Foreign-bornChildren 6 to 17 years - Living with two parents Both parents native 918 100.0% NativeBoth parents foreign-born 378 100.0% NativeOne native, one foreign-born parent 165 100.0% NativeChildren 6 to 17 years - Living with one parent Native parent 1,816 100.0% NativeForeign-born parent 501 51.0% Native482 49.0% Foreign-born
Grandparents responsible for own grandchildren in Marshall
Grandparents (30 to 59 years) White / Caucasian 19 42.5% Responsible for grandchildren26 57.5% Not responsible for grandchildrenBlack or African American 25 49.8% Responsible for grandchildren25 50.2% Not responsible for grandchildrenTwo or more races 20 100.0% Not responsible for grandchildrenWhite alone, not Hispanic / Latino 25 38.2% Responsible for grandchildren40 61.8% Not responsible for grandchildrenHispanic or Latino 12 100.0% Not responsible for grandchildrenGrandparents (60 years and over) White / Caucasian 14 24.4% Responsible for grandchildren43 75.6% Not responsible for grandchildrenBlack or African American 44 25.5% Responsible for grandchildren127 74.5% Not responsible for grandchildrenTwo or more races 55 100.0% Not responsible for grandchildrenWhite alone, not Hispanic / Latino 16 21.8% Responsible for grandchildren59 78.2% Not responsible for grandchildrenHispanic or Latino 14 43.7% Responsible for grandchildren19 56.3% Not responsible for grandchildren