Races in Martinez, Georgia (GA) Detailed Stats
Data:
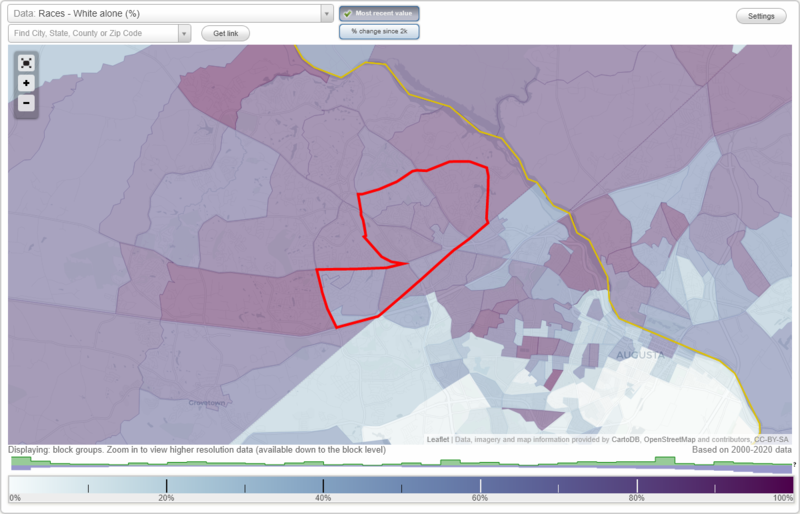
Races - White alone (%)
Races - White alone (% change since 2000)
Races - Black alone (%)
Races - Black alone (% change since 2000)
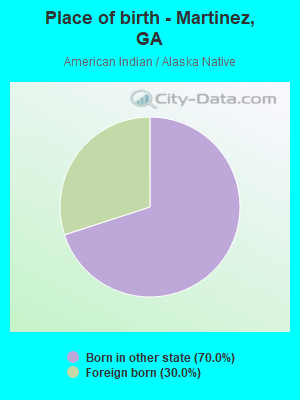
Races - American Indian alone (%)
Races - American Indian alone (% change since 2000)
Races - Asian alone (%)
Races - Asian alone (% change since 2000)
Races - Hispanic (%)
Races - Hispanic (% change since 2000)
Races - Native Hawaiian and Other Pacific Islander alone (%)
Races - Native Hawaiian and Other Pacific Islander alone (% change since 2000)
Races - Two or more races(%)
Races - Two or more races(% change since 2000)
Races - Other race alone (%)
Races - Other race alone (% change since 2000)
Racial diversity
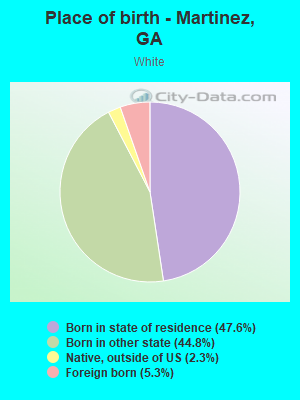
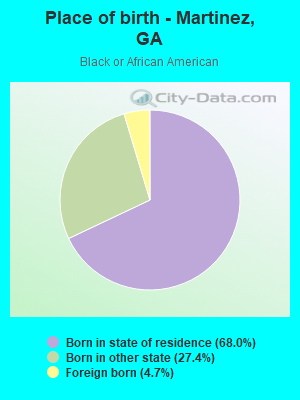
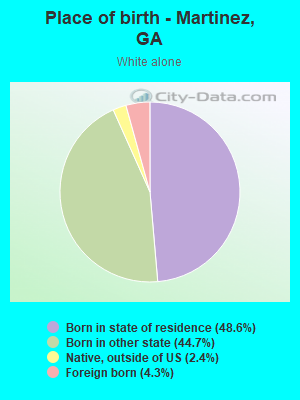
Place of birth - Born in state of residence (%)
Place of birth - Born in state of residence (%) - White
Place of birth - Born in state of residence (%) - Black or African American
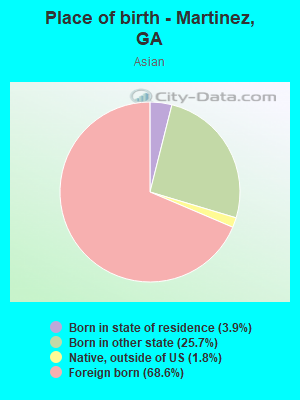
Place of birth - Born in state of residence (%) - Asian
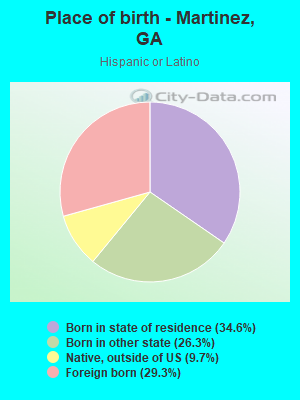
Place of birth - Born in state of residence (%) - Hispanic or Latino
Place of birth - Born in state of residence (%) - American Indian and Alaska Native
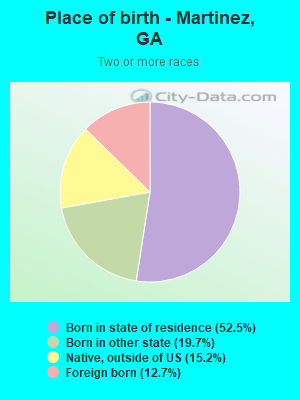
Place of birth - Born in state of residence (%) - Multirace
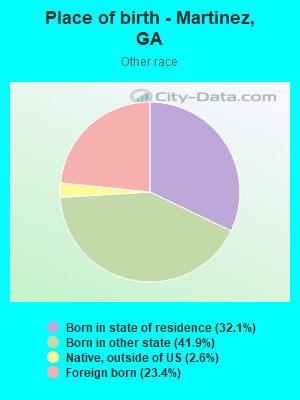
Place of birth - Born in state of residence (%) - Other Race
Place of birth - Born in other state (%)
Place of birth - Born in other state (%) - White
Place of birth - Born in other state (%) - Black or African American
Place of birth - Born in other state (%) - Asian
Place of birth - Born in other state (%) - Hispanic or Latino
Place of birth - Born in other state (%) - American Indian and Alaska Native
Place of birth - Born in other state (%) - Multirace
Place of birth - Born in other state (%) - Other Race
Place of birth - Native, outside of US (%)
Place of birth - Native, outside of US (%) - White
Place of birth - Native, outside of US (%) - Black or African American
Place of birth - Native, outside of US (%) - Asian
Place of birth - Native, outside of US (%) - Hispanic or Latino
Place of birth - Native, outside of US (%) - American Indian and Alaska Native
Place of birth - Native, outside of US (%) - Multirace
Place of birth - Native, outside of US (%) - Other Race
Place of birth - Foreign born (%)
Place of birth - Foreign born (%) - White
Place of birth - Foreign born (%) - Black or African American
Place of birth - Foreign born (%) - Asian
Place of birth - Foreign born (%) - Hispanic or Latino
Place of birth - Foreign born (%) - American Indian and Alaska Native
Place of birth - Foreign born (%) - Multirace
Place of birth - Foreign born (%) - Other Race
Residents speaking English at home (%)
Residents speaking English at home - Born in the United States (%)
Residents speaking English at home - Native, born elsewhere (%)
Residents speaking English at home - Foreign born (%)
Residents speaking Spanish at home (%)
Residents speaking Spanish at home - Born in the United States (%)
Residents speaking Spanish at home - Native, born elsewhere (%)
Residents speaking Spanish at home - Foreign born (%)
Residents speaking other language at home (%)
Residents speaking other language at home - Born in the United States (%)
Residents speaking other language at home - Native, born elsewhere (%)
Residents speaking other language at home - Foreign born (%)
Marital status - Never married (%)
Marital status - Now married (%)
Marital status - Separated (%)
Marital status - Widowed (%)
Marital status - Divorced (%)
Ancestries Reported - Arab (%)
Ancestries Reported - Czech (%)
Ancestries Reported - Danish (%)
Ancestries Reported - Dutch (%)
Ancestries Reported - English (%)
Ancestries Reported - French (%)
Ancestries Reported - French Canadian (%)
Ancestries Reported - German (%)
Ancestries Reported - Greek (%)
Ancestries Reported - Hungarian (%)
Ancestries Reported - Irish (%)
Ancestries Reported - Italian (%)
Ancestries Reported - Lithuanian (%)
Ancestries Reported - Norwegian (%)
Ancestries Reported - Polish (%)
Ancestries Reported - Portuguese (%)
Ancestries Reported - Russian (%)
Ancestries Reported - Scotch-Irish (%)
Ancestries Reported - Scottish (%)
Ancestries Reported - Slovak (%)
Ancestries Reported - Subsaharan African (%)
Ancestries Reported - Swedish (%)
Ancestries Reported - Swiss (%)
Ancestries Reported - Ukrainian (%)
Ancestries Reported - United States (%)
Ancestries Reported - Welsh (%)
Ancestries Reported - West Indian (%)
Ancestries Reported - Other (%)
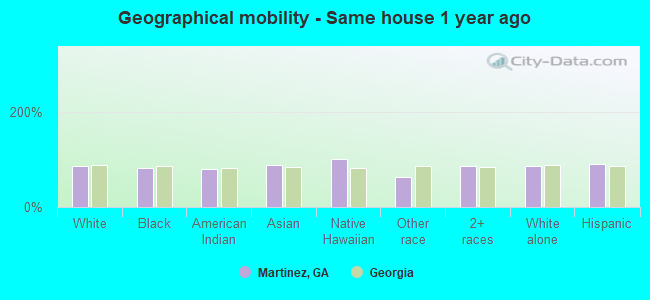
Geographical mobility - Same house 1 year ago (%)
Geographical mobility - Same house 1 year ago (%) - White
Geographical mobility - Same house 1 year ago (%) - Black or African American
Geographical mobility - Same house 1 year ago (%) - Asian
Geographical mobility - Same house 1 year ago (%) - Hispanic or Latino
Geographical mobility - Same house 1 year ago (%) - American Indian and Alaska Native
Geographical mobility - Same house 1 year ago (%) - Multirace
Geographical mobility - Same house 1 year ago (%) - Other Race
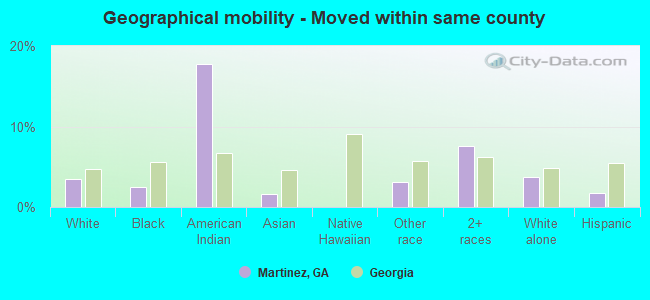
Geographical mobility - Moved within same county (%)
Geographical mobility - Moved within same county (%) - White
Geographical mobility - Moved within same county (%) - Black or African American
Geographical mobility - Moved within same county (%) - Asian
Geographical mobility - Moved within same county (%) - Hispanic or Latino
Geographical mobility - Moved within same county (%) - American Indian and Alaska Native
Geographical mobility - Moved within same county (%) - Multirace
Geographical mobility - Moved within same county (%) - Other Race
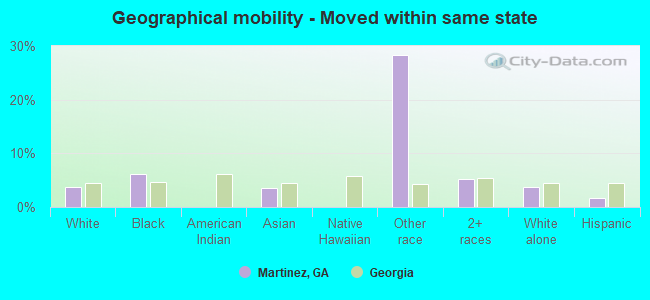
Geographical mobility - Moved from different county within same state (%)
Geographical mobility - Moved from different county within same state (%) - White
Geographical mobility - Moved from different county within same state (%) - Black or African American
Geographical mobility - Moved from different county within same state (%) - Asian
Geographical mobility - Moved from different county within same state (%) - Hispanic or Latino
Geographical mobility - Moved from different county within same state (%) - American Indian and Alaska Native
Geographical mobility - Moved from different county within same state (%) - Multirace
Geographical mobility - Moved from different county within same state (%) - Other Race
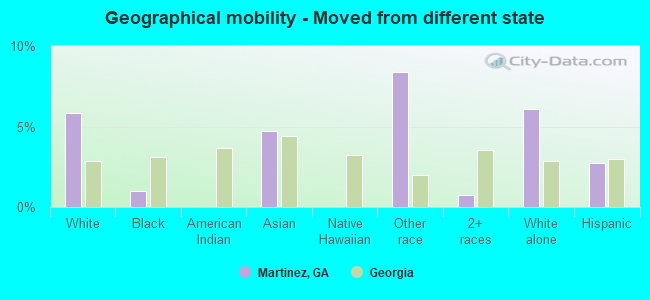
Geographical mobility - Moved from different state (%)
Geographical mobility - Moved from different state (%) - White
Geographical mobility - Moved from different state (%) - Black or African American
Geographical mobility - Moved from different state (%) - Asian
Geographical mobility - Moved from different state (%) - Hispanic or Latino
Geographical mobility - Moved from different state (%) - American Indian and Alaska Native
Geographical mobility - Moved from different state (%) - Multirace
Geographical mobility - Moved from different state (%) - Other Race
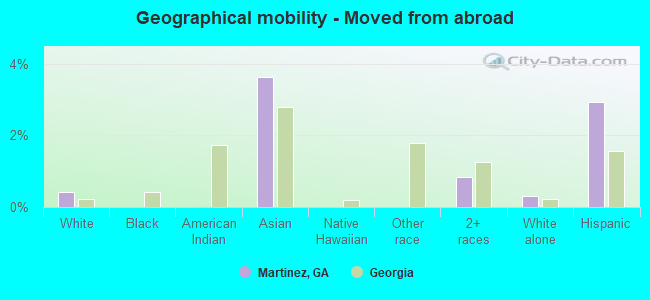
Geographical mobility - Moved from abroad (%)
Geographical mobility - Moved from abroad (%) - White
Geographical mobility - Moved from abroad (%) - Black or African American
Geographical mobility - Moved from abroad (%) - Asian
Geographical mobility - Moved from abroad (%) - Hispanic or Latino
Geographical mobility - Moved from abroad (%) - American Indian and Alaska Native
Geographical mobility - Moved from abroad (%) - Multirace
Geographical mobility - Moved from abroad (%) - Other Race
Place of birth for the foreign-born population - Ireland (%)
Place of birth for the foreign-born population - Denmark (%)
Place of birth for the foreign-born population - Norway (%)
Place of birth for the foreign-born population - Sweden (%)
Place of birth for the foreign-born population - United Kingdom (%)
Place of birth for the foreign-born population - England (%)
Place of birth for the foreign-born population - Scotland (%)
Place of birth for the foreign-born population - Other Northern Europe (%)
Place of birth for the foreign-born population - Austria (%)
Place of birth for the foreign-born population - Belgium (%)
Place of birth for the foreign-born population - France (%)
Place of birth for the foreign-born population - Germany (%)
Place of birth for the foreign-born population - Netherlands (%)
Place of birth for the foreign-born population - Switzerland (%)
Place of birth for the foreign-born population - Other Western Europe (%)
Place of birth for the foreign-born population - Greece (%)
Place of birth for the foreign-born population - Italy (%)
Place of birth for the foreign-born population - Portugal (%)
Place of birth for the foreign-born population - Spain (%)
Place of birth for the foreign-born population - Other Southern Europe (%)
Place of birth for the foreign-born population - Albania (%)
Place of birth for the foreign-born population - Belarus (%)
Place of birth for the foreign-born population - Bosnia and Herzegovina (%)
Place of birth for the foreign-born population - Bulgaria (%)
Place of birth for the foreign-born population - Croatia (%)
Place of birth for the foreign-born population - Czechoslovakia (%)
Place of birth for the foreign-born population - Hungary (%)
Place of birth for the foreign-born population - Latvia (%)
Place of birth for the foreign-born population - Lithuania (%)
Place of birth for the foreign-born population - North Macedonia (Macedonia) (%)
Place of birth for the foreign-born population - Moldova (%)
Place of birth for the foreign-born population - Poland (%)
Place of birth for the foreign-born population - Romania (%)
Place of birth for the foreign-born population - Russia (%)
Place of birth for the foreign-born population - Serbia (%)
Place of birth for the foreign-born population - Ukraine (%)
Place of birth for the foreign-born population - Other Eastern Europe (%)
Place of birth for the foreign-born population - China (%)
Place of birth for the foreign-born population - Hong Kong (%)
Place of birth for the foreign-born population - Taiwan (%)
Place of birth for the foreign-born population - Japan (%)
Place of birth for the foreign-born population - Korea (%)
Place of birth for the foreign-born population - Other Eastern Asia (%)
Place of birth for the foreign-born population - Afghanistan (%)
Place of birth for the foreign-born population - Bangladesh (%)
Place of birth for the foreign-born population - India (%)
Place of birth for the foreign-born population - Iran (%)
Place of birth for the foreign-born population - Kazakhstan (%)
Place of birth for the foreign-born population - Nepal (%)
Place of birth for the foreign-born population - Pakistan (%)
Place of birth for the foreign-born population - Sri Lanka (%)
Place of birth for the foreign-born population - Uzbekistan (%)
Place of birth for the foreign-born population - Other South Central Asia (%)
Place of birth for the foreign-born population - Burma (%)
Place of birth for the foreign-born population - Cambodia (%)
Place of birth for the foreign-born population - Indonesia (%)
Place of birth for the foreign-born population - Laos (%)
Place of birth for the foreign-born population - Malaysia (%)
Place of birth for the foreign-born population - Philippines (%)
Place of birth for the foreign-born population - Singapore (%)
Place of birth for the foreign-born population - Thailand (%)
Place of birth for the foreign-born population - Vietnam (%)
Place of birth for the foreign-born population - Other South Eastern Asia (%)
Place of birth for the foreign-born population - Armenia (%)
Place of birth for the foreign-born population - Iraq (%)
Place of birth for the foreign-born population - Israel (%)
Place of birth for the foreign-born population - Jordan (%)
Place of birth for the foreign-born population - Kuwait (%)
Place of birth for the foreign-born population - Lebanon (%)
Place of birth for the foreign-born population - Saudi Arabia (%)
Place of birth for the foreign-born population - Syria (%)
Place of birth for the foreign-born population - Turkey (%)
Place of birth for the foreign-born population - Yemen (%)
Place of birth for the foreign-born population - Other Western Asia (%)
Place of birth for the foreign-born population - Eritrea (%)
Place of birth for the foreign-born population - Ethiopia (%)
Place of birth for the foreign-born population - Kenya (%)
Place of birth for the foreign-born population - Somalia (%)
Place of birth for the foreign-born population - Uganda (%)
Place of birth for the foreign-born population - Zimbabwe (%)
Place of birth for the foreign-born population - Other Eastern Africa (%)
Place of birth for the foreign-born population - Cameroon (%)
Place of birth for the foreign-born population - Congo (%)
Place of birth for the foreign-born population - Democratic Republic of Congo (Zaire) (%)
Place of birth for the foreign-born population - Other Middle Africa (%)
Place of birth for the foreign-born population - Egypt (%)
Place of birth for the foreign-born population - Morocco (%)
Place of birth for the foreign-born population - Sudan (%)
Place of birth for the foreign-born population - Other Northern Africa (%)
Place of birth for the foreign-born population - South Africa (%)
Place of birth for the foreign-born population - Other Southern Africa (%)
Place of birth for the foreign-born population - Cabo Verde (%)
Place of birth for the foreign-born population - Ghana (%)
Place of birth for the foreign-born population - Liberia (%)
Place of birth for the foreign-born population - Nigeria (%)
Place of birth for the foreign-born population - Senegal (%)
Place of birth for the foreign-born population - Sierra Leone (%)
Place of birth for the foreign-born population - Other Western Africa (%)
Place of birth for the foreign-born population - Australia (%)
Place of birth for the foreign-born population - New Zealand (%)
Place of birth for the foreign-born population - Fiji (%)
Place of birth for the foreign-born population - Micronesia (%)
Place of birth for the foreign-born population - Bahamas (%)
Place of birth for the foreign-born population - Barbados (%)
Place of birth for the foreign-born population - Cuba (%)
Place of birth for the foreign-born population - Dominica (%)
Place of birth for the foreign-born population - Dominican Republic (%)
Place of birth for the foreign-born population - Grenada (%)
Place of birth for the foreign-born population - Haiti (%)
Place of birth for the foreign-born population - Jamaica (%)
Place of birth for the foreign-born population - St. Vincent and the Grenadines (%)
Place of birth for the foreign-born population - Trinidad and Tobago (%)
Place of birth for the foreign-born population - West Indies (%)
Place of birth for the foreign-born population - Other Caribbean (%)
Place of birth for the foreign-born population - Belize (%)
Place of birth for the foreign-born population - Costa Rica (%)
Place of birth for the foreign-born population - El Salvador (%)
Place of birth for the foreign-born population - Guatemala (%)
Place of birth for the foreign-born population - Honduras (%)
Place of birth for the foreign-born population - Mexico (%)
Place of birth for the foreign-born population - Nicaragua (%)
Place of birth for the foreign-born population - Panama (%)
Place of birth for the foreign-born population - Other Central America (%)
Place of birth for the foreign-born population - Argentina (%)
Place of birth for the foreign-born population - Bolivia (%)
Place of birth for the foreign-born population - Brazil (%)
Place of birth for the foreign-born population - Chile (%)
Place of birth for the foreign-born population - Colombia (%)
Place of birth for the foreign-born population - Ecuador (%)
Place of birth for the foreign-born population - Guyana (%)
Place of birth for the foreign-born population - Peru (%)
Place of birth for the foreign-born population - Uruguay (%)
Place of birth for the foreign-born population - Venezuela (%)
Place of birth for the foreign-born population - Other South America (%)
Place of birth for the foreign-born population - Canada (%)
Place of birth for the foreign-born population - Other Northern America (%)
Place of birth for the foreign-born population - Other (%)
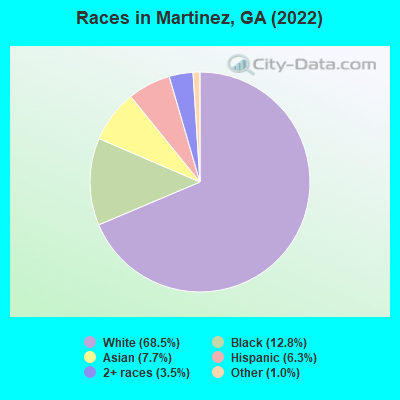
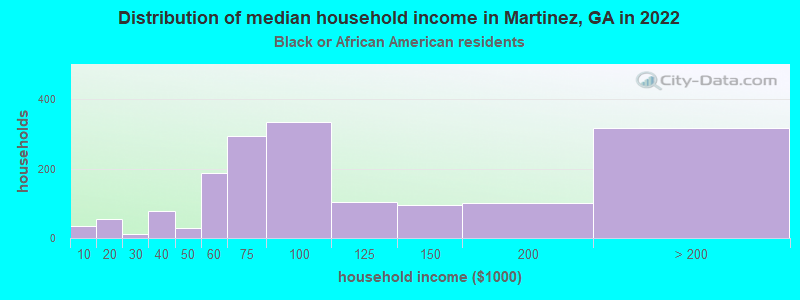
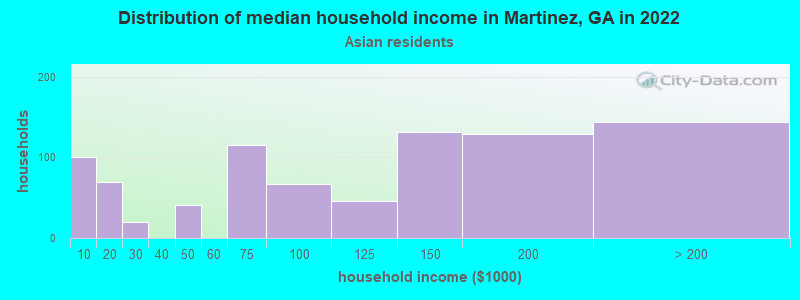
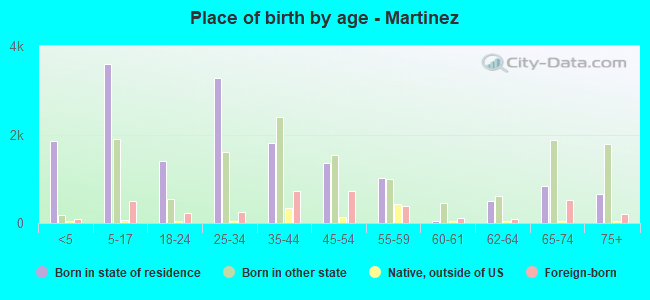
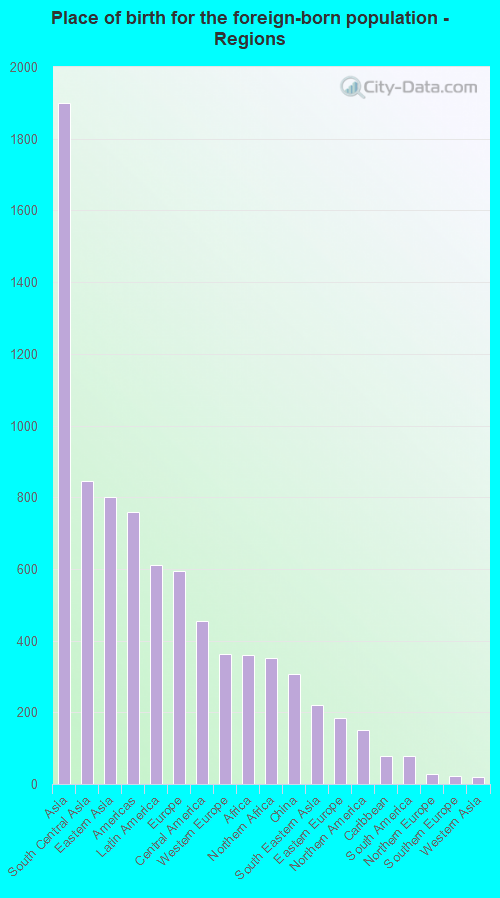
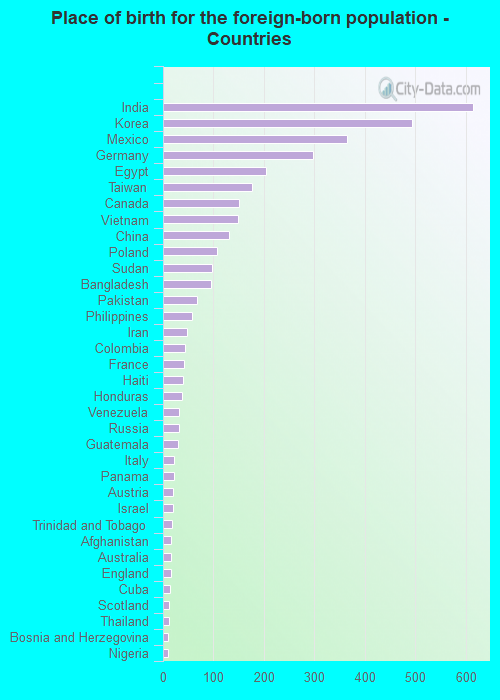
According to 2022 data, the most numerous races in Martinez, GA are White alone (23,935 residents), Black alone (4,473 residents), and Hispanic (2,193 residents). 86.0% of Martinez residents speak English at home. 10.4% of Martinez, GA residents are foreign-born (5.4% born in Asia, 1.7% born in Latin America, 1.7% born in Europe), which is 3.8% greater than the foreign-born rate of 10.0% across the entire state of Georgia.
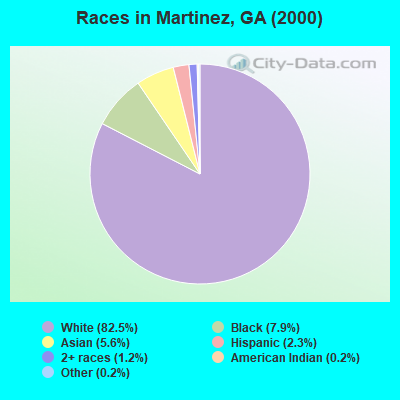
Race distribution in Martinez
2000 2022
5,128,661 62.6% White alone 2,331,465 28.5% Black alone 435,227 5.3% Hispanic 171,513 2.1% Asian alone 87,364 1.1% Two or more races 17,670 0.2% American Indian alone 11,275 0.1% Other race alone 3,278 0.04% Native Hawaiian and Other
5,415,657 49.6% White alone 3,349,240 30.7% Black alone 1,132,604 10.4% Hispanic 479,156 4.4% Asian alone 462,923 4.2% Two or more races 54,416 0.5% Other race alone 11,923 0.1% American Indian alone 6,957 0.06% Native Hawaiian and Other
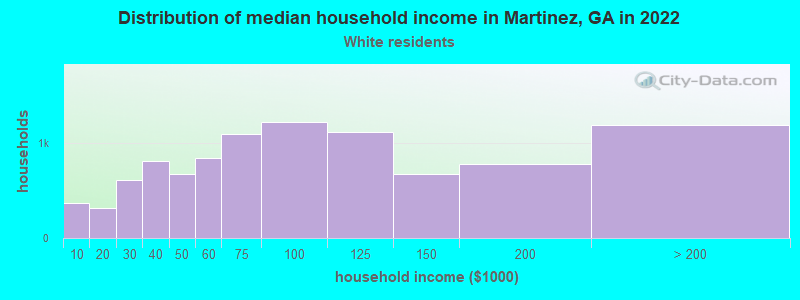
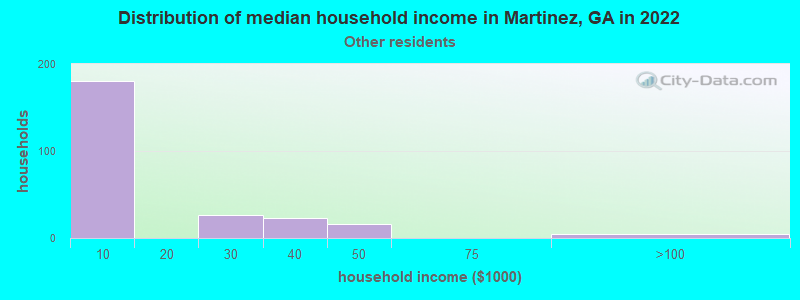
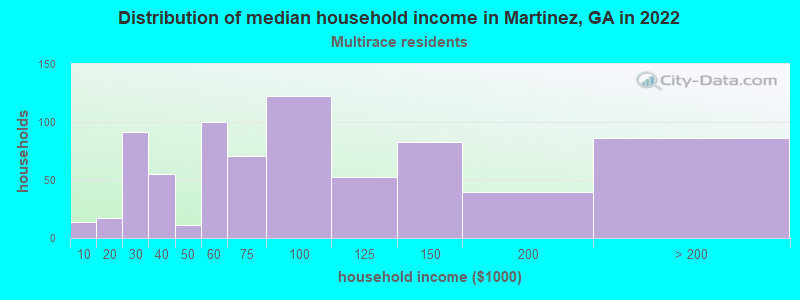
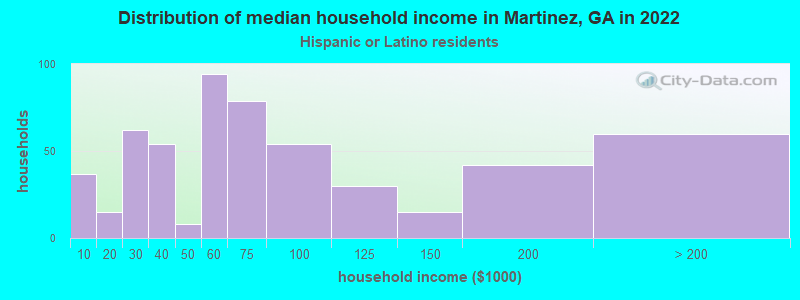
Income and house value in Martinez Median household income in 2022 $80,559 White non-Hispanic householders$95,985 Black householders$136,203 Asian householders$2,658 Some other race householders$72,478 Two or more races householders$43,518 Hispanic or Latino race householdersMedian 2022 house value $237,602 White Non-Hispanic householders$222,851 Black or African American householders$255,303 American Indian or Alaska Native householders $312,037 Asian householders$215,589 Some other race householders$273,912 Two or more races householders$207,193 Hispanic or Latino householders
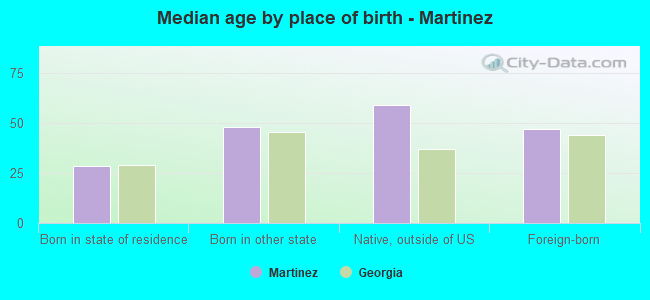
Median age by race in Martinez
41.6 Median age for White residents39.0 44.3 33.3 Median age for Black or African American residents31.3 33.9 -597,462,513.8 Median age for American Indian / Alaska Native residents-597,222,221.6 -597,938,143.7 39.1 Median age for Asian residents31.5 41.0 -666,666,666.0 Median age for Native Hawaiian / Pacific Islander residents-666,666,666.0 -666,666,666.0 46.9 Median age for Other race residents34.2 56.8 32.2 Median age for Two or more races residents30.2 29.0 41.7 Median age for White alone residents39.0 44.0 30.6 Median age for Hispanic or Latino residents26.8 36.1
Owner/renter occupied households by race in Martinez
House owners and renters - White residents 7,199 75.1% Owner occupied2,388 24.9% Renter occupiedHouse owners and renters - Black or African American residents 1,022 57.5% Owner occupied756 42.5% Renter occupiedHouse owners and renters - American Indian / Alaska Native residents 10 100.0% Renter occupiedHouse owners and renters - Asian residents 617 80.7% Owner occupied147 19.3% Renter occupiedHouse owners and renters - Native Hawaiian / Pacific Islander residents 5 100.0% Renter occupiedHouse owners and renters - Other race residents 99 39.3% Owner occupied153 60.7% Renter occupiedHouse owners and renters - Two or more races residents 447 66.5% Owner occupied225 33.5% Renter occupiedHouse owners and renters - White alone residents 6,924 73.7% Owner occupied2,476 26.3% Renter occupiedHouse owners and renters - Hispanic or Latino residents 487 73.5% Owner occupied175 26.5% Renter occupied
Language usage in Martinez
English speakers - Total 86.0% of residents of Martinez speak English at home.
4.1% of residents speak Spanish at home 1,167 87.2% Speak English very well172 12.8% Speak English less than very well10.5% of residents speak other language at home 2,641 76.2% Speak English very well823 23.8% Speak English less than very well
English speakers - Born in the United States 92.1% of residents of Martinez speak English at home.
2.9% of residents speak Spanish at home 377 93.8% Speak English very well25 6.2% Speak English less than very well6.6% of residents speak other language at home 899 100.0% Speak English very well
English speakers - Native, born elsewhere 78.9% of residents of Martinez speak English at home.
22.6% of residents speak Spanish at home 196 84.5% Speak English very well36 15.5% Speak English less than very well4.6% of residents speak other language at home 39 83.0% Speak English very well8 17.0% Speak English less than very well
English speakers - Foreign-born 24.3% of residents of Martinez speak English at home.
10.4% of residents speak Spanish at home 259 65.9% Speak English very well134 34.1% Speak English less than very well60.5% of residents speak other language at home 1,409 61.9% Speak English very well868 38.1% Speak English less than very well
White (Caucasian) - Speak only English Native:
96.5% (21,420)Foreign-born:
33.2% (437)
White (Caucasian) - Speak another language Native:
3.5% (774)Foreign-born:
55.7% (734)
Black or African American - Speak only English Native:
97.8% (3,257)Foreign-born:
28.5% (57)
Black or African American - Speak another language Native:
2.1% (72)Foreign-born:
72.2% (145)
Asian - Speak only English Native:
54.5% (458)Foreign-born:
24.4% (411)
Asian - Speak another language Native:
39.3% (331)Foreign-born:
76.0% (1,277)
Other race - Speak another language Native:
29.7% (148)Foreign-born:
100.0% (157)
Two or more races - Speak only English Native:
87.9% (1,918)Foreign-born:
7.1% (20)
Two or more races - Speak another language Native:
12.4% (271)Foreign-born:
92.6% (260)
White alone - Speak only English Native:
98.2% (21,310)Foreign-born:
36.8% (378)
White alone - Speak another language Native:
1.7% (367)Foreign-born:
60.2% (617)
Hispanic or Latino - Speak only English Native:
40.5% (576)Foreign-born:
38.6% (256)
Hispanic or Latino - Speak another language Native:
60.9% (866)Foreign-born:
61.8% (410)
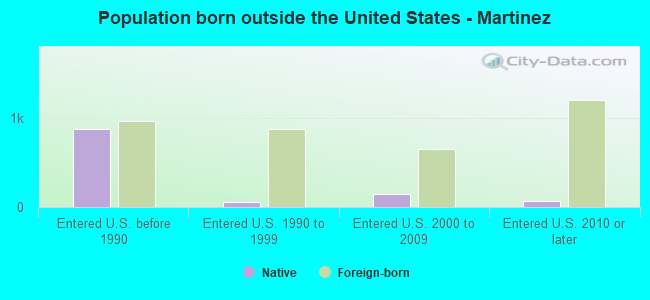
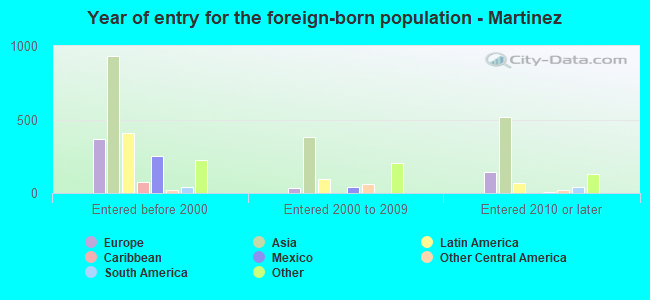
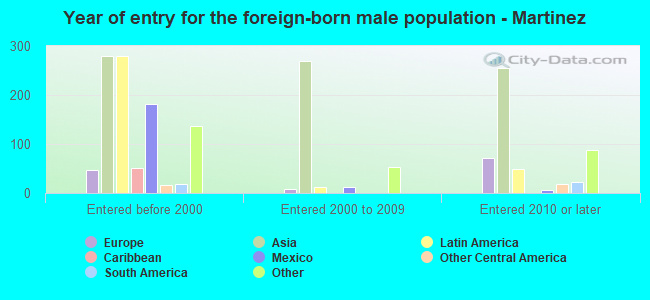
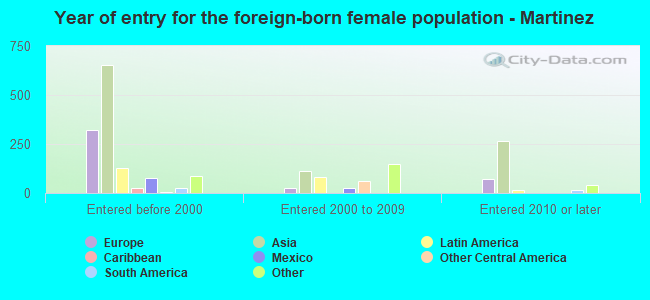
Foreign-born residents in Martinez 3,632 residents are foreign born (5.4% Asia , 1.7% Latin America , 1.7% Europe ).
This city:
10.4%Georgia:
10.4%
Marital status for residents in Martinez Marital status - White (Caucasian) population 15 years and over
Males 30.0% Never married54.7% Now married1.5% Separated2.2% Widowed11.6% DivorcedFemales 26.1% Never married44.4% Now married2.4% Separated9.8% Widowed17.3% DivorcedWomen who gave birth in the past 12 months Now married:
52.5% (127)Unmarried:
47.5% (115)
Women who did not give birth in the past 12 months Now married:
36.4% (2,029)Unmarried:
63.6% (3,552)
Marital status - Black or African American population 15 years and over
Males 30.2% Never married58.2% Now married4.8% Separated0.0% Widowed6.8% DivorcedFemales 47.1% Never married33.2% Now married0.0% Separated5.9% Widowed13.9% DivorcedWomen who gave birth in the past 12 months Now married:
46.0% (26)Unmarried:
54.0% (30)
Women who did not give birth in the past 12 months Now married:
18.4% (194)Unmarried:
81.6% (862)
Marital status - American Indian / Alaska Native population 15 years and over
Males 100.0% Never married0.0% Now married0.0% Separated0.0% Widowed0.0% DivorcedFemales 0.0% Never married100.0% Now married0.0% Separated0.0% Widowed0.0% DivorcedWomen who did not give birth in the past 12 months Now married:
100.0% (13)Unmarried:
0.0% (0)
Marital status - Asian population 15 years and over
Males 23.3% Never married70.4% Now married0.0% Separated0.0% Widowed6.3% DivorcedFemales 18.2% Never married62.4% Now married1.9% Separated10.0% Widowed7.4% DivorcedWomen who gave birth in the past 12 months Now married:
100.0% (50)Unmarried:
0.0% (0)
Women who did not give birth in the past 12 months Now married:
56.0% (373)Unmarried:
44.0% (294)
Marital status - Other race population 15 years and over
Males 48.9% Never married51.1% Now married0.0% Separated0.0% Widowed0.0% DivorcedFemales 5.1% Never married57.2% Now married0.0% Separated0.0% Widowed37.7% DivorcedWomen who did not give birth in the past 12 months Now married:
78.9% (78)Unmarried:
21.1% (21)
Marital status - Two or more races population 15 years and over
Males 53.0% Never married42.4% Now married0.0% Separated0.0% Widowed4.6% DivorcedFemales 48.1% Never married30.8% Now married0.0% Separated0.2% Widowed20.9% DivorcedWomen who gave birth in the past 12 months Now married:
50.0% (18)Unmarried:
50.0% (18)
Women who did not give birth in the past 12 months Now married:
29.9% (212)Unmarried:
70.1% (497)
Marital status - White alone, not Hispanic / Latino population 15 years and over
Males 30.2% Never married53.9% Now married1.6% Separated2.2% Widowed12.2% DivorcedFemales 26.0% Never married43.7% Now married2.5% Separated10.1% Widowed17.7% DivorcedWomen who gave birth in the past 12 months Now married:
50.0% (116)Unmarried:
50.0% (116)
Women who did not give birth in the past 12 months Now married:
35.0% (1,877)Unmarried:
65.0% (3,489)
Marital status - Hispanic or Latino population 15 years and over
Males 32.7% Never married62.8% Now married0.0% Separated2.0% Widowed2.5% DivorcedFemales 17.2% Never married64.1% Now married0.0% Separated0.8% Widowed17.9% DivorcedWomen who gave birth in the past 12 months Now married:
100.0% (13)Unmarried:
0.0% (0)
Women who did not give birth in the past 12 months Now married:
65.6% (317)Unmarried:
34.4% (166)
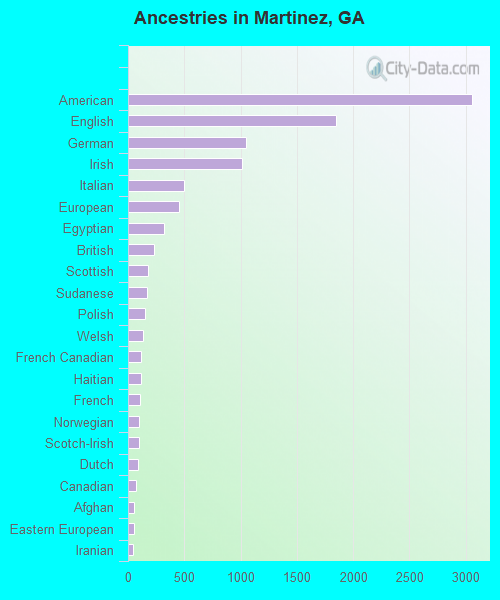
Ancestries in Martinez
3,056 17.4% American1,849 10.6% English1,045 6.0% German1,013 5.8% Irish497 2.8% Italian455 2.6% European319 1.8% Egyptian231 1.3% British176 1.0% Scottish166 0.9% Sudanese153 0.9% Polish129 0.7% Welsh118 0.7% French Canadian113 0.6% Haitian106 0.6% French99 0.6% Norwegian96 0.5% Scotch-Irish88 0.5% Dutch71 0.4% Canadian56 0.3% Afghan49 0.3% Eastern European46 0.3% Iranian25 0.1% Jamaican25 0.1% Trinidadian and Tobagonian22 0.1% Pennsylvania German20 0.1% Russian19 0.1% Hungarian19 0.1% Slovak19 0.1% Ukrainian18 0.1% Finnish17 0.10% Belizean16 0.09% Armenian15 0.09% African14 0.08% Serbian14 0.08% Swiss13 0.07% Nigerian10 0.06% Palestinian9 0.05% Lebanese8 0.05% Swedish8 0.05% West Indian6 0.03% Austrian5 0.03% Portuguese
Geographical mobility in Martinez Same house 1 year ago 21,115 86.1% White (Caucasian)3,614 81.5% Black or African American12 79.6% American Indian / Alaska Native2,044 87.2% Asian6 100.0% Native Hawaiian / Pacific Islander557 62.9% Other race1,841 86.1% Two or more races20,338 85.6% White alone, not Hispanic / Latino1,903 90.8% Hispanic or LatinoMoved within same county 866 3.5% White / Caucasian111 2.5% Black or African American3 17.8% American Indian / Alaska Native38 1.6% Asian28 3.2% Other race163 7.6% Two or more races883 3.7% White alone, not Hispanic / Latino36 1.7% Hispanic or LatinoMoved within same state 909 3.7% White / Caucasian276 6.2% Black or African American84 3.6% Asian251 28.4% Other race111 5.2% Two or more races897 3.8% White alone, not Hispanic / Latino36 1.7% Hispanic or LatinoMoved from different state 1,427 5.8% White / Caucasian44 1.0% Black or African American111 4.7% Asian74 8.4% Other race16 0.7% Two or more races1,452 6.1% White alone, not Hispanic / Latino57 2.7% Hispanic or LatinoMoved from abroad 105 0.4% White85 3.6% Asian18 0.8% Two or more races73 0.3% White alone, not Hispanic / Latino61 2.9% Hispanic or Latino
Children Nativity (place of birth) in Martinez
Children under 6 years - Living with two parents Both parents native 1,533 100.0% NativeBoth parents foreign-born 57 51.3% Native54 48.7% Foreign-bornOne native, one foreign-born parent 89 100.0% NativeChildren under 6 years - Living with one parent Native parent 768 100.0% NativeForeign-born parent 46 63.8% Native26 36.2% Foreign-bornChildren 6 to 17 years - Living with two parents Both parents native 2,399 100.0% NativeBoth parents foreign-born 382 77.6% Native110 22.4% Foreign-bornOne native, one foreign-born parent 174 100.0% NativeChildren 6 to 17 years - Living with one parent Native parent 1,858 97.6% Native45 2.4% Foreign-bornForeign-born parent 273 70.5% Native114 29.5% Foreign-born
Grandparents responsible for own grandchildren in Martinez
Grandparents (30 to 59 years) White / Caucasian 61 5.6% Responsible for grandchildren1,011 94.4% Not responsible for grandchildrenBlack or African American 169 100.0% Responsible for grandchildrenWhite alone, not Hispanic / Latino 66 6.1% Responsible for grandchildren1,011 93.9% Not responsible for grandchildrenGrandparents (60 years and over) White / Caucasian 136 44.1% Responsible for grandchildren172 55.9% Not responsible for grandchildrenBlack or African American 40 100.0% Responsible for grandchildrenWhite alone, not Hispanic / Latino 144 45.6% Responsible for grandchildren172 54.4% Not responsible for grandchildren