Races in Masonboro, North Carolina (NC) Detailed Stats
Ancestries, Foreign-born residents, place of birth

Recent posts about races in Masonboro, North Carolina on our local forum with over 2,400,000 registered users:
 | Should we live in Wilmington or Hampstead? (2 replies) |
| Relocating to Wilmington area (14 replies) |
| 4 days of Wilmington house hunting... (16 replies) |
| Wilmington - Landsdowne estates (6 replies) |
| Safe, walkable areas outside the city? (5 replies) |
| Wilmington vs. Carolina Beach relocation (15 replies) |
3.4% of Masonboro, NC residents are foreign-born (1.2% born in Europe, 0.7% born in Asia, 0.6% born in North America, 0.5% born in Africa), which is 137.4% less than the foreign-born rate of 8.0% across the entire state of North Carolina.
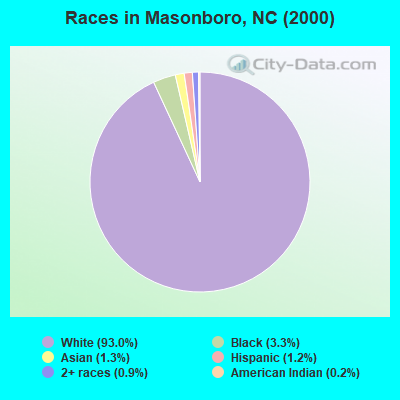
Race distribution in Masonboro

- 10,99193.0%White alone
- 3873.3%Black alone
- 1561.3%Asian alone
- 1381.2%Hispanic
- 1060.9%Two or more races
- 290.2%American Indian alone
- 30.03%Other race alone
- 20.02%Native Hawaiian and Other
Pacific Islander alone
2000
2022
-
- 5,647,15570.2%White alone
- 1,723,30121.4%Black alone
- 378,9634.7%Hispanic
- 112,4161.4%Asian alone
- 95,3331.2%American Indian alone
- 79,9651.0%Two or more races
- 9,0150.1%Other race alone
- 3,1650.04%Native Hawaiian and Other
Pacific Islander alone

-
- 6,497,51960.7%White alone
- 2,155,65020.1%Black alone
- 1,114,79910.4%Hispanic
- 438,0614.1%Two or more races
- 341,0523.2%Asian alone
- 91,7580.9%American Indian alone
- 50,1800.5%Other race alone
- 9,9540.09%Native Hawaiian and Other
Pacific Islander alone

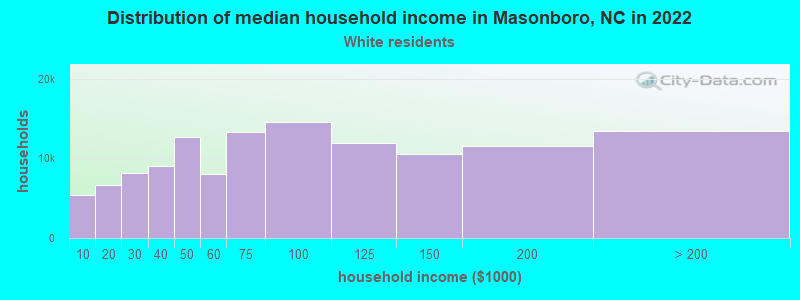
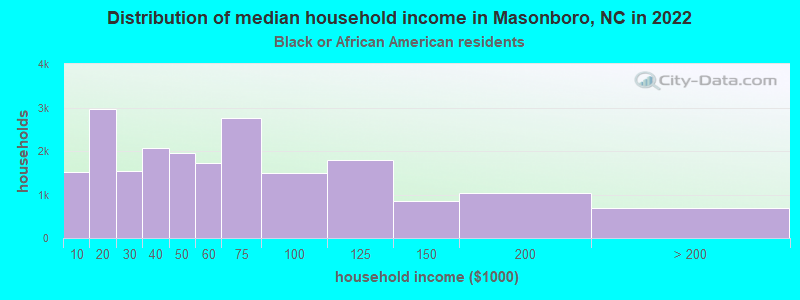
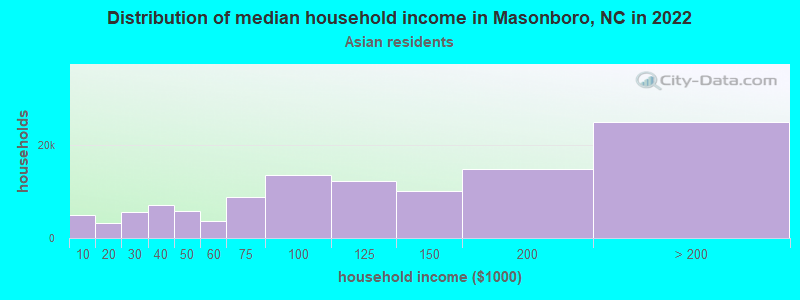
Income and house value in Masonboro
- Median household income in 2022
- $112,845White non-Hispanic householders
- $86,568Black householders
- $151,168Asian householders
- $89,342Two or more races householders
- $143,620Hispanic or Latino race householders
- Median 2022 house value
- $471,773White Non-Hispanic householders
- $405,488Black or African American householders
- $540,363Asian householders
- $468,315Two or more races householders
- $468,315Hispanic or Latino householders
Household income for White non-Hispanic householders
Household income for Black householders
Household income for Asian householders
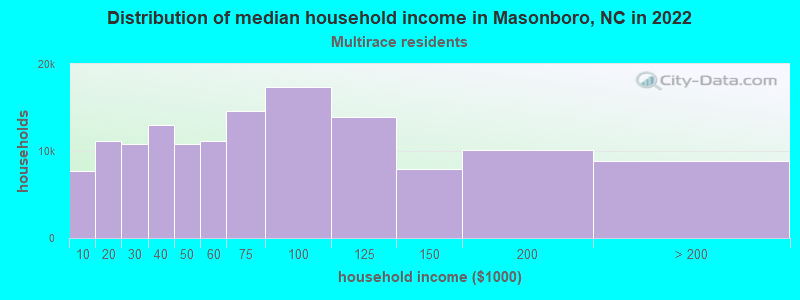
Household income for Two or more races householders
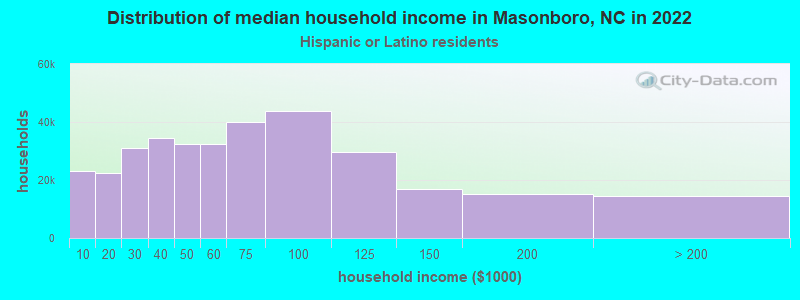
Household income for Hispanic or Latino race householders
Foreign-born residents in Masonboro
398 residents are foreign born (1.2% Europe, 0.7% Asia, 0.6% North America, 0.5% Africa).
| This city: | 3.4% |
| North Carolina: | 5.3% |
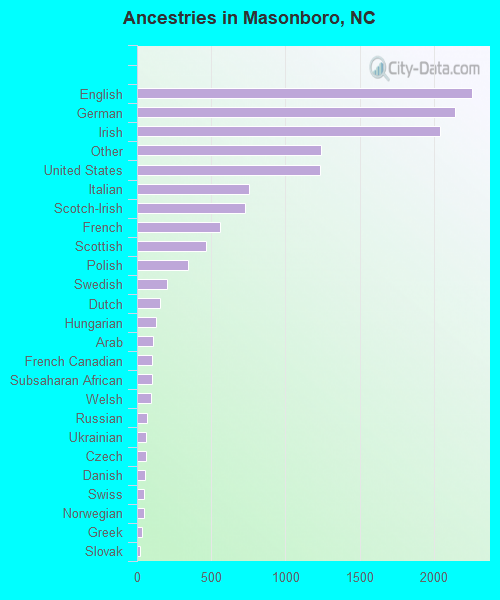
Ancestries in Masonboro

- 2,25917.3%English
- 2,14316.4%German
- 2,04515.6%Irish
- 1,2429.5%Other
- 1,2319.4%United States
- 7555.8%Italian
- 7255.5%Scotch-Irish
- 5604.3%French
- 4673.6%Scottish
- 3472.7%Polish
- 1991.5%Swedish
- 1531.2%Dutch
- 1271.0%Hungarian
- 1080.8%Arab
- 1020.8%French Canadian
- 1010.8%Subsaharan African
- 970.7%Welsh
- 700.5%Russian
- 620.5%Ukrainian
- 610.5%Czech
- 510.4%Danish
- 450.3%Swiss
- 440.3%Norwegian
- 370.3%Greek
- 220.2%Slovak
- 170.1%Lithuanian
Zip codes: 28409.