Races in Mays Landing, New Jersey (NJ) Detailed Stats
Data:
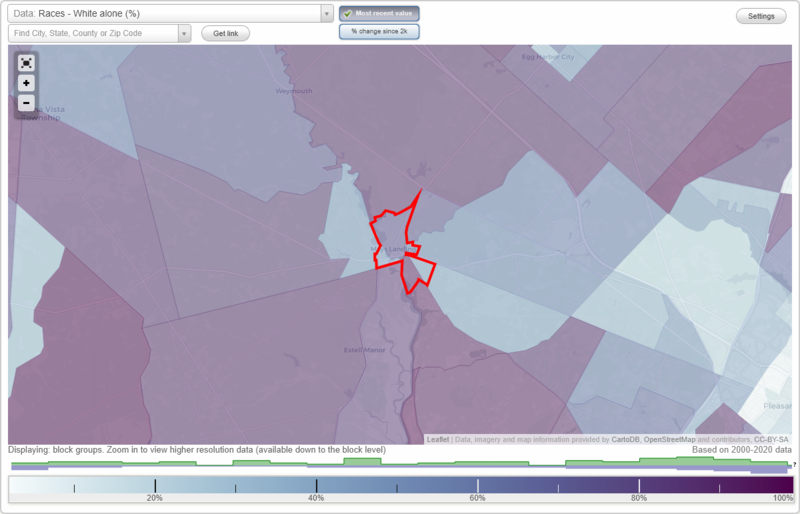
Races - White alone (%)
Races - White alone (% change since 2000)
Races - Black alone (%)
Races - Black alone (% change since 2000)
Races - American Indian alone (%)
Races - American Indian alone (% change since 2000)
Races - Asian alone (%)
Races - Asian alone (% change since 2000)
Races - Hispanic (%)
Races - Hispanic (% change since 2000)
Races - Native Hawaiian and Other Pacific Islander alone (%)
Races - Native Hawaiian and Other Pacific Islander alone (% change since 2000)
Races - Two or more races(%)
Races - Two or more races(% change since 2000)
Races - Other race alone (%)
Races - Other race alone (% change since 2000)
Racial diversity
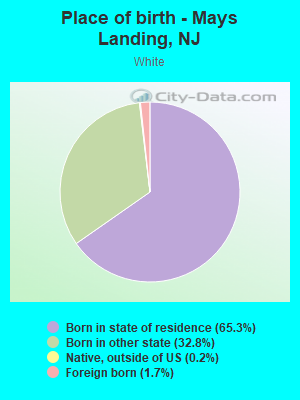
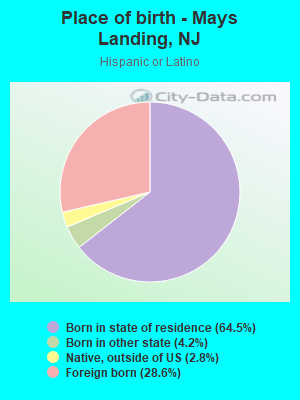
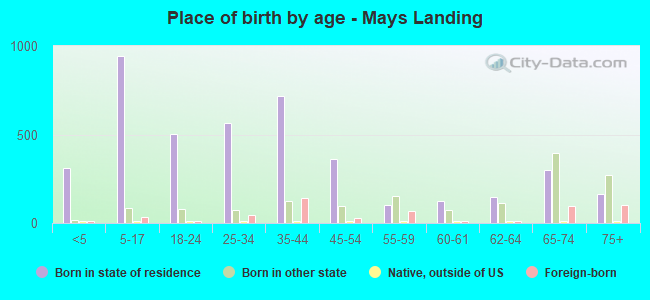
Place of birth - Born in state of residence (%)
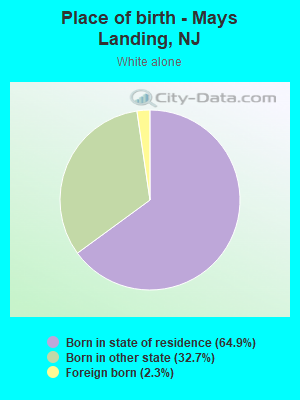
Place of birth - Born in state of residence (%) - White
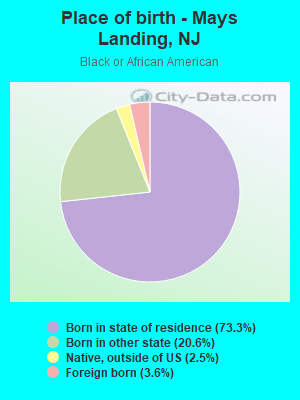
Place of birth - Born in state of residence (%) - Black or African American
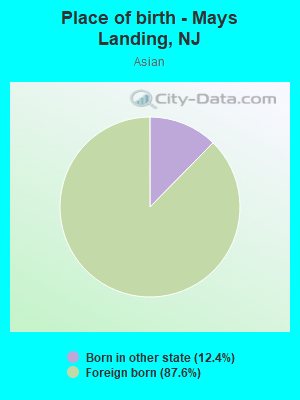
Place of birth - Born in state of residence (%) - Asian
Place of birth - Born in state of residence (%) - Hispanic or Latino
Place of birth - Born in state of residence (%) - American Indian and Alaska Native
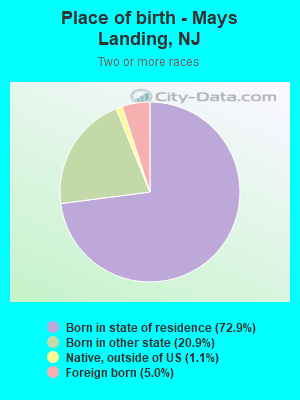
Place of birth - Born in state of residence (%) - Multirace
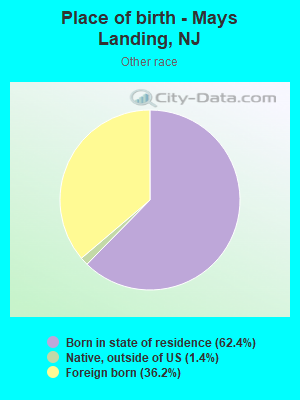
Place of birth - Born in state of residence (%) - Other Race
Place of birth - Born in other state (%)
Place of birth - Born in other state (%) - White
Place of birth - Born in other state (%) - Black or African American
Place of birth - Born in other state (%) - Asian
Place of birth - Born in other state (%) - Hispanic or Latino
Place of birth - Born in other state (%) - American Indian and Alaska Native
Place of birth - Born in other state (%) - Multirace
Place of birth - Born in other state (%) - Other Race
Place of birth - Native, outside of US (%)
Place of birth - Native, outside of US (%) - White
Place of birth - Native, outside of US (%) - Black or African American
Place of birth - Native, outside of US (%) - Asian
Place of birth - Native, outside of US (%) - Hispanic or Latino
Place of birth - Native, outside of US (%) - American Indian and Alaska Native
Place of birth - Native, outside of US (%) - Multirace
Place of birth - Native, outside of US (%) - Other Race
Place of birth - Foreign born (%)
Place of birth - Foreign born (%) - White
Place of birth - Foreign born (%) - Black or African American
Place of birth - Foreign born (%) - Asian
Place of birth - Foreign born (%) - Hispanic or Latino
Place of birth - Foreign born (%) - American Indian and Alaska Native
Place of birth - Foreign born (%) - Multirace
Place of birth - Foreign born (%) - Other Race
Residents speaking English at home (%)
Residents speaking English at home - Born in the United States (%)
Residents speaking English at home - Native, born elsewhere (%)
Residents speaking English at home - Foreign born (%)
Residents speaking Spanish at home (%)
Residents speaking Spanish at home - Born in the United States (%)
Residents speaking Spanish at home - Native, born elsewhere (%)
Residents speaking Spanish at home - Foreign born (%)
Residents speaking other language at home (%)
Residents speaking other language at home - Born in the United States (%)
Residents speaking other language at home - Native, born elsewhere (%)
Residents speaking other language at home - Foreign born (%)
Marital status - Never married (%)
Marital status - Now married (%)
Marital status - Separated (%)
Marital status - Widowed (%)
Marital status - Divorced (%)
Ancestries Reported - Arab (%)
Ancestries Reported - Czech (%)
Ancestries Reported - Danish (%)
Ancestries Reported - Dutch (%)
Ancestries Reported - English (%)
Ancestries Reported - French (%)
Ancestries Reported - French Canadian (%)
Ancestries Reported - German (%)
Ancestries Reported - Greek (%)
Ancestries Reported - Hungarian (%)
Ancestries Reported - Irish (%)
Ancestries Reported - Italian (%)
Ancestries Reported - Lithuanian (%)
Ancestries Reported - Norwegian (%)
Ancestries Reported - Polish (%)
Ancestries Reported - Portuguese (%)
Ancestries Reported - Russian (%)
Ancestries Reported - Scotch-Irish (%)
Ancestries Reported - Scottish (%)
Ancestries Reported - Slovak (%)
Ancestries Reported - Subsaharan African (%)
Ancestries Reported - Swedish (%)
Ancestries Reported - Swiss (%)
Ancestries Reported - Ukrainian (%)
Ancestries Reported - United States (%)
Ancestries Reported - Welsh (%)
Ancestries Reported - West Indian (%)
Ancestries Reported - Other (%)
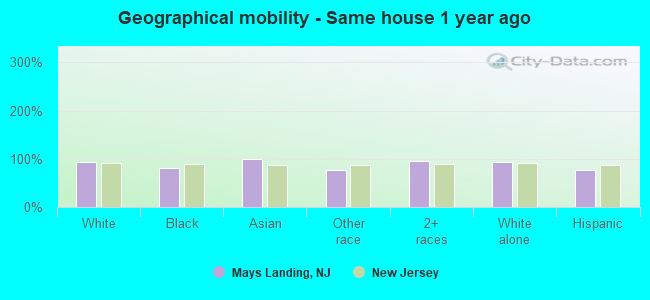
Geographical mobility - Same house 1 year ago (%)
Geographical mobility - Same house 1 year ago (%) - White
Geographical mobility - Same house 1 year ago (%) - Black or African American
Geographical mobility - Same house 1 year ago (%) - Asian
Geographical mobility - Same house 1 year ago (%) - Hispanic or Latino
Geographical mobility - Same house 1 year ago (%) - American Indian and Alaska Native
Geographical mobility - Same house 1 year ago (%) - Multirace
Geographical mobility - Same house 1 year ago (%) - Other Race
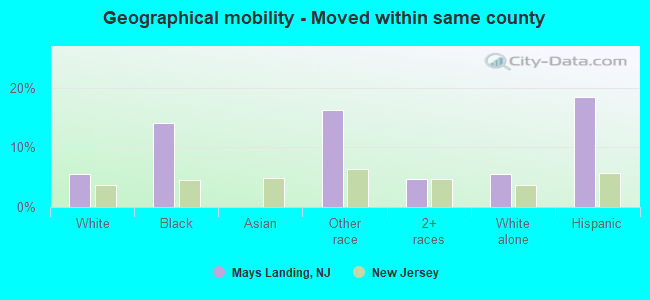
Geographical mobility - Moved within same county (%)
Geographical mobility - Moved within same county (%) - White
Geographical mobility - Moved within same county (%) - Black or African American
Geographical mobility - Moved within same county (%) - Asian
Geographical mobility - Moved within same county (%) - Hispanic or Latino
Geographical mobility - Moved within same county (%) - American Indian and Alaska Native
Geographical mobility - Moved within same county (%) - Multirace
Geographical mobility - Moved within same county (%) - Other Race
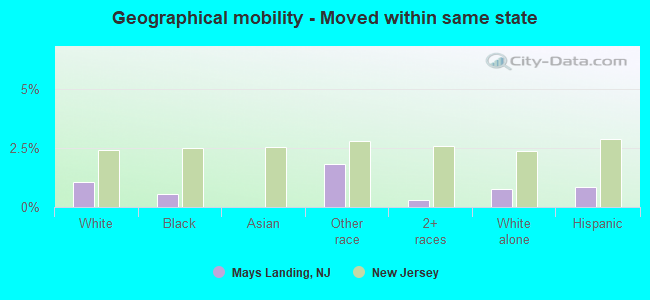
Geographical mobility - Moved from different county within same state (%)
Geographical mobility - Moved from different county within same state (%) - White
Geographical mobility - Moved from different county within same state (%) - Black or African American
Geographical mobility - Moved from different county within same state (%) - Asian
Geographical mobility - Moved from different county within same state (%) - Hispanic or Latino
Geographical mobility - Moved from different county within same state (%) - American Indian and Alaska Native
Geographical mobility - Moved from different county within same state (%) - Multirace
Geographical mobility - Moved from different county within same state (%) - Other Race
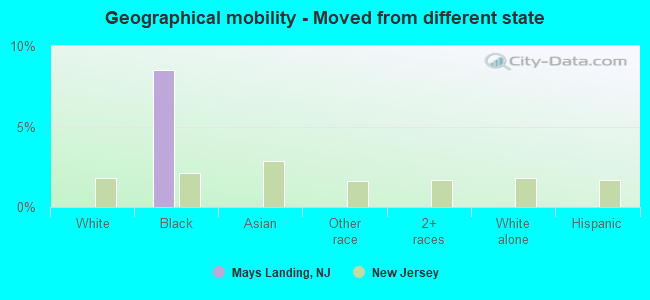
Geographical mobility - Moved from different state (%)
Geographical mobility - Moved from different state (%) - White
Geographical mobility - Moved from different state (%) - Black or African American
Geographical mobility - Moved from different state (%) - Asian
Geographical mobility - Moved from different state (%) - Hispanic or Latino
Geographical mobility - Moved from different state (%) - American Indian and Alaska Native
Geographical mobility - Moved from different state (%) - Multirace
Geographical mobility - Moved from different state (%) - Other Race
Geographical mobility - Moved from abroad (%)
Geographical mobility - Moved from abroad (%) - White
Geographical mobility - Moved from abroad (%) - Black or African American
Geographical mobility - Moved from abroad (%) - Asian
Geographical mobility - Moved from abroad (%) - Hispanic or Latino
Geographical mobility - Moved from abroad (%) - American Indian and Alaska Native
Geographical mobility - Moved from abroad (%) - Multirace
Geographical mobility - Moved from abroad (%) - Other Race
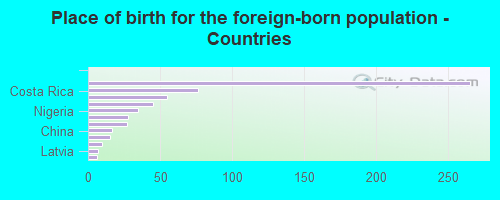
Place of birth for the foreign-born population - Ireland (%)
Place of birth for the foreign-born population - Denmark (%)
Place of birth for the foreign-born population - Norway (%)
Place of birth for the foreign-born population - Sweden (%)
Place of birth for the foreign-born population - United Kingdom (%)
Place of birth for the foreign-born population - England (%)
Place of birth for the foreign-born population - Scotland (%)
Place of birth for the foreign-born population - Other Northern Europe (%)
Place of birth for the foreign-born population - Austria (%)
Place of birth for the foreign-born population - Belgium (%)
Place of birth for the foreign-born population - France (%)
Place of birth for the foreign-born population - Germany (%)
Place of birth for the foreign-born population - Netherlands (%)
Place of birth for the foreign-born population - Switzerland (%)
Place of birth for the foreign-born population - Other Western Europe (%)
Place of birth for the foreign-born population - Greece (%)
Place of birth for the foreign-born population - Italy (%)
Place of birth for the foreign-born population - Portugal (%)
Place of birth for the foreign-born population - Spain (%)
Place of birth for the foreign-born population - Other Southern Europe (%)
Place of birth for the foreign-born population - Albania (%)
Place of birth for the foreign-born population - Belarus (%)
Place of birth for the foreign-born population - Bosnia and Herzegovina (%)
Place of birth for the foreign-born population - Bulgaria (%)
Place of birth for the foreign-born population - Croatia (%)
Place of birth for the foreign-born population - Czechoslovakia (%)
Place of birth for the foreign-born population - Hungary (%)
Place of birth for the foreign-born population - Latvia (%)
Place of birth for the foreign-born population - Lithuania (%)
Place of birth for the foreign-born population - North Macedonia (Macedonia) (%)
Place of birth for the foreign-born population - Moldova (%)
Place of birth for the foreign-born population - Poland (%)
Place of birth for the foreign-born population - Romania (%)
Place of birth for the foreign-born population - Russia (%)
Place of birth for the foreign-born population - Serbia (%)
Place of birth for the foreign-born population - Ukraine (%)
Place of birth for the foreign-born population - Other Eastern Europe (%)
Place of birth for the foreign-born population - China (%)
Place of birth for the foreign-born population - Hong Kong (%)
Place of birth for the foreign-born population - Taiwan (%)
Place of birth for the foreign-born population - Japan (%)
Place of birth for the foreign-born population - Korea (%)
Place of birth for the foreign-born population - Other Eastern Asia (%)
Place of birth for the foreign-born population - Afghanistan (%)
Place of birth for the foreign-born population - Bangladesh (%)
Place of birth for the foreign-born population - India (%)
Place of birth for the foreign-born population - Iran (%)
Place of birth for the foreign-born population - Kazakhstan (%)
Place of birth for the foreign-born population - Nepal (%)
Place of birth for the foreign-born population - Pakistan (%)
Place of birth for the foreign-born population - Sri Lanka (%)
Place of birth for the foreign-born population - Uzbekistan (%)
Place of birth for the foreign-born population - Other South Central Asia (%)
Place of birth for the foreign-born population - Burma (%)
Place of birth for the foreign-born population - Cambodia (%)
Place of birth for the foreign-born population - Indonesia (%)
Place of birth for the foreign-born population - Laos (%)
Place of birth for the foreign-born population - Malaysia (%)
Place of birth for the foreign-born population - Philippines (%)
Place of birth for the foreign-born population - Singapore (%)
Place of birth for the foreign-born population - Thailand (%)
Place of birth for the foreign-born population - Vietnam (%)
Place of birth for the foreign-born population - Other South Eastern Asia (%)
Place of birth for the foreign-born population - Armenia (%)
Place of birth for the foreign-born population - Iraq (%)
Place of birth for the foreign-born population - Israel (%)
Place of birth for the foreign-born population - Jordan (%)
Place of birth for the foreign-born population - Kuwait (%)
Place of birth for the foreign-born population - Lebanon (%)
Place of birth for the foreign-born population - Saudi Arabia (%)
Place of birth for the foreign-born population - Syria (%)
Place of birth for the foreign-born population - Turkey (%)
Place of birth for the foreign-born population - Yemen (%)
Place of birth for the foreign-born population - Other Western Asia (%)
Place of birth for the foreign-born population - Eritrea (%)
Place of birth for the foreign-born population - Ethiopia (%)
Place of birth for the foreign-born population - Kenya (%)
Place of birth for the foreign-born population - Somalia (%)
Place of birth for the foreign-born population - Uganda (%)
Place of birth for the foreign-born population - Zimbabwe (%)
Place of birth for the foreign-born population - Other Eastern Africa (%)
Place of birth for the foreign-born population - Cameroon (%)
Place of birth for the foreign-born population - Congo (%)
Place of birth for the foreign-born population - Democratic Republic of Congo (Zaire) (%)
Place of birth for the foreign-born population - Other Middle Africa (%)
Place of birth for the foreign-born population - Egypt (%)
Place of birth for the foreign-born population - Morocco (%)
Place of birth for the foreign-born population - Sudan (%)
Place of birth for the foreign-born population - Other Northern Africa (%)
Place of birth for the foreign-born population - South Africa (%)
Place of birth for the foreign-born population - Other Southern Africa (%)
Place of birth for the foreign-born population - Cabo Verde (%)
Place of birth for the foreign-born population - Ghana (%)
Place of birth for the foreign-born population - Liberia (%)
Place of birth for the foreign-born population - Nigeria (%)
Place of birth for the foreign-born population - Senegal (%)
Place of birth for the foreign-born population - Sierra Leone (%)
Place of birth for the foreign-born population - Other Western Africa (%)
Place of birth for the foreign-born population - Australia (%)
Place of birth for the foreign-born population - New Zealand (%)
Place of birth for the foreign-born population - Fiji (%)
Place of birth for the foreign-born population - Micronesia (%)
Place of birth for the foreign-born population - Bahamas (%)
Place of birth for the foreign-born population - Barbados (%)
Place of birth for the foreign-born population - Cuba (%)
Place of birth for the foreign-born population - Dominica (%)
Place of birth for the foreign-born population - Dominican Republic (%)
Place of birth for the foreign-born population - Grenada (%)
Place of birth for the foreign-born population - Haiti (%)
Place of birth for the foreign-born population - Jamaica (%)
Place of birth for the foreign-born population - St. Vincent and the Grenadines (%)
Place of birth for the foreign-born population - Trinidad and Tobago (%)
Place of birth for the foreign-born population - West Indies (%)
Place of birth for the foreign-born population - Other Caribbean (%)
Place of birth for the foreign-born population - Belize (%)
Place of birth for the foreign-born population - Costa Rica (%)
Place of birth for the foreign-born population - El Salvador (%)
Place of birth for the foreign-born population - Guatemala (%)
Place of birth for the foreign-born population - Honduras (%)
Place of birth for the foreign-born population - Mexico (%)
Place of birth for the foreign-born population - Nicaragua (%)
Place of birth for the foreign-born population - Panama (%)
Place of birth for the foreign-born population - Other Central America (%)
Place of birth for the foreign-born population - Argentina (%)
Place of birth for the foreign-born population - Bolivia (%)
Place of birth for the foreign-born population - Brazil (%)
Place of birth for the foreign-born population - Chile (%)
Place of birth for the foreign-born population - Colombia (%)
Place of birth for the foreign-born population - Ecuador (%)
Place of birth for the foreign-born population - Guyana (%)
Place of birth for the foreign-born population - Peru (%)
Place of birth for the foreign-born population - Uruguay (%)
Place of birth for the foreign-born population - Venezuela (%)
Place of birth for the foreign-born population - Other South America (%)
Place of birth for the foreign-born population - Canada (%)
Place of birth for the foreign-born population - Other Northern America (%)
Place of birth for the foreign-born population - Other (%)
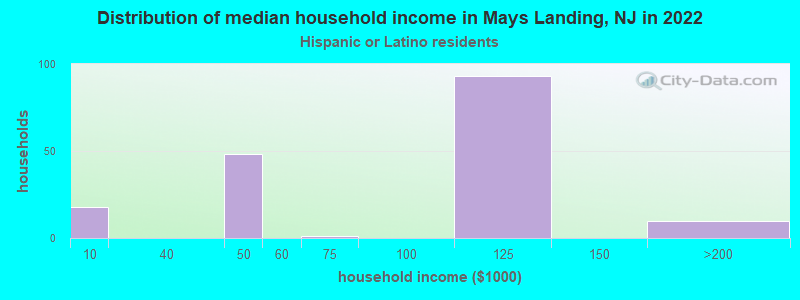
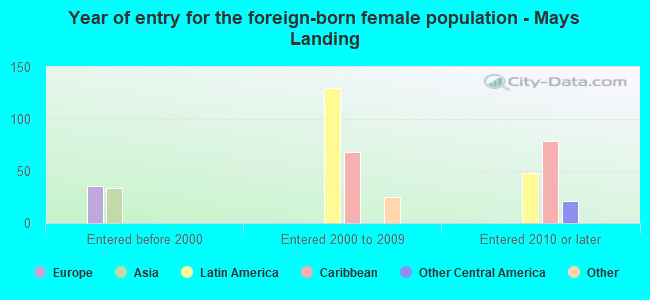
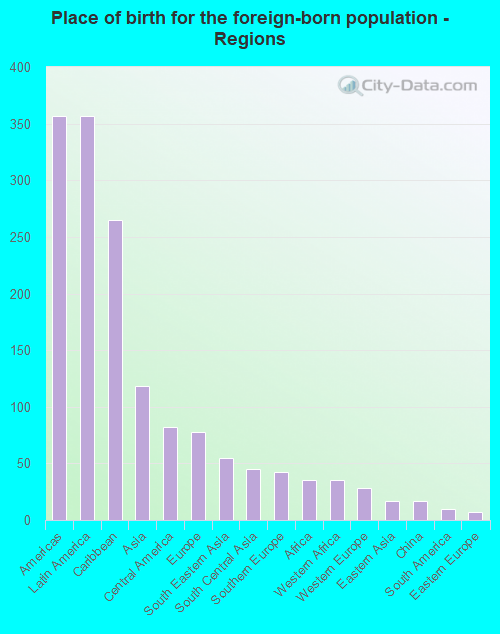
According to 2022 data, the most numerous races in Mays Landing, NJ are White alone (3,455 residents), Hispanic (1,016 residents), and Black alone (781 residents). 86.2% of Mays Landing residents speak English at home. 9.5% of Mays Landing, NJ residents are foreign-born (5.7% born in Latin America, 1.9% born in Asia, 1.2% born in Europe), which is 142.2% less than the foreign-born rate of 23.0% across the entire state of New Jersey.
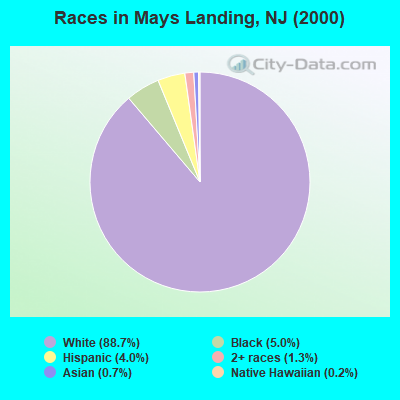
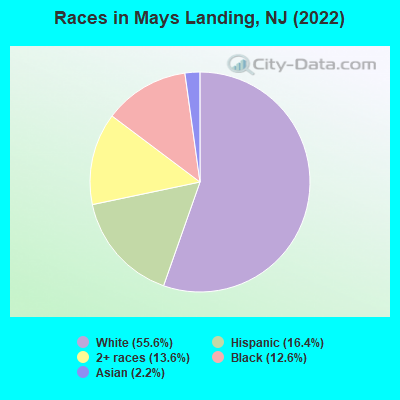
Race distribution in Mays Landing
2000 2022
5,557,209 66.0% White alone 1,117,191 13.3% Hispanic 1,096,171 13.0% Black alone 477,012 5.7% Asian alone 133,689 1.6% Two or more races 19,565 0.2% Other race alone 11,338 0.1% American Indian alone 2,175 0.03% Native Hawaiian and Other
4,766,476 51.5% White alone 2,028,470 21.9% Hispanic 1,111,632 12.0% Black alone 923,546 10.0% Asian alone 332,237 3.6% Two or more races 89,847 1.0% Other race alone 8,557 0.09% American Indian alone 934 0.01% Native Hawaiian and Other
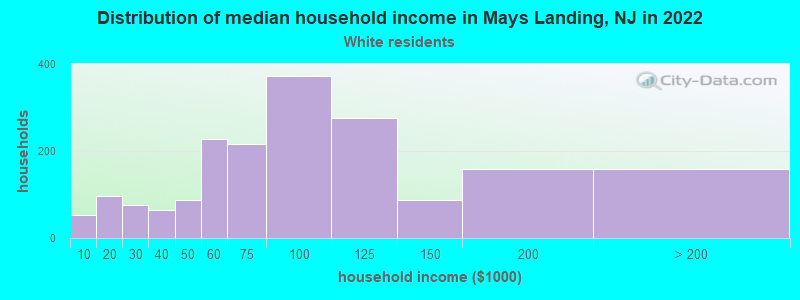
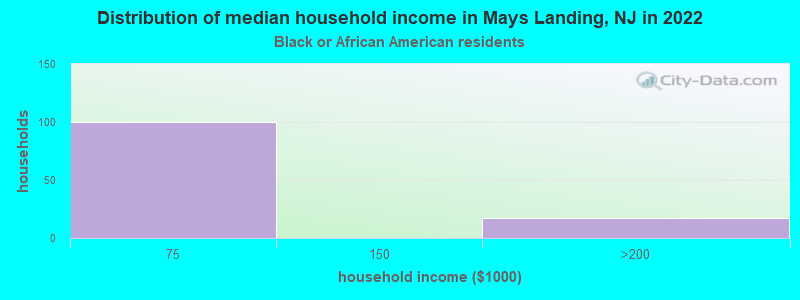
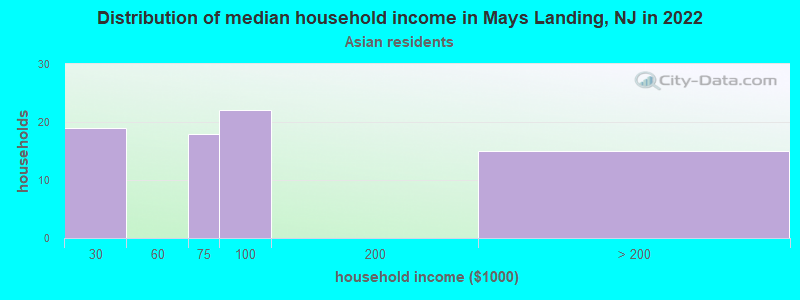
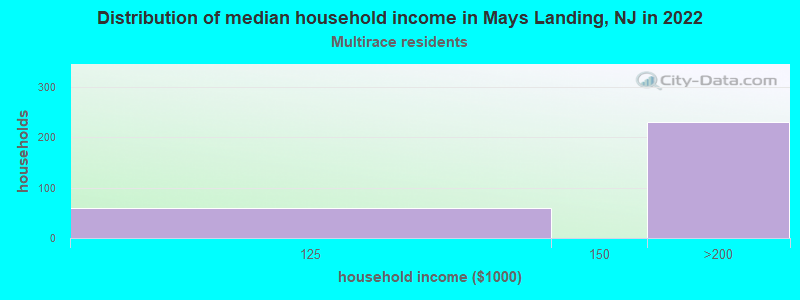
Income and house value in Mays Landing Median household income in 2022 $83,035 White non-Hispanic householders$85,443 Black householders$56,602 Asian householdersover $200,000 Two or more races householdersMedian 2022 house value $269,164 White Non-Hispanic householders$344,600 Two or more races householders$344,600 Hispanic or Latino householders
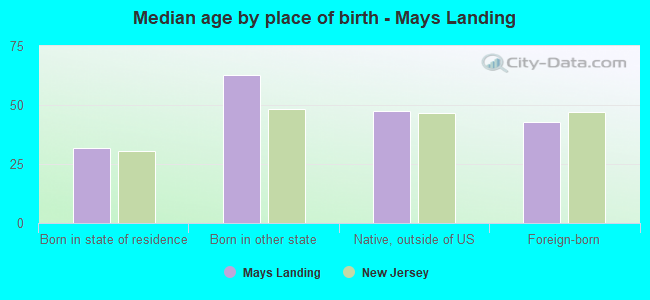
Median age by race in Mays Landing
55.9 Median age for White residents51.8 58.3 40.4 Median age for Black or African American residents38.9 27.6 -650,046,167.4 Median age for American Indian / Alaska Native residents-590,299,277.0 -877,192,981.6 77.5 Median age for Asian residents67.3 84.6 -804,177,544.9 Median age for Native Hawaiian / Pacific Islander residents-860,335,194.7 -713,070,378.3 16.7 Median age for Other race residents12.1 36.8 18.2 Median age for Two or more races residents13.7 22.7 54.8 Median age for White alone residents52.0 56.3 18.4 Median age for Hispanic or Latino residents16.5 35.9
Owner/renter occupied households by race in Mays Landing
House owners and renters - White residents 1,413 74.9% Owner occupied475 25.1% Renter occupiedHouse owners and renters - Black or African American residents 97 100.0% Owner occupiedHouse owners and renters - Asian residents 90 100.0% Owner occupiedHouse owners and renters - Other race residents 83 52.0% Owner occupied77 48.0% Renter occupiedHouse owners and renters - Two or more races residents 207 100.0% Owner occupiedHouse owners and renters - White alone residents 1,432 74.7% Owner occupied485 25.3% Renter occupiedHouse owners and renters - Hispanic or Latino residents 102 54.3% Owner occupied86 45.7% Renter occupied
Language usage in Mays Landing
English speakers - Total 86.2% of residents of Mays Landing speak English at home.
10.0% of residents speak Spanish at home 449 76.2% Speak English very well140 23.8% Speak English less than very well3.6% of residents speak other language at home 165 78.6% Speak English very well45 21.4% Speak English less than very well
All residents speak only English at home
English speakers - Native, born elsewhere 0.0% of residents of Mays Landing speak English at home.
81.4% of residents speak Spanish at home 22 62.9% Speak English very well13 37.1% Speak English less than very well
English speakers - Foreign-born 8.8% of residents of Mays Landing speak English at home.
48.3% of residents speak Spanish at home 148 57.1% Speak English very well111 42.9% Speak English less than very well31.2% of residents speak other language at home 126 75.4% Speak English very well41 24.6% Speak English less than very well
White (Caucasian) - Speak only English Native:
100.0% (3,255)Foreign-born:
29.0% (17)
White (Caucasian) - Speak another language Native:
1.1% (36)Foreign-born:
72.3% (42)
Black or African American - Speak another language Native:
1.2% (9)Foreign-born:
100.0% (30)
Asian - Speak only English Native:
84.6% (15)Foreign-born:
25.0% (29)
Other race - Speak another language Native:
69.0% (234)Foreign-born:
97.5% (289)
Two or more races - Speak another language Native:
9.3% (102)Foreign-born:
94.7% (64)
White alone - Speak only English Native:
98.7% (3,257)Foreign-born:
22.0% (18)
White alone - Speak another language Native:
1.4% (45)Foreign-born:
77.9% (62)
Hispanic or Latino - Speak another language Native:
46.6% (274)Foreign-born:
97.9% (298)
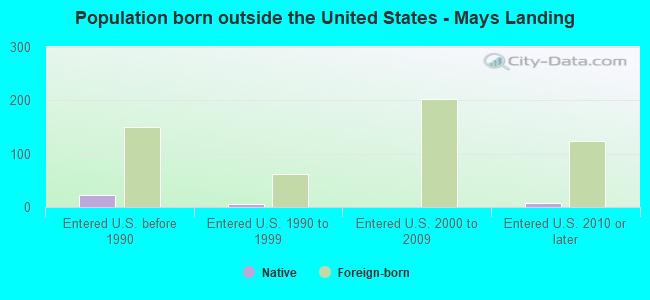
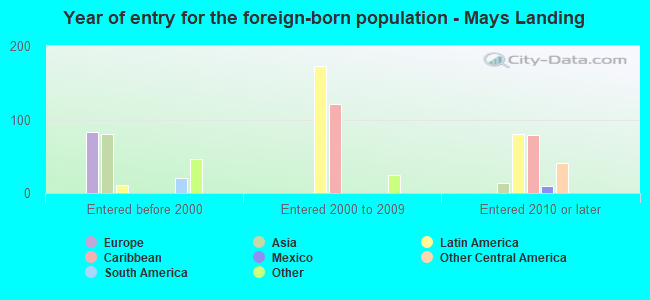
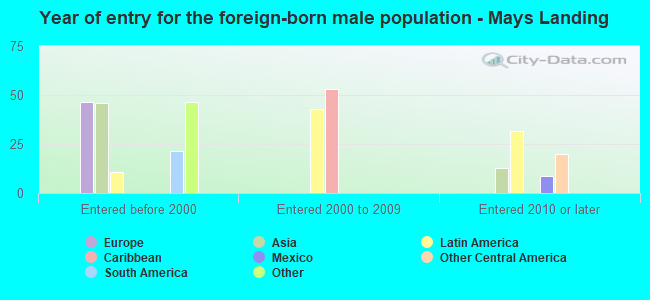
Foreign-born residents in Mays Landing 590 residents are foreign born (5.7% Latin America , 1.9% Asia , 1.2% Europe ).
This city:
9.5%New Jersey:
23.2%
Marital status for residents in Mays Landing Marital status - White (Caucasian) population 15 years and over
Males 33.5% Never married43.6% Now married7.0% Separated4.5% Widowed11.5% DivorcedFemales 25.7% Never married38.6% Now married1.4% Separated18.9% Widowed15.4% DivorcedWomen who gave birth in the past 12 months Now married:
23.4% (16)Unmarried:
76.6% (53)
Women who did not give birth in the past 12 months Now married:
21.0% (95)Unmarried:
79.0% (357)
Marital status - Black or African American population 15 years and over
Males 68.6% Never married17.0% Now married0.0% Separated12.6% Widowed1.9% DivorcedFemales 76.5% Never married9.8% Now married0.0% Separated13.7% Widowed0.0% DivorcedWomen who did not give birth in the past 12 months Now married:
10.3% (9)Unmarried:
89.7% (78)
Marital status - Asian population 15 years and over
Males 45.8% Never married54.2% Now married0.0% Separated0.0% Widowed0.0% DivorcedFemales 20.5% Never married79.5% Now married0.0% Separated0.0% Widowed0.0% DivorcedWomen who did not give birth in the past 12 months Now married:
53.1% (16)Unmarried:
46.9% (14)
Marital status - Other race population 15 years and over
Males 90.7% Never married0.0% Now married0.0% Separated0.0% Widowed9.3% DivorcedFemales 7.0% Never married0.0% Now married31.2% Separated30.7% Widowed31.2% DivorcedWomen who did not give birth in the past 12 months Now married:
45.0% (82)Unmarried:
55.0% (100)
Marital status - Two or more races population 15 years and over
Males 55.3% Never married44.7% Now married0.0% Separated0.0% Widowed0.0% DivorcedFemales 40.6% Never married59.4% Now married0.0% Separated0.0% Widowed0.0% DivorcedWomen who did not give birth in the past 12 months Now married:
56.9% (343)Unmarried:
43.1% (259)
Marital status - White alone, not Hispanic / Latino population 15 years and over
Males 33.3% Never married43.2% Now married7.2% Separated4.6% Widowed11.8% DivorcedFemales 26.2% Never married39.2% Now married1.4% Separated19.2% Widowed14.0% DivorcedWomen who gave birth in the past 12 months Now married:
23.4% (17)Unmarried:
76.6% (57)
Women who did not give birth in the past 12 months Now married:
21.0% (103)Unmarried:
79.0% (386)
Marital status - Hispanic or Latino population 15 years and over
Males 70.5% Never married26.1% Now married0.0% Separated0.0% Widowed3.4% DivorcedFemales 20.2% Never married13.8% Now married19.3% Separated19.0% Widowed27.7% DivorcedWomen who did not give birth in the past 12 months Now married:
38.8% (89)Unmarried:
61.2% (141)
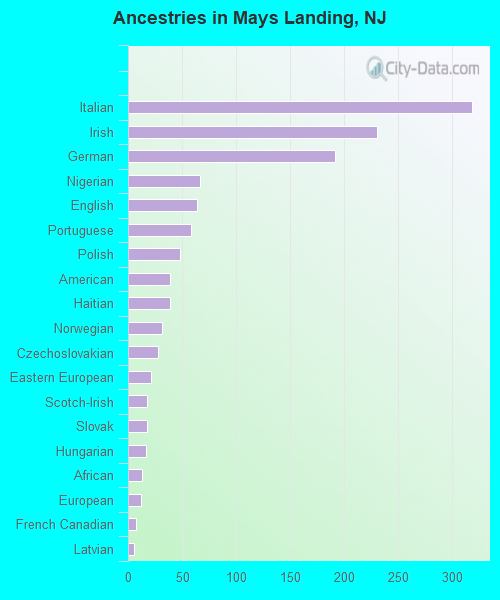
Ancestries in Mays Landing
318 11.3% Italian230 8.2% Irish191 6.8% German67 2.4% Nigerian64 2.3% English58 2.1% Portuguese48 1.7% Polish39 1.4% American39 1.4% Haitian31 1.1% Norwegian28 1.0% Czechoslovakian21 0.7% Eastern European18 0.6% Scotch-Irish18 0.6% Slovak17 0.6% Hungarian13 0.5% African12 0.4% European7 0.2% French Canadian6 0.2% Latvian
Children Nativity (place of birth) in Mays Landing
Children under 6 years - Living with two parents Both parents native 72 100.0% NativeOne native, one foreign-born parent 4 100.0% NativeChildren under 6 years - Living with one parent Native parent 159 100.0% NativeForeign-born parent 67 100.0% NativeChildren 6 to 17 years - Living with two parents Both parents native 485 100.0% NativeBoth parents foreign-born 42 100.0% NativeChildren 6 to 17 years - Living with one parent Native parent 134 100.0% NativeForeign-born parent 318 53.4% Native277 46.6% Foreign-born
Grandparents responsible for own grandchildren in Mays Landing
Grandparents (30 to 59 years) White / Caucasian 10 100.0% Not responsible for grandchildrenTwo or more races 11 100.0% Not responsible for grandchildrenWhite alone, not Hispanic / Latino 9 100.0% Not responsible for grandchildrenHispanic or Latino 12 100.0% Not responsible for grandchildren
Grandparents (60 years and over) White / Caucasian 27 100.0% Not responsible for grandchildrenWhite alone, not Hispanic / Latino 25 100.0% Not responsible for grandchildrenHispanic or Latino 85 100.0% Not responsible for grandchildren