Races in Maywood, Illinois (IL) Detailed Stats
Data:
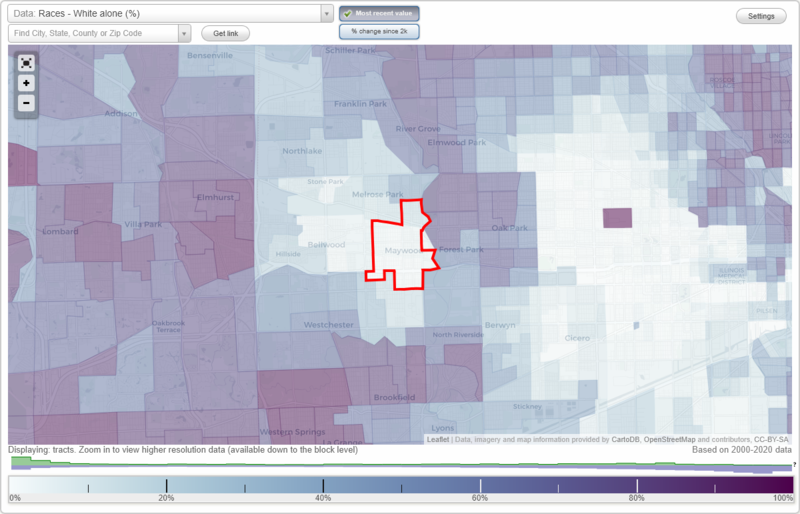
Races - White alone (%)
Races - White alone (% change since 2000)
Races - Black alone (%)
Races - Black alone (% change since 2000)
Races - American Indian alone (%)
Races - American Indian alone (% change since 2000)
Races - Asian alone (%)
Races - Asian alone (% change since 2000)
Races - Hispanic (%)
Races - Hispanic (% change since 2000)
Races - Native Hawaiian and Other Pacific Islander alone (%)
Races - Native Hawaiian and Other Pacific Islander alone (% change since 2000)
Races - Two or more races(%)
Races - Two or more races(% change since 2000)
Races - Other race alone (%)
Races - Other race alone (% change since 2000)
Racial diversity
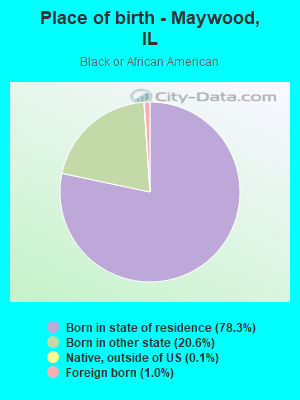
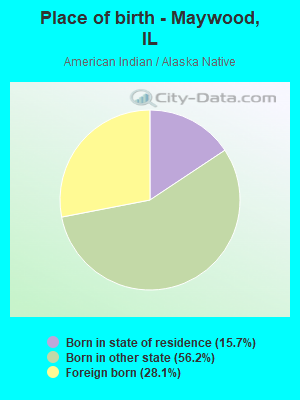
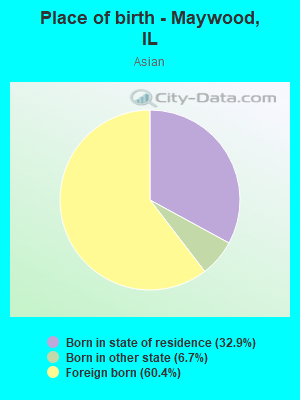
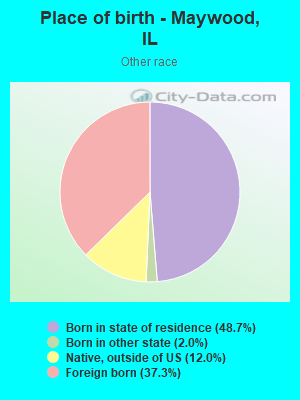
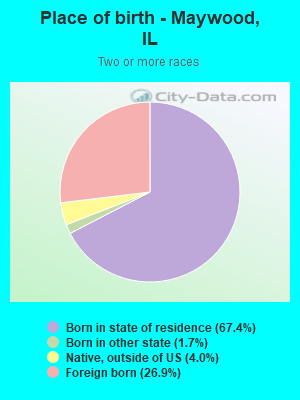
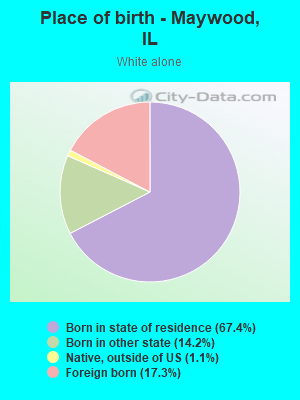
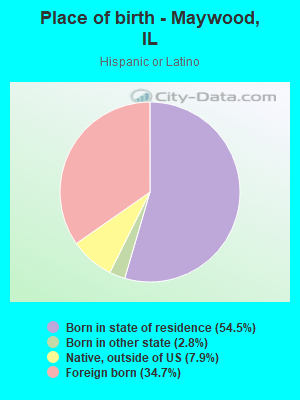
Place of birth - Born in state of residence (%)
Place of birth - Born in state of residence (%) - White
Place of birth - Born in state of residence (%) - Black or African American
Place of birth - Born in state of residence (%) - Asian
Place of birth - Born in state of residence (%) - Hispanic or Latino
Place of birth - Born in state of residence (%) - American Indian and Alaska Native
Place of birth - Born in state of residence (%) - Multirace
Place of birth - Born in state of residence (%) - Other Race
Place of birth - Born in other state (%)
Place of birth - Born in other state (%) - White
Place of birth - Born in other state (%) - Black or African American
Place of birth - Born in other state (%) - Asian
Place of birth - Born in other state (%) - Hispanic or Latino
Place of birth - Born in other state (%) - American Indian and Alaska Native
Place of birth - Born in other state (%) - Multirace
Place of birth - Born in other state (%) - Other Race
Place of birth - Native, outside of US (%)
Place of birth - Native, outside of US (%) - White
Place of birth - Native, outside of US (%) - Black or African American
Place of birth - Native, outside of US (%) - Asian
Place of birth - Native, outside of US (%) - Hispanic or Latino
Place of birth - Native, outside of US (%) - American Indian and Alaska Native
Place of birth - Native, outside of US (%) - Multirace
Place of birth - Native, outside of US (%) - Other Race
Place of birth - Foreign born (%)
Place of birth - Foreign born (%) - White
Place of birth - Foreign born (%) - Black or African American
Place of birth - Foreign born (%) - Asian
Place of birth - Foreign born (%) - Hispanic or Latino
Place of birth - Foreign born (%) - American Indian and Alaska Native
Place of birth - Foreign born (%) - Multirace
Place of birth - Foreign born (%) - Other Race
Residents speaking English at home (%)
Residents speaking English at home - Born in the United States (%)
Residents speaking English at home - Native, born elsewhere (%)
Residents speaking English at home - Foreign born (%)
Residents speaking Spanish at home (%)
Residents speaking Spanish at home - Born in the United States (%)
Residents speaking Spanish at home - Native, born elsewhere (%)
Residents speaking Spanish at home - Foreign born (%)
Residents speaking other language at home (%)
Residents speaking other language at home - Born in the United States (%)
Residents speaking other language at home - Native, born elsewhere (%)
Residents speaking other language at home - Foreign born (%)
Marital status - Never married (%)
Marital status - Now married (%)
Marital status - Separated (%)
Marital status - Widowed (%)
Marital status - Divorced (%)
Ancestries Reported - Arab (%)
Ancestries Reported - Czech (%)
Ancestries Reported - Danish (%)
Ancestries Reported - Dutch (%)
Ancestries Reported - English (%)
Ancestries Reported - French (%)
Ancestries Reported - French Canadian (%)
Ancestries Reported - German (%)
Ancestries Reported - Greek (%)
Ancestries Reported - Hungarian (%)
Ancestries Reported - Irish (%)
Ancestries Reported - Italian (%)
Ancestries Reported - Lithuanian (%)
Ancestries Reported - Norwegian (%)
Ancestries Reported - Polish (%)
Ancestries Reported - Portuguese (%)
Ancestries Reported - Russian (%)
Ancestries Reported - Scotch-Irish (%)
Ancestries Reported - Scottish (%)
Ancestries Reported - Slovak (%)
Ancestries Reported - Subsaharan African (%)
Ancestries Reported - Swedish (%)
Ancestries Reported - Swiss (%)
Ancestries Reported - Ukrainian (%)
Ancestries Reported - United States (%)
Ancestries Reported - Welsh (%)
Ancestries Reported - West Indian (%)
Ancestries Reported - Other (%)
Geographical mobility - Same house 1 year ago (%)
Geographical mobility - Same house 1 year ago (%) - White
Geographical mobility - Same house 1 year ago (%) - Black or African American
Geographical mobility - Same house 1 year ago (%) - Asian
Geographical mobility - Same house 1 year ago (%) - Hispanic or Latino
Geographical mobility - Same house 1 year ago (%) - American Indian and Alaska Native
Geographical mobility - Same house 1 year ago (%) - Multirace
Geographical mobility - Same house 1 year ago (%) - Other Race
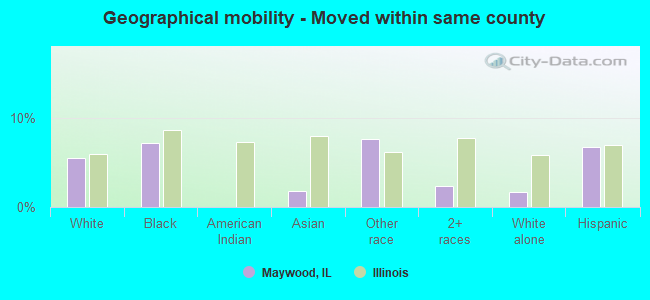
Geographical mobility - Moved within same county (%)
Geographical mobility - Moved within same county (%) - White
Geographical mobility - Moved within same county (%) - Black or African American
Geographical mobility - Moved within same county (%) - Asian
Geographical mobility - Moved within same county (%) - Hispanic or Latino
Geographical mobility - Moved within same county (%) - American Indian and Alaska Native
Geographical mobility - Moved within same county (%) - Multirace
Geographical mobility - Moved within same county (%) - Other Race
Geographical mobility - Moved from different county within same state (%)
Geographical mobility - Moved from different county within same state (%) - White
Geographical mobility - Moved from different county within same state (%) - Black or African American
Geographical mobility - Moved from different county within same state (%) - Asian
Geographical mobility - Moved from different county within same state (%) - Hispanic or Latino
Geographical mobility - Moved from different county within same state (%) - American Indian and Alaska Native
Geographical mobility - Moved from different county within same state (%) - Multirace
Geographical mobility - Moved from different county within same state (%) - Other Race
Geographical mobility - Moved from different state (%)
Geographical mobility - Moved from different state (%) - White
Geographical mobility - Moved from different state (%) - Black or African American
Geographical mobility - Moved from different state (%) - Asian
Geographical mobility - Moved from different state (%) - Hispanic or Latino
Geographical mobility - Moved from different state (%) - American Indian and Alaska Native
Geographical mobility - Moved from different state (%) - Multirace
Geographical mobility - Moved from different state (%) - Other Race
Geographical mobility - Moved from abroad (%)
Geographical mobility - Moved from abroad (%) - White
Geographical mobility - Moved from abroad (%) - Black or African American
Geographical mobility - Moved from abroad (%) - Asian
Geographical mobility - Moved from abroad (%) - Hispanic or Latino
Geographical mobility - Moved from abroad (%) - American Indian and Alaska Native
Geographical mobility - Moved from abroad (%) - Multirace
Geographical mobility - Moved from abroad (%) - Other Race
Place of birth for the foreign-born population - Ireland (%)
Place of birth for the foreign-born population - Denmark (%)
Place of birth for the foreign-born population - Norway (%)
Place of birth for the foreign-born population - Sweden (%)
Place of birth for the foreign-born population - United Kingdom (%)
Place of birth for the foreign-born population - England (%)
Place of birth for the foreign-born population - Scotland (%)
Place of birth for the foreign-born population - Other Northern Europe (%)
Place of birth for the foreign-born population - Austria (%)
Place of birth for the foreign-born population - Belgium (%)
Place of birth for the foreign-born population - France (%)
Place of birth for the foreign-born population - Germany (%)
Place of birth for the foreign-born population - Netherlands (%)
Place of birth for the foreign-born population - Switzerland (%)
Place of birth for the foreign-born population - Other Western Europe (%)
Place of birth for the foreign-born population - Greece (%)
Place of birth for the foreign-born population - Italy (%)
Place of birth for the foreign-born population - Portugal (%)
Place of birth for the foreign-born population - Spain (%)
Place of birth for the foreign-born population - Other Southern Europe (%)
Place of birth for the foreign-born population - Albania (%)
Place of birth for the foreign-born population - Belarus (%)
Place of birth for the foreign-born population - Bosnia and Herzegovina (%)
Place of birth for the foreign-born population - Bulgaria (%)
Place of birth for the foreign-born population - Croatia (%)
Place of birth for the foreign-born population - Czechoslovakia (%)
Place of birth for the foreign-born population - Hungary (%)
Place of birth for the foreign-born population - Latvia (%)
Place of birth for the foreign-born population - Lithuania (%)
Place of birth for the foreign-born population - North Macedonia (Macedonia) (%)
Place of birth for the foreign-born population - Moldova (%)
Place of birth for the foreign-born population - Poland (%)
Place of birth for the foreign-born population - Romania (%)
Place of birth for the foreign-born population - Russia (%)
Place of birth for the foreign-born population - Serbia (%)
Place of birth for the foreign-born population - Ukraine (%)
Place of birth for the foreign-born population - Other Eastern Europe (%)
Place of birth for the foreign-born population - China (%)
Place of birth for the foreign-born population - Hong Kong (%)
Place of birth for the foreign-born population - Taiwan (%)
Place of birth for the foreign-born population - Japan (%)
Place of birth for the foreign-born population - Korea (%)
Place of birth for the foreign-born population - Other Eastern Asia (%)
Place of birth for the foreign-born population - Afghanistan (%)
Place of birth for the foreign-born population - Bangladesh (%)
Place of birth for the foreign-born population - India (%)
Place of birth for the foreign-born population - Iran (%)
Place of birth for the foreign-born population - Kazakhstan (%)
Place of birth for the foreign-born population - Nepal (%)
Place of birth for the foreign-born population - Pakistan (%)
Place of birth for the foreign-born population - Sri Lanka (%)
Place of birth for the foreign-born population - Uzbekistan (%)
Place of birth for the foreign-born population - Other South Central Asia (%)
Place of birth for the foreign-born population - Burma (%)
Place of birth for the foreign-born population - Cambodia (%)
Place of birth for the foreign-born population - Indonesia (%)
Place of birth for the foreign-born population - Laos (%)
Place of birth for the foreign-born population - Malaysia (%)
Place of birth for the foreign-born population - Philippines (%)
Place of birth for the foreign-born population - Singapore (%)
Place of birth for the foreign-born population - Thailand (%)
Place of birth for the foreign-born population - Vietnam (%)
Place of birth for the foreign-born population - Other South Eastern Asia (%)
Place of birth for the foreign-born population - Armenia (%)
Place of birth for the foreign-born population - Iraq (%)
Place of birth for the foreign-born population - Israel (%)
Place of birth for the foreign-born population - Jordan (%)
Place of birth for the foreign-born population - Kuwait (%)
Place of birth for the foreign-born population - Lebanon (%)
Place of birth for the foreign-born population - Saudi Arabia (%)
Place of birth for the foreign-born population - Syria (%)
Place of birth for the foreign-born population - Turkey (%)
Place of birth for the foreign-born population - Yemen (%)
Place of birth for the foreign-born population - Other Western Asia (%)
Place of birth for the foreign-born population - Eritrea (%)
Place of birth for the foreign-born population - Ethiopia (%)
Place of birth for the foreign-born population - Kenya (%)
Place of birth for the foreign-born population - Somalia (%)
Place of birth for the foreign-born population - Uganda (%)
Place of birth for the foreign-born population - Zimbabwe (%)
Place of birth for the foreign-born population - Other Eastern Africa (%)
Place of birth for the foreign-born population - Cameroon (%)
Place of birth for the foreign-born population - Congo (%)
Place of birth for the foreign-born population - Democratic Republic of Congo (Zaire) (%)
Place of birth for the foreign-born population - Other Middle Africa (%)
Place of birth for the foreign-born population - Egypt (%)
Place of birth for the foreign-born population - Morocco (%)
Place of birth for the foreign-born population - Sudan (%)
Place of birth for the foreign-born population - Other Northern Africa (%)
Place of birth for the foreign-born population - South Africa (%)
Place of birth for the foreign-born population - Other Southern Africa (%)
Place of birth for the foreign-born population - Cabo Verde (%)
Place of birth for the foreign-born population - Ghana (%)
Place of birth for the foreign-born population - Liberia (%)
Place of birth for the foreign-born population - Nigeria (%)
Place of birth for the foreign-born population - Senegal (%)
Place of birth for the foreign-born population - Sierra Leone (%)
Place of birth for the foreign-born population - Other Western Africa (%)
Place of birth for the foreign-born population - Australia (%)
Place of birth for the foreign-born population - New Zealand (%)
Place of birth for the foreign-born population - Fiji (%)
Place of birth for the foreign-born population - Micronesia (%)
Place of birth for the foreign-born population - Bahamas (%)
Place of birth for the foreign-born population - Barbados (%)
Place of birth for the foreign-born population - Cuba (%)
Place of birth for the foreign-born population - Dominica (%)
Place of birth for the foreign-born population - Dominican Republic (%)
Place of birth for the foreign-born population - Grenada (%)
Place of birth for the foreign-born population - Haiti (%)
Place of birth for the foreign-born population - Jamaica (%)
Place of birth for the foreign-born population - St. Vincent and the Grenadines (%)
Place of birth for the foreign-born population - Trinidad and Tobago (%)
Place of birth for the foreign-born population - West Indies (%)
Place of birth for the foreign-born population - Other Caribbean (%)
Place of birth for the foreign-born population - Belize (%)
Place of birth for the foreign-born population - Costa Rica (%)
Place of birth for the foreign-born population - El Salvador (%)
Place of birth for the foreign-born population - Guatemala (%)
Place of birth for the foreign-born population - Honduras (%)
Place of birth for the foreign-born population - Mexico (%)
Place of birth for the foreign-born population - Nicaragua (%)
Place of birth for the foreign-born population - Panama (%)
Place of birth for the foreign-born population - Other Central America (%)
Place of birth for the foreign-born population - Argentina (%)
Place of birth for the foreign-born population - Bolivia (%)
Place of birth for the foreign-born population - Brazil (%)
Place of birth for the foreign-born population - Chile (%)
Place of birth for the foreign-born population - Colombia (%)
Place of birth for the foreign-born population - Ecuador (%)
Place of birth for the foreign-born population - Guyana (%)
Place of birth for the foreign-born population - Peru (%)
Place of birth for the foreign-born population - Uruguay (%)
Place of birth for the foreign-born population - Venezuela (%)
Place of birth for the foreign-born population - Other South America (%)
Place of birth for the foreign-born population - Canada (%)
Place of birth for the foreign-born population - Other Northern America (%)
Place of birth for the foreign-born population - Other (%)
Latest news about races in Maywood, IL collected exclusively by city-data.com from local newspapers, TV, and radio stations
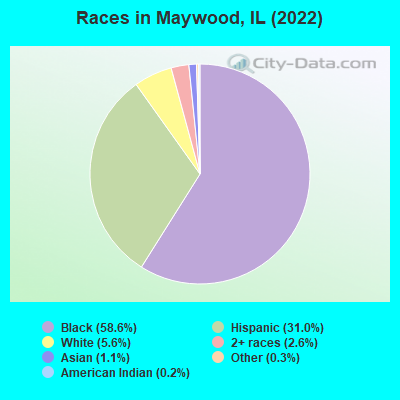
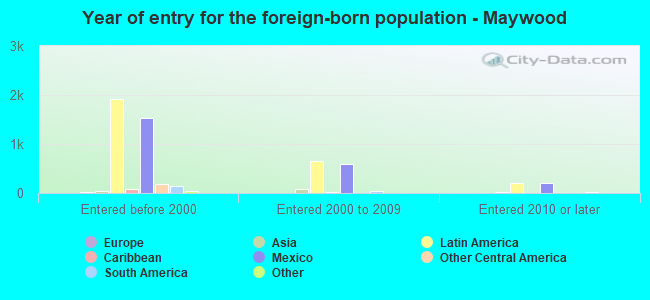
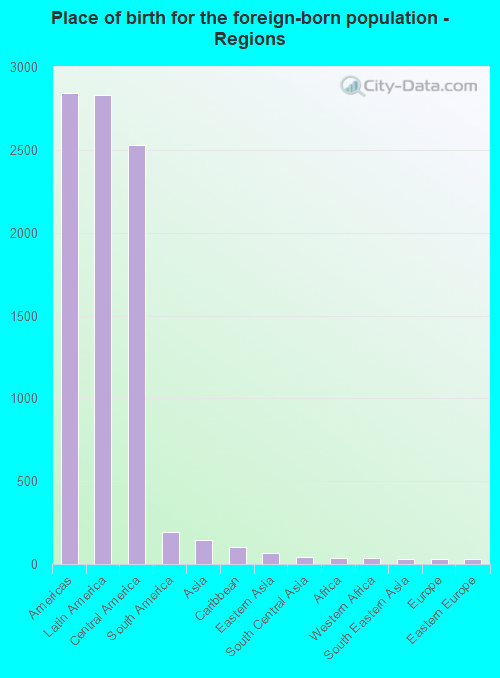
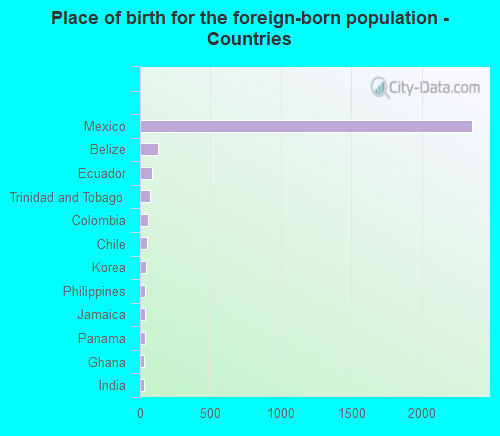
According to 2022 data, the most numerous races in Maywood, IL are White alone (1,272 residents), Hispanic (7,094 residents), and Black alone (13,410 residents). 69.9% of Maywood residents speak English at home. 13.4% of Maywood, IL residents are foreign-born (12.2% born in Latin America), which is 4.2% less than the foreign-born rate of 14.0% across the entire state of Illinois.
Race distribution in Maywood
2000 2022
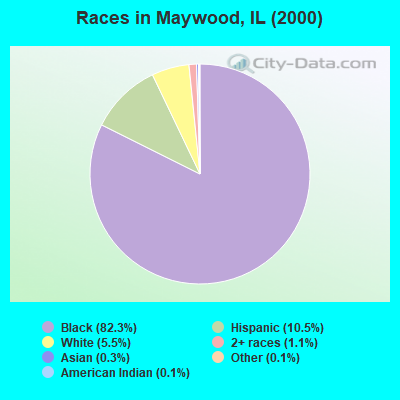
8,424,140 67.8% White alone 1,856,152 14.9% Black alone 1,530,262 12.3% Hispanic 419,916 3.4% Asian alone 153,996 1.2% Two or more races 13,479 0.1% Other race alone 18,232 0.1% American Indian alone 3,116 0.03% Native Hawaiian and Other
7,356,301 58.5% White alone 2,299,726 18.3% Hispanic 1,660,423 13.2% Black alone 747,296 5.9% Asian alone 458,599 3.6% Two or more races 45,386 0.4% Other race alone 10,405 0.08% American Indian alone 3,896 0.03% Native Hawaiian and Other
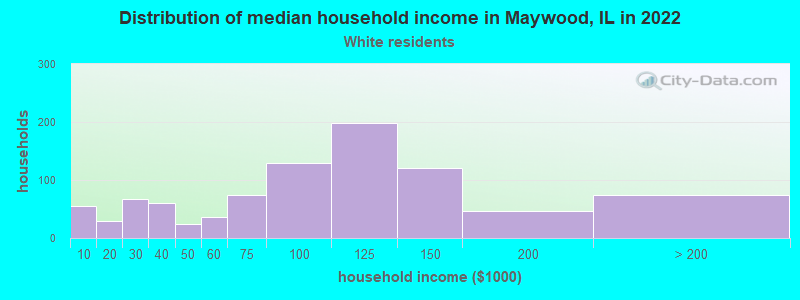
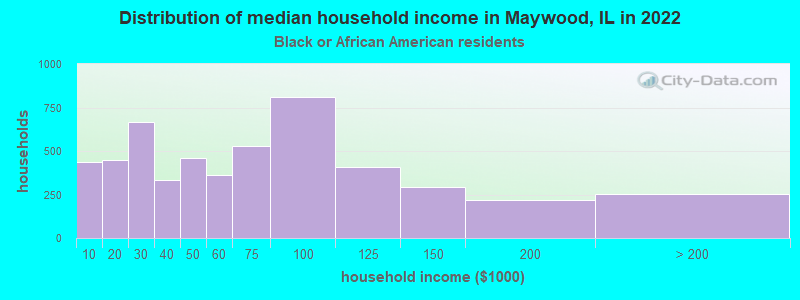
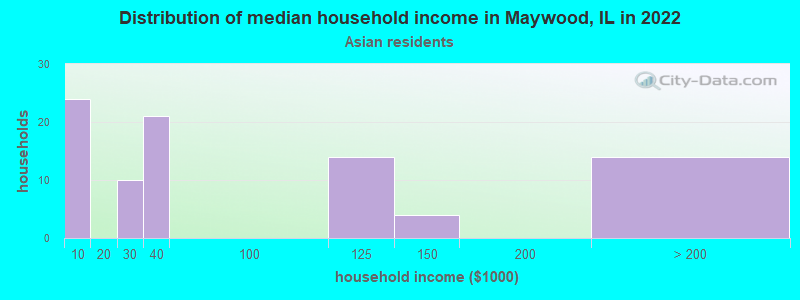
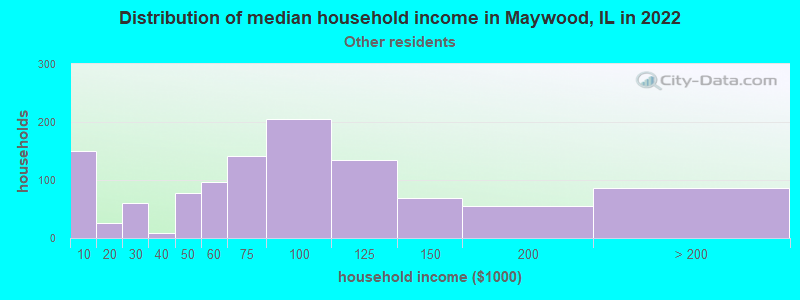
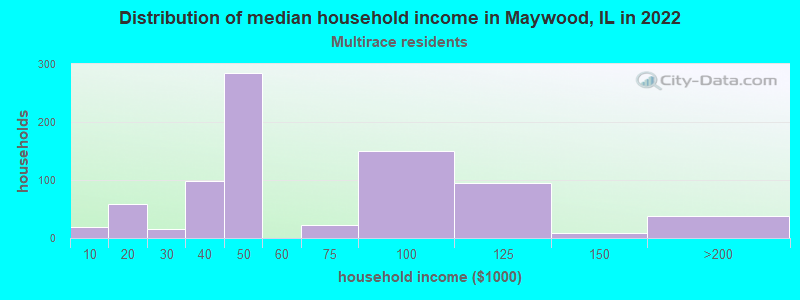
Income and house value in Maywood Median household income in 2022 $109,183 White non-Hispanic householders$57,355 Black householders$76,727 Some other race householders$42,182 Two or more races householders$76,528 Hispanic or Latino race householdersMedian 2022 house value $212,513 White Non-Hispanic householders$189,889 Black or African American householders $274,264 Asian householders$229,759 Some other race householders$224,381 Two or more races householders$223,268 Hispanic or Latino householders
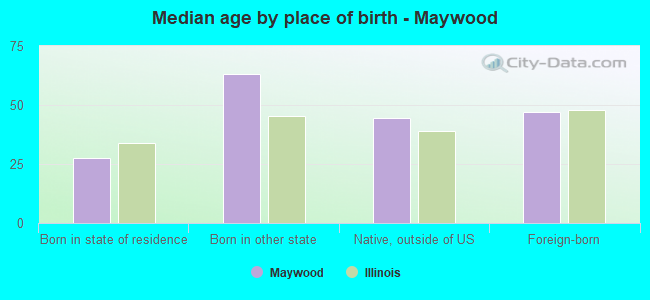
Median age by race in Maywood
38.3 Median age for White residents38.9 37.1 42.4 Median age for Black or African American residents36.0 48.4 46.3 Median age for American Indian / Alaska Native residents-736,736,736.0 -641,399,416.3 31.8 Median age for Asian residents26.6 33.1 -687,999,999.3 Median age for Native Hawaiian / Pacific Islander residents-918,721,460.3 -610,229,276.3 30.8 Median age for Other race residents35.1 29.3 28.2 Median age for Two or more races residents26.0 30.6 46.3 Median age for White alone residents45.1 50.7 30.3 Median age for Hispanic or Latino residents33.1 29.3
Owner/renter occupied households by race in Maywood
House owners and renters - White residents 646 71.0% Owner occupied263 29.0% Renter occupiedHouse owners and renters - Black or African American residents 3,079 58.6% Owner occupied2,174 41.4% Renter occupiedHouse owners and renters - Asian residents 46 50.2% Owner occupied45 49.8% Renter occupiedHouse owners and renters - Other race residents 838 74.3% Owner occupied289 25.7% Renter occupiedHouse owners and renters - Two or more races residents 491 66.9% Owner occupied243 33.1% Renter occupiedHouse owners and renters - White alone residents 342 64.5% Owner occupied188 35.5% Renter occupiedHouse owners and renters - Hispanic or Latino residents 1,377 71.8% Owner occupied541 28.2% Renter occupied
Language usage in Maywood
English speakers - Total 69.9% of residents of Maywood speak English at home.
28.7% of residents speak Spanish at home 3,269 52.6% Speak English very well2,946 47.4% Speak English less than very well1.2% of residents speak other language at home 255 94.8% Speak English very well14 5.2% Speak English less than very well
English speakers - Born in the United States 93.2% of residents of Maywood speak English at home.
5.0% of residents speak Spanish at home 97 57.4% Speak English very well72 42.6% Speak English less than very well1.7% of residents speak other language at home 58 100.0% Speak English very well
English speakers - Native, born elsewhere 8.5% of residents of Maywood speak English at home.
89.8% of residents speak Spanish at home 251 53.0% Speak English very well223 47.0% Speak English less than very well
English speakers - Foreign-born 16.3% of residents of Maywood speak English at home.
79.8% of residents speak Spanish at home 626 25.6% Speak English very well1,824 74.4% Speak English less than very well4.0% of residents speak other language at home 109 88.6% Speak English very well14 11.4% Speak English less than very well
White (Caucasian) - Speak only English Native:
50.3% (975)Foreign-born:
3.8% (24)
White (Caucasian) - Speak another language Native:
38.6% (748)Foreign-born:
95.4% (612)
Black or African American - Speak only English Native:
97.7% (12,504)Foreign-born:
100.0% (135)
Black or African American - Speak another language Native:
2.3% (295)Foreign-born:
6.9% (9)
American Indian / Alaska Native - Speak another language Native:
83.5% (54)Foreign-born:
100.0% (28)
Asian - Speak only English Native:
100.0% (85)Foreign-born:
45.2% (67)
Other race - Speak only English Native:
14.6% (377)Foreign-born:
9.1% (153)
Other race - Speak another language Native:
84.5% (2,181)Foreign-born:
90.4% (1,525)
Two or more races - Speak only English Native:
48.6% (759)Foreign-born:
31.6% (221)
Two or more races - Speak another language Native:
51.8% (808)Foreign-born:
68.5% (479)
White alone - Speak only English Native:
78.8% (833)Foreign-born:
3.2% (7)
White alone - Speak another language Native:
22.6% (239)Foreign-born:
98.1% (216)
Hispanic or Latino - Speak only English Native:
18.4% (767)Foreign-born:
7.9% (195)
Hispanic or Latino - Speak another language Native:
80.7% (3,370)Foreign-born:
91.7% (2,263)
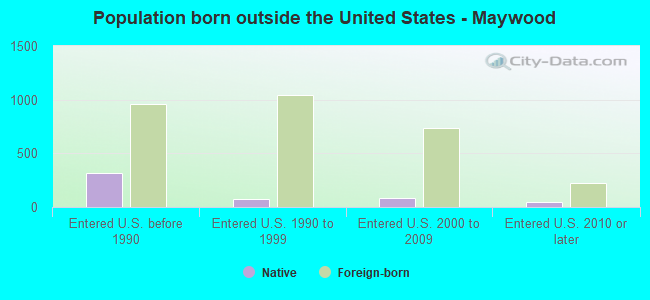
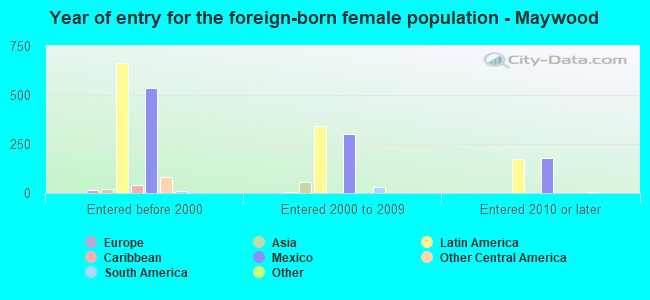
Foreign-born residents in Maywood 3,071 residents are foreign born (12.2% Latin America ).
This city:
13.4%Illinois:
14.1%
Marital status for residents in Maywood Marital status - White (Caucasian) population 15 years and over
Males 41.1% Never married47.6% Now married2.6% Separated3.5% Widowed5.2% DivorcedFemales 46.5% Never married44.9% Now married0.6% Separated2.0% Widowed6.0% DivorcedWomen who gave birth in the past 12 months Now married:
53.0% (37)Unmarried:
47.0% (33)
Women who did not give birth in the past 12 months Now married:
36.5% (271)Unmarried:
63.5% (471)
Marital status - Black or African American population 15 years and over
Males 50.7% Never married37.2% Now married1.2% Separated3.8% Widowed7.2% DivorcedFemales 43.4% Never married27.6% Now married4.9% Separated9.6% Widowed14.5% DivorcedWomen who gave birth in the past 12 months Now married:
51.3% (73)Unmarried:
48.7% (69)
Women who did not give birth in the past 12 months Now married:
27.6% (832)Unmarried:
72.4% (2,185)
Marital status - American Indian / Alaska Native population 15 years and over
Males 0.0% Never married100.0% Now married0.0% Separated0.0% Widowed0.0% DivorcedFemales 0.0% Never married100.0% Now married0.0% Separated0.0% Widowed0.0% DivorcedWomen who did not give birth in the past 12 months Now married:
100.0% (54)Unmarried:
0.0% (0)
Marital status - Asian population 15 years and over
Males 51.7% Never married34.8% Now married0.0% Separated13.5% Widowed0.0% DivorcedFemales 24.0% Never married72.0% Now married0.0% Separated4.0% Widowed0.0% DivorcedWomen who did not give birth in the past 12 months Now married:
60.0% (36)Unmarried:
40.0% (24)
Marital status - Other race population 15 years and over
Males 44.1% Never married40.9% Now married5.1% Separated0.9% Widowed9.0% DivorcedFemales 42.6% Never married51.4% Now married0.5% Separated0.0% Widowed5.4% DivorcedWomen who gave birth in the past 12 months Now married:
100.0% (66)Unmarried:
0.0% (0)
Women who did not give birth in the past 12 months Now married:
47.1% (534)Unmarried:
52.9% (601)
Marital status - Two or more races population 15 years and over
Males 43.9% Never married47.1% Now married0.0% Separated0.0% Widowed9.0% DivorcedFemales 41.2% Never married34.2% Now married1.6% Separated8.1% Widowed14.8% DivorcedWomen who gave birth in the past 12 months Now married:
0.0% (0)Unmarried:
100.0% (43)
Women who did not give birth in the past 12 months Now married:
39.6% (200)Unmarried:
60.4% (305)
Marital status - White alone, not Hispanic / Latino population 15 years and over
Males 37.8% Never married49.3% Now married0.0% Separated2.9% Widowed10.0% DivorcedFemales 33.9% Never married59.6% Now married1.5% Separated3.3% Widowed1.7% DivorcedWomen who did not give birth in the past 12 months Now married:
59.9% (179)Unmarried:
40.1% (120)
Marital status - Hispanic or Latino population 15 years and over
Males 43.5% Never married43.7% Now married4.3% Separated1.5% Widowed7.0% DivorcedFemales 46.5% Never married42.0% Now married0.7% Separated1.9% Widowed8.9% DivorcedWomen who gave birth in the past 12 months Now married:
59.3% (102)Unmarried:
40.7% (70)
Women who did not give birth in the past 12 months Now married:
39.3% (734)Unmarried:
60.7% (1,131)
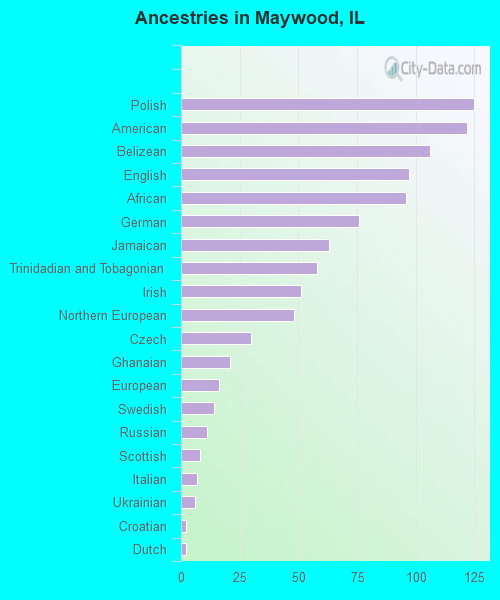
Ancestries in Maywood
125 0.8% Polish122 0.7% American106 0.6% Belizean97 0.6% English96 0.6% African76 0.5% German63 0.4% Jamaican58 0.3% Trinidadian and Tobagonian51 0.3% Irish48 0.3% Northern European30 0.2% Czech21 0.1% Ghanaian16 0.10% European14 0.08% Swedish11 0.07% Russian8 0.05% Scottish7 0.04% Italian6 0.04% Ukrainian2 0.01% Croatian2 0.01% Dutch1 0.01% Lithuanian
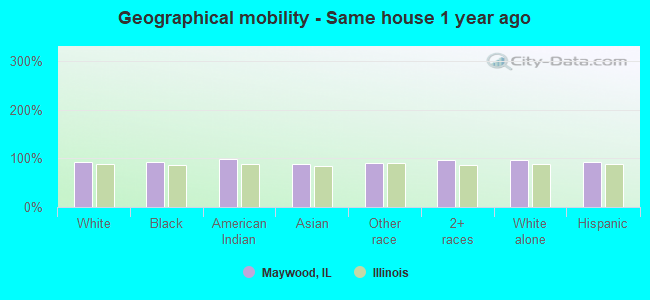
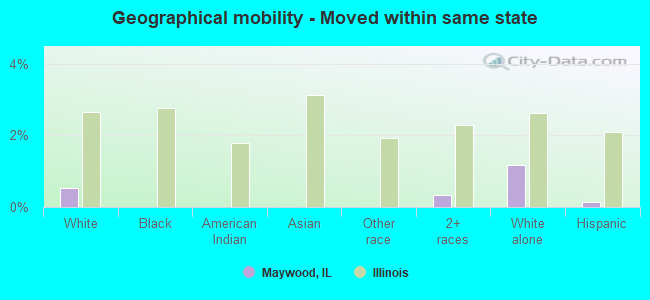
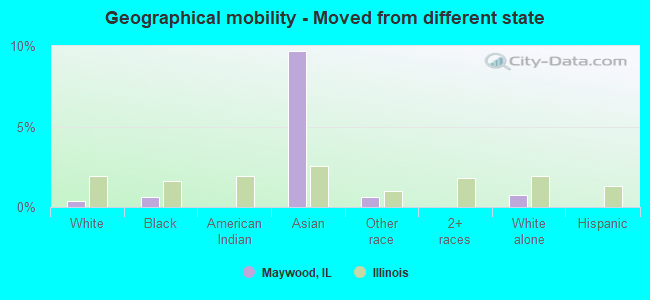
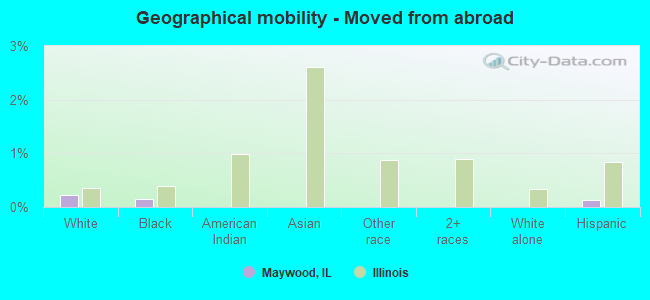
Geographical mobility in Maywood Same house 1 year ago 2,507 92.5% White (Caucasian)12,258 91.9% Black or African American91 98.7% American Indian / Alaska Native217 89.0% Asian3,986 91.1% Other race2,464 96.2% Two or more races1,222 95.8% White alone, not Hispanic / Latino6,415 92.4% Hispanic or LatinoMoved within same county 150 5.5% White / Caucasian951 7.1% Black or African American4 1.7% Asian333 7.6% Other race59 2.3% Two or more races21 1.7% White alone, not Hispanic / Latino463 6.7% Hispanic or LatinoMoved within same state 14 0.5% White / Caucasian9 0.3% Two or more races15 1.2% White alone, not Hispanic / Latino9 0.1% Hispanic or LatinoMoved from different state 9 0.3% White / Caucasian83 0.6% Black or African American24 9.7% Asian26 0.6% Other race10 0.7% White alone, not Hispanic / LatinoMoved from abroad 6 0.2% White19 0.1% Black or African American9 0.1% Hispanic or Latino
Children Nativity (place of birth) in Maywood
Children under 6 years - Living with two parents Both parents native 339 100.0% NativeBoth parents foreign-born 88 100.0% NativeOne native, one foreign-born parent 92 100.0% NativeChildren under 6 years - Living with one parent Native parent 709 100.0% NativeForeign-born parent 46 100.0% NativeChildren 6 to 17 years - Living with two parents Both parents native 676 100.0% NativeBoth parents foreign-born 339 96.8% Native11 3.2% Foreign-bornOne native, one foreign-born parent 540 100.0% NativeChildren 6 to 17 years - Living with one parent Native parent 1,599 100.0% NativeForeign-born parent 359 50.1% Native358 49.9% Foreign-born
Grandparents responsible for own grandchildren in Maywood
Grandparents (30 to 59 years) White / Caucasian 34 100.0% Not responsible for grandchildrenBlack or African American 8 4.5% Responsible for grandchildren163 95.5% Not responsible for grandchildrenAmerican Indian / Alaska Native 6 100.0% Responsible for grandchildrenOther race 99 100.0% Not responsible for grandchildrenTwo or more races 40 100.0% Not responsible for grandchildrenWhite alone, not Hispanic / Latino 25 100.0% Not responsible for grandchildrenHispanic or Latino 21 17.0% Responsible for grandchildren104 83.0% Not responsible for grandchildrenGrandparents (60 years and over) White / Caucasian 2 8.6% Responsible for grandchildren24 91.4% Not responsible for grandchildrenBlack or African American 129 54.5% Responsible for grandchildren108 45.5% Not responsible for grandchildrenOther race 51 100.0% Not responsible for grandchildrenWhite alone, not Hispanic / Latino 31 100.0% Not responsible for grandchildrenHispanic or Latino 4 10.2% Responsible for grandchildren33 89.8% Not responsible for grandchildren