Races in Merrionette Park, Illinois (IL) Detailed Stats
Data:
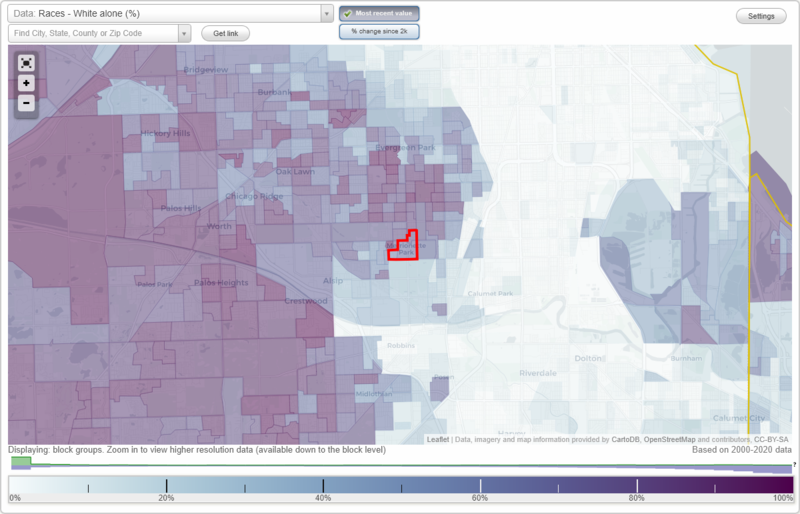
Races - White alone (%)
Races - White alone (% change since 2000)
Races - Black alone (%)
Races - Black alone (% change since 2000)
Races - American Indian alone (%)
Races - American Indian alone (% change since 2000)
Races - Asian alone (%)
Races - Asian alone (% change since 2000)
Races - Hispanic (%)
Races - Hispanic (% change since 2000)
Races - Native Hawaiian and Other Pacific Islander alone (%)
Races - Native Hawaiian and Other Pacific Islander alone (% change since 2000)
Races - Two or more races(%)
Races - Two or more races(% change since 2000)
Races - Other race alone (%)
Races - Other race alone (% change since 2000)
Racial diversity
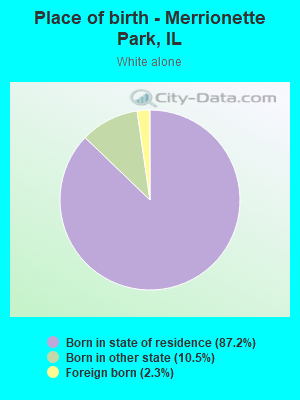
Place of birth - Born in state of residence (%)
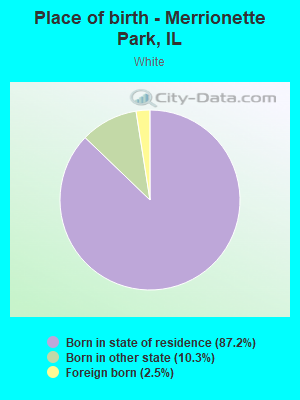
Place of birth - Born in state of residence (%) - White
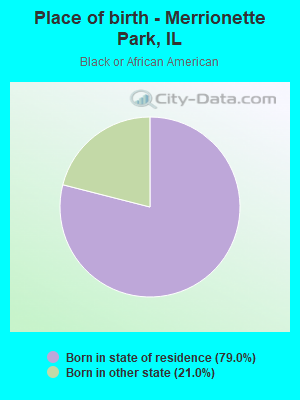
Place of birth - Born in state of residence (%) - Black or African American
Place of birth - Born in state of residence (%) - Asian
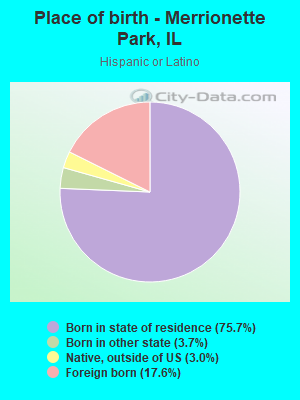
Place of birth - Born in state of residence (%) - Hispanic or Latino
Place of birth - Born in state of residence (%) - American Indian and Alaska Native
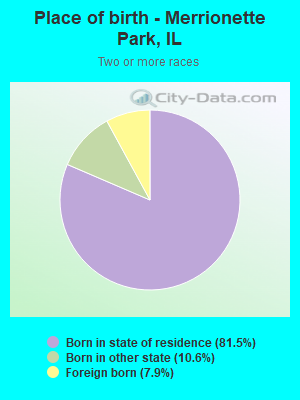
Place of birth - Born in state of residence (%) - Multirace
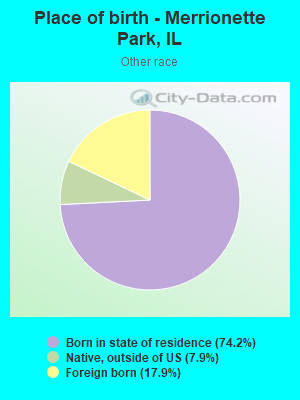
Place of birth - Born in state of residence (%) - Other Race
Place of birth - Born in other state (%)
Place of birth - Born in other state (%) - White
Place of birth - Born in other state (%) - Black or African American
Place of birth - Born in other state (%) - Asian
Place of birth - Born in other state (%) - Hispanic or Latino
Place of birth - Born in other state (%) - American Indian and Alaska Native
Place of birth - Born in other state (%) - Multirace
Place of birth - Born in other state (%) - Other Race
Place of birth - Native, outside of US (%)
Place of birth - Native, outside of US (%) - White
Place of birth - Native, outside of US (%) - Black or African American
Place of birth - Native, outside of US (%) - Asian
Place of birth - Native, outside of US (%) - Hispanic or Latino
Place of birth - Native, outside of US (%) - American Indian and Alaska Native
Place of birth - Native, outside of US (%) - Multirace
Place of birth - Native, outside of US (%) - Other Race
Place of birth - Foreign born (%)
Place of birth - Foreign born (%) - White
Place of birth - Foreign born (%) - Black or African American
Place of birth - Foreign born (%) - Asian
Place of birth - Foreign born (%) - Hispanic or Latino
Place of birth - Foreign born (%) - American Indian and Alaska Native
Place of birth - Foreign born (%) - Multirace
Place of birth - Foreign born (%) - Other Race
Residents speaking English at home (%)
Residents speaking English at home - Born in the United States (%)
Residents speaking English at home - Native, born elsewhere (%)
Residents speaking English at home - Foreign born (%)
Residents speaking Spanish at home (%)
Residents speaking Spanish at home - Born in the United States (%)
Residents speaking Spanish at home - Native, born elsewhere (%)
Residents speaking Spanish at home - Foreign born (%)
Residents speaking other language at home (%)
Residents speaking other language at home - Born in the United States (%)
Residents speaking other language at home - Native, born elsewhere (%)
Residents speaking other language at home - Foreign born (%)
Marital status - Never married (%)
Marital status - Now married (%)
Marital status - Separated (%)
Marital status - Widowed (%)
Marital status - Divorced (%)
Ancestries Reported - Arab (%)
Ancestries Reported - Czech (%)
Ancestries Reported - Danish (%)
Ancestries Reported - Dutch (%)
Ancestries Reported - English (%)
Ancestries Reported - French (%)
Ancestries Reported - French Canadian (%)
Ancestries Reported - German (%)
Ancestries Reported - Greek (%)
Ancestries Reported - Hungarian (%)
Ancestries Reported - Irish (%)
Ancestries Reported - Italian (%)
Ancestries Reported - Lithuanian (%)
Ancestries Reported - Norwegian (%)
Ancestries Reported - Polish (%)
Ancestries Reported - Portuguese (%)
Ancestries Reported - Russian (%)
Ancestries Reported - Scotch-Irish (%)
Ancestries Reported - Scottish (%)
Ancestries Reported - Slovak (%)
Ancestries Reported - Subsaharan African (%)
Ancestries Reported - Swedish (%)
Ancestries Reported - Swiss (%)
Ancestries Reported - Ukrainian (%)
Ancestries Reported - United States (%)
Ancestries Reported - Welsh (%)
Ancestries Reported - West Indian (%)
Ancestries Reported - Other (%)
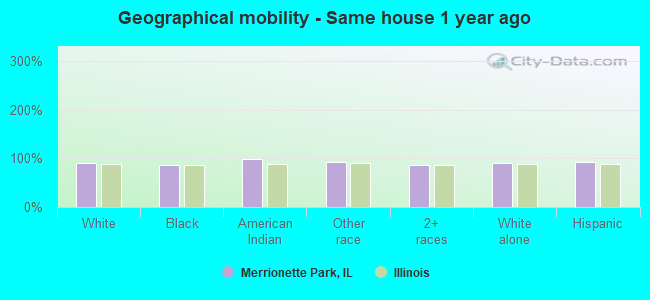
Geographical mobility - Same house 1 year ago (%)
Geographical mobility - Same house 1 year ago (%) - White
Geographical mobility - Same house 1 year ago (%) - Black or African American
Geographical mobility - Same house 1 year ago (%) - Asian
Geographical mobility - Same house 1 year ago (%) - Hispanic or Latino
Geographical mobility - Same house 1 year ago (%) - American Indian and Alaska Native
Geographical mobility - Same house 1 year ago (%) - Multirace
Geographical mobility - Same house 1 year ago (%) - Other Race
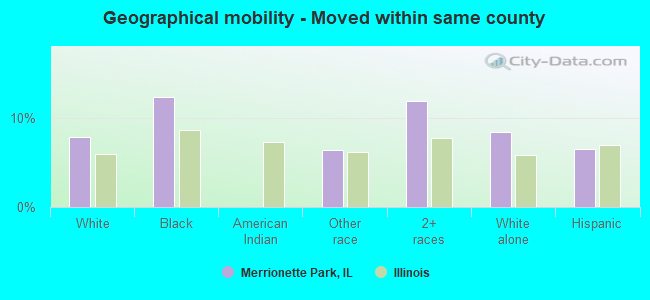
Geographical mobility - Moved within same county (%)
Geographical mobility - Moved within same county (%) - White
Geographical mobility - Moved within same county (%) - Black or African American
Geographical mobility - Moved within same county (%) - Asian
Geographical mobility - Moved within same county (%) - Hispanic or Latino
Geographical mobility - Moved within same county (%) - American Indian and Alaska Native
Geographical mobility - Moved within same county (%) - Multirace
Geographical mobility - Moved within same county (%) - Other Race
Geographical mobility - Moved from different county within same state (%)
Geographical mobility - Moved from different county within same state (%) - White
Geographical mobility - Moved from different county within same state (%) - Black or African American
Geographical mobility - Moved from different county within same state (%) - Asian
Geographical mobility - Moved from different county within same state (%) - Hispanic or Latino
Geographical mobility - Moved from different county within same state (%) - American Indian and Alaska Native
Geographical mobility - Moved from different county within same state (%) - Multirace
Geographical mobility - Moved from different county within same state (%) - Other Race
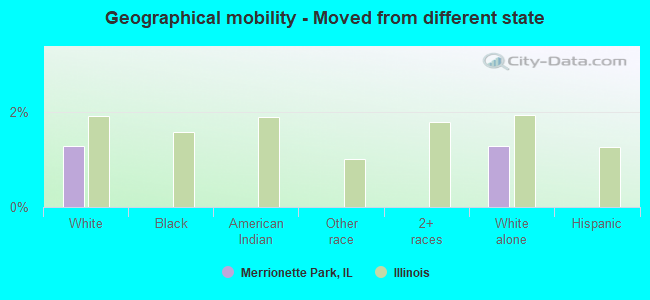
Geographical mobility - Moved from different state (%)
Geographical mobility - Moved from different state (%) - White
Geographical mobility - Moved from different state (%) - Black or African American
Geographical mobility - Moved from different state (%) - Asian
Geographical mobility - Moved from different state (%) - Hispanic or Latino
Geographical mobility - Moved from different state (%) - American Indian and Alaska Native
Geographical mobility - Moved from different state (%) - Multirace
Geographical mobility - Moved from different state (%) - Other Race
Geographical mobility - Moved from abroad (%)
Geographical mobility - Moved from abroad (%) - White
Geographical mobility - Moved from abroad (%) - Black or African American
Geographical mobility - Moved from abroad (%) - Asian
Geographical mobility - Moved from abroad (%) - Hispanic or Latino
Geographical mobility - Moved from abroad (%) - American Indian and Alaska Native
Geographical mobility - Moved from abroad (%) - Multirace
Geographical mobility - Moved from abroad (%) - Other Race
Place of birth for the foreign-born population - Ireland (%)
Place of birth for the foreign-born population - Denmark (%)
Place of birth for the foreign-born population - Norway (%)
Place of birth for the foreign-born population - Sweden (%)
Place of birth for the foreign-born population - United Kingdom (%)
Place of birth for the foreign-born population - England (%)
Place of birth for the foreign-born population - Scotland (%)
Place of birth for the foreign-born population - Other Northern Europe (%)
Place of birth for the foreign-born population - Austria (%)
Place of birth for the foreign-born population - Belgium (%)
Place of birth for the foreign-born population - France (%)
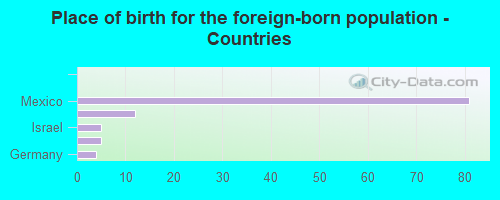
Place of birth for the foreign-born population - Germany (%)
Place of birth for the foreign-born population - Netherlands (%)
Place of birth for the foreign-born population - Switzerland (%)
Place of birth for the foreign-born population - Other Western Europe (%)
Place of birth for the foreign-born population - Greece (%)
Place of birth for the foreign-born population - Italy (%)
Place of birth for the foreign-born population - Portugal (%)
Place of birth for the foreign-born population - Spain (%)
Place of birth for the foreign-born population - Other Southern Europe (%)
Place of birth for the foreign-born population - Albania (%)
Place of birth for the foreign-born population - Belarus (%)
Place of birth for the foreign-born population - Bosnia and Herzegovina (%)
Place of birth for the foreign-born population - Bulgaria (%)
Place of birth for the foreign-born population - Croatia (%)
Place of birth for the foreign-born population - Czechoslovakia (%)
Place of birth for the foreign-born population - Hungary (%)
Place of birth for the foreign-born population - Latvia (%)
Place of birth for the foreign-born population - Lithuania (%)
Place of birth for the foreign-born population - North Macedonia (Macedonia) (%)
Place of birth for the foreign-born population - Moldova (%)
Place of birth for the foreign-born population - Poland (%)
Place of birth for the foreign-born population - Romania (%)
Place of birth for the foreign-born population - Russia (%)
Place of birth for the foreign-born population - Serbia (%)
Place of birth for the foreign-born population - Ukraine (%)
Place of birth for the foreign-born population - Other Eastern Europe (%)
Place of birth for the foreign-born population - China (%)
Place of birth for the foreign-born population - Hong Kong (%)
Place of birth for the foreign-born population - Taiwan (%)
Place of birth for the foreign-born population - Japan (%)
Place of birth for the foreign-born population - Korea (%)
Place of birth for the foreign-born population - Other Eastern Asia (%)
Place of birth for the foreign-born population - Afghanistan (%)
Place of birth for the foreign-born population - Bangladesh (%)
Place of birth for the foreign-born population - India (%)
Place of birth for the foreign-born population - Iran (%)
Place of birth for the foreign-born population - Kazakhstan (%)
Place of birth for the foreign-born population - Nepal (%)
Place of birth for the foreign-born population - Pakistan (%)
Place of birth for the foreign-born population - Sri Lanka (%)
Place of birth for the foreign-born population - Uzbekistan (%)
Place of birth for the foreign-born population - Other South Central Asia (%)
Place of birth for the foreign-born population - Burma (%)
Place of birth for the foreign-born population - Cambodia (%)
Place of birth for the foreign-born population - Indonesia (%)
Place of birth for the foreign-born population - Laos (%)
Place of birth for the foreign-born population - Malaysia (%)
Place of birth for the foreign-born population - Philippines (%)
Place of birth for the foreign-born population - Singapore (%)
Place of birth for the foreign-born population - Thailand (%)
Place of birth for the foreign-born population - Vietnam (%)
Place of birth for the foreign-born population - Other South Eastern Asia (%)
Place of birth for the foreign-born population - Armenia (%)
Place of birth for the foreign-born population - Iraq (%)
Place of birth for the foreign-born population - Israel (%)
Place of birth for the foreign-born population - Jordan (%)
Place of birth for the foreign-born population - Kuwait (%)
Place of birth for the foreign-born population - Lebanon (%)
Place of birth for the foreign-born population - Saudi Arabia (%)
Place of birth for the foreign-born population - Syria (%)
Place of birth for the foreign-born population - Turkey (%)
Place of birth for the foreign-born population - Yemen (%)
Place of birth for the foreign-born population - Other Western Asia (%)
Place of birth for the foreign-born population - Eritrea (%)
Place of birth for the foreign-born population - Ethiopia (%)
Place of birth for the foreign-born population - Kenya (%)
Place of birth for the foreign-born population - Somalia (%)
Place of birth for the foreign-born population - Uganda (%)
Place of birth for the foreign-born population - Zimbabwe (%)
Place of birth for the foreign-born population - Other Eastern Africa (%)
Place of birth for the foreign-born population - Cameroon (%)
Place of birth for the foreign-born population - Congo (%)
Place of birth for the foreign-born population - Democratic Republic of Congo (Zaire) (%)
Place of birth for the foreign-born population - Other Middle Africa (%)
Place of birth for the foreign-born population - Egypt (%)
Place of birth for the foreign-born population - Morocco (%)
Place of birth for the foreign-born population - Sudan (%)
Place of birth for the foreign-born population - Other Northern Africa (%)
Place of birth for the foreign-born population - South Africa (%)
Place of birth for the foreign-born population - Other Southern Africa (%)
Place of birth for the foreign-born population - Cabo Verde (%)
Place of birth for the foreign-born population - Ghana (%)
Place of birth for the foreign-born population - Liberia (%)
Place of birth for the foreign-born population - Nigeria (%)
Place of birth for the foreign-born population - Senegal (%)
Place of birth for the foreign-born population - Sierra Leone (%)
Place of birth for the foreign-born population - Other Western Africa (%)
Place of birth for the foreign-born population - Australia (%)
Place of birth for the foreign-born population - New Zealand (%)
Place of birth for the foreign-born population - Fiji (%)
Place of birth for the foreign-born population - Micronesia (%)
Place of birth for the foreign-born population - Bahamas (%)
Place of birth for the foreign-born population - Barbados (%)
Place of birth for the foreign-born population - Cuba (%)
Place of birth for the foreign-born population - Dominica (%)
Place of birth for the foreign-born population - Dominican Republic (%)
Place of birth for the foreign-born population - Grenada (%)
Place of birth for the foreign-born population - Haiti (%)
Place of birth for the foreign-born population - Jamaica (%)
Place of birth for the foreign-born population - St. Vincent and the Grenadines (%)
Place of birth for the foreign-born population - Trinidad and Tobago (%)
Place of birth for the foreign-born population - West Indies (%)
Place of birth for the foreign-born population - Other Caribbean (%)
Place of birth for the foreign-born population - Belize (%)
Place of birth for the foreign-born population - Costa Rica (%)
Place of birth for the foreign-born population - El Salvador (%)
Place of birth for the foreign-born population - Guatemala (%)
Place of birth for the foreign-born population - Honduras (%)
Place of birth for the foreign-born population - Mexico (%)
Place of birth for the foreign-born population - Nicaragua (%)
Place of birth for the foreign-born population - Panama (%)
Place of birth for the foreign-born population - Other Central America (%)
Place of birth for the foreign-born population - Argentina (%)
Place of birth for the foreign-born population - Bolivia (%)
Place of birth for the foreign-born population - Brazil (%)
Place of birth for the foreign-born population - Chile (%)
Place of birth for the foreign-born population - Colombia (%)
Place of birth for the foreign-born population - Ecuador (%)
Place of birth for the foreign-born population - Guyana (%)
Place of birth for the foreign-born population - Peru (%)
Place of birth for the foreign-born population - Uruguay (%)
Place of birth for the foreign-born population - Venezuela (%)
Place of birth for the foreign-born population - Other South America (%)
Place of birth for the foreign-born population - Canada (%)
Place of birth for the foreign-born population - Other Northern America (%)
Place of birth for the foreign-born population - Other (%)
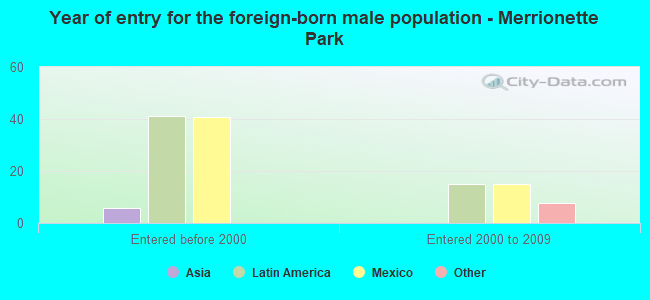
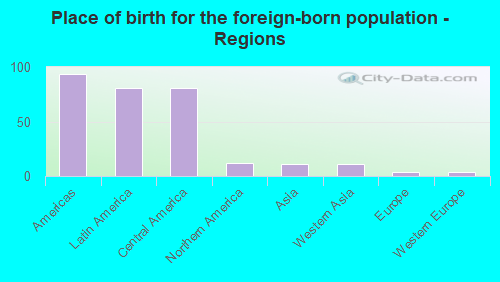
According to 2022 data, the most numerous races in Merrionette Park, IL are White alone (1,289 residents), Hispanic (469 residents), and Black alone (161 residents). 78.3% of Merrionette Park residents speak English at home. 5.6% of Merrionette Park, IL residents are foreign-born (4.1% born in Latin America, 0.6% born in North America), which is 148.3% less than the foreign-born rate of 14.0% across the entire state of Illinois.
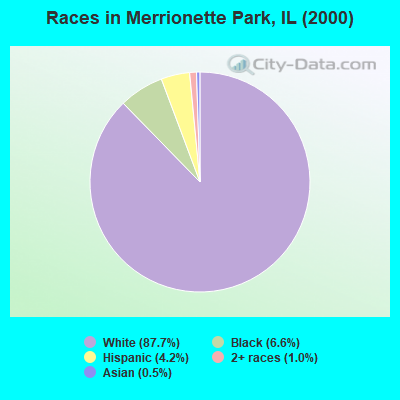
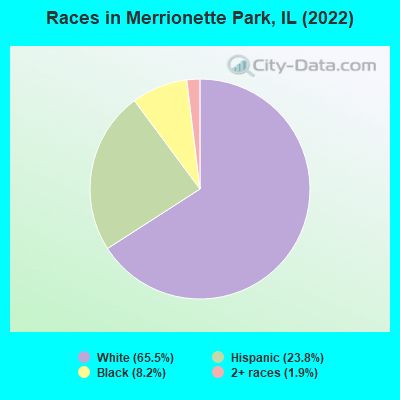
Race distribution in Merrionette Park
2000 2022
8,424,140 67.8% White alone 1,856,152 14.9% Black alone 1,530,262 12.3% Hispanic 419,916 3.4% Asian alone 153,996 1.2% Two or more races 13,479 0.1% Other race alone 18,232 0.1% American Indian alone 3,116 0.03% Native Hawaiian and Other
7,356,301 58.5% White alone 2,299,726 18.3% Hispanic 1,660,423 13.2% Black alone 747,296 5.9% Asian alone 458,599 3.6% Two or more races 45,386 0.4% Other race alone 10,405 0.08% American Indian alone 3,896 0.03% Native Hawaiian and Other
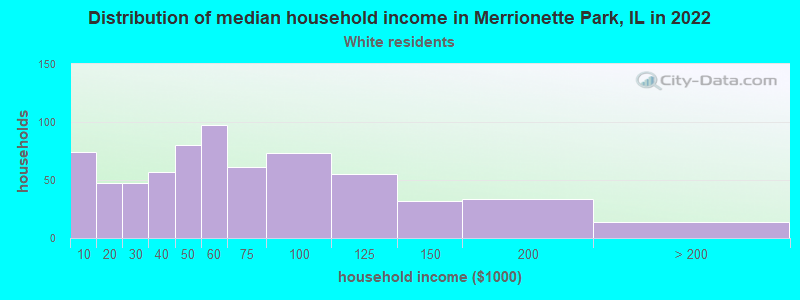
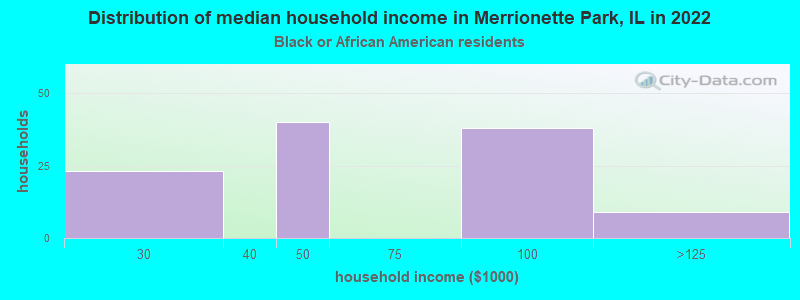
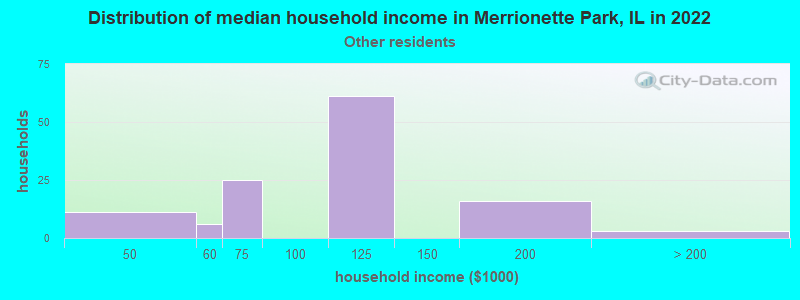
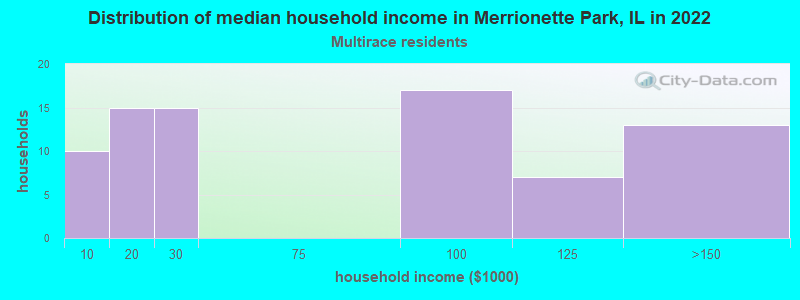
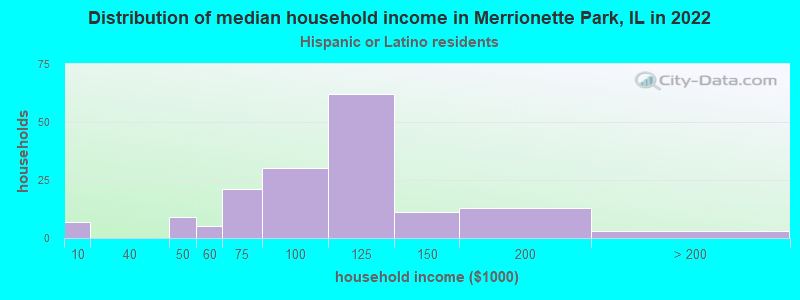
Income and house value in Merrionette Park Median household income in 2022 $49,360 White non-Hispanic householders$46,035 Black householders$116,021 Some other race householders$113,503 Hispanic or Latino race householdersMedian 2022 house value $166,173 White Non-Hispanic householders$172,937 Black or African American householders$172,937 Some other race householders$184,158 Hispanic or Latino householders
Median age by race in Merrionette Park
44.3 Median age for White residents42.2 44.4 31.1 Median age for Black or African American residents31.3 31.8 -680,473,372.1 Median age for American Indian / Alaska Native residents-736,736,736.0 -641,399,416.3 -686,118,478.5 Median age for Asian residents-688,465,031.1 -683,893,194.8 -687,999,999.3 Median age for Native Hawaiian / Pacific Islander residents-918,721,460.3 -610,229,276.3 31.3 Median age for Other race residents48.8 26.6 30.4 Median age for Two or more races residents27.3 36.0 43.3 Median age for White alone residents44.0 43.2 28.6 Median age for Hispanic or Latino residents31.2 22.4
Owner/renter occupied households by race in Merrionette Park
House owners and renters - White residents 567 84.7% Owner occupied102 15.3% Renter occupiedHouse owners and renters - Black or African American residents 5 4.4% Owner occupied109 95.6% Renter occupiedHouse owners and renters - American Indian / Alaska Native residents 23 100.0% Owner occupiedHouse owners and renters - Other race residents 115 100.0% Owner occupiedHouse owners and renters - Two or more races residents 82 100.0% Owner occupiedHouse owners and renters - White alone residents 585 83.8% Owner occupied113 16.2% Renter occupiedHouse owners and renters - Hispanic or Latino residents 160 100.0% Owner occupied
Language usage in Merrionette Park
English speakers - Total 78.3% of residents of Merrionette Park speak English at home.
14.3% of residents speak Spanish at home 208 77.3% Speak English very well61 22.7% Speak English less than very well6.8% of residents speak other language at home 112 88.2% Speak English very well15 11.8% Speak English less than very well
All residents speak only English at home
English speakers - Native, born elsewhere 0.0% of residents of Merrionette Park speak English at home.
100.0% of residents speak Spanish at home 13 100.0% Speak English very well
English speakers - Foreign-born 14.4% of residents of Merrionette Park speak English at home.
73.9% of residents speak Spanish at home 22 26.8% Speak English very well60 73.2% Speak English less than very well9.0% of residents speak other language at home 5 50.0% Speak English very well5 50.0% Speak English less than very well
White (Caucasian) - Speak only English Native:
95.3% (1,164)Foreign-born:
45.9% (14)
White (Caucasian) - Speak another language Native:
6.6% (80)Foreign-born:
56.5% (18)
Other race - Speak another language Native:
74.7% (127)Foreign-born:
100.0% (41)
Two or more races - Speak another language Native:
40.3% (64)Foreign-born:
100.0% (17)
White alone - Speak only English Native:
90.9% (1,121)Foreign-born:
54.8% (16)
White alone - Speak another language Native:
9.2% (114)Foreign-born:
40.7% (12)
Hispanic or Latino - Speak another language Native:
52.5% (166)Foreign-born:
100.0% (82)
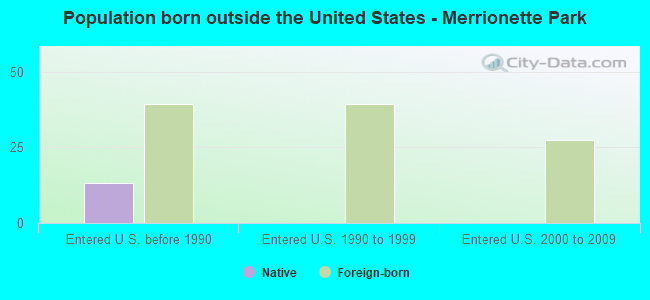
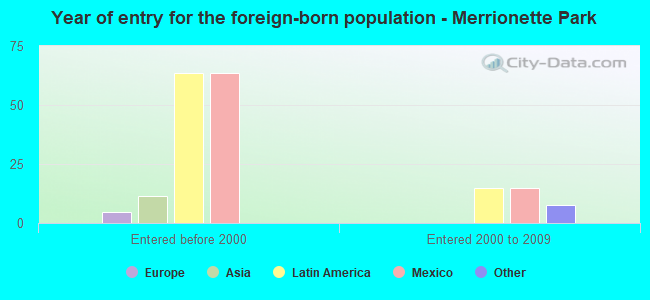
Foreign-born residents in Merrionette Park 111 residents are foreign born (4.1% Latin America , 0.6% North America ).
This city:
5.6%Illinois:
14.1%
Marital status for residents in Merrionette Park Marital status - White (Caucasian) population 15 years and over
Males 55.9% Never married28.4% Now married1.5% Separated5.3% Widowed9.0% DivorcedFemales 41.3% Never married28.1% Now married2.5% Separated10.4% Widowed17.6% DivorcedWomen who did not give birth in the past 12 months Now married:
33.4% (129)Unmarried:
66.6% (257)
Marital status - Black or African American population 15 years and over
Males 67.8% Never married32.2% Now married0.0% Separated0.0% Widowed0.0% DivorcedFemales 65.8% Never married22.4% Now married0.0% Separated0.0% Widowed11.8% DivorcedWomen who did not give birth in the past 12 months Now married:
28.6% (9)Unmarried:
71.4% (24)
Marital status - American Indian / Alaska Native population 15 years and over
Males 0.0% Never married100.0% Now married0.0% Separated0.0% Widowed0.0% DivorcedFemales 0.0% Never married100.0% Now married0.0% Separated0.0% Widowed0.0% DivorcedMarital status - Other race population 15 years and over
Males 17.7% Never married43.8% Now married0.0% Separated5.2% Widowed33.3% DivorcedFemales 76.7% Never married23.3% Now married0.0% Separated0.0% Widowed0.0% DivorcedWomen who gave birth in the past 12 months Now married:
0.0% (0)Unmarried:
100.0% (17)
Women who did not give birth in the past 12 months Now married:
21.2% (12)Unmarried:
78.8% (46)
Marital status - Two or more races population 15 years and over
Males 75.0% Never married25.0% Now married0.0% Separated0.0% Widowed0.0% DivorcedFemales 61.0% Never married0.0% Now married0.0% Separated0.0% Widowed39.0% DivorcedWomen who did not give birth in the past 12 months Now married:
0.0% (0)Unmarried:
100.0% (28)
Marital status - White alone, not Hispanic / Latino population 15 years and over
Males 55.6% Never married26.8% Now married1.6% Separated5.9% Widowed10.0% DivorcedFemales 41.6% Never married27.5% Now married2.6% Separated10.5% Widowed17.8% DivorcedWomen who did not give birth in the past 12 months Now married:
32.5% (139)Unmarried:
67.5% (288)
Marital status - Hispanic or Latino population 15 years and over
Males 43.9% Never married39.5% Now married0.0% Separated2.2% Widowed14.3% DivorcedFemales 61.9% Never married32.4% Now married0.0% Separated0.0% Widowed5.7% DivorcedWomen who gave birth in the past 12 months Now married:
0.0% (0)Unmarried:
100.0% (15)
Women who did not give birth in the past 12 months Now married:
23.3% (17)Unmarried:
76.7% (56)
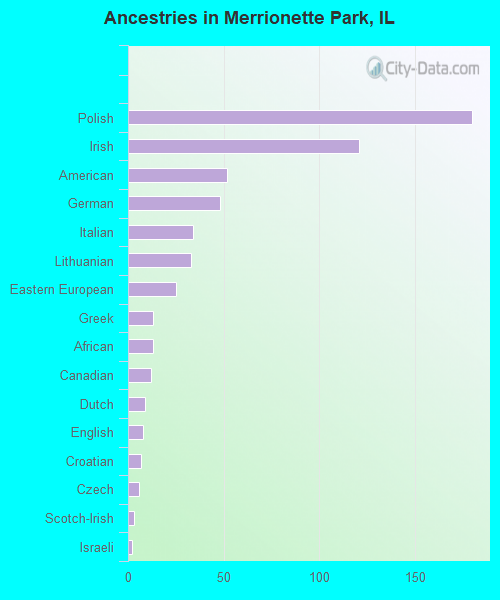
Ancestries in Merrionette Park
180 19.0% Polish121 12.8% Irish52 5.5% American48 5.1% German34 3.6% Italian33 3.5% Lithuanian25 2.6% Eastern European13 1.4% Greek13 1.4% African12 1.3% Canadian9 1.0% Dutch8 0.8% English7 0.7% Croatian6 0.6% Czech3 0.3% Scotch-Irish2 0.2% Israeli
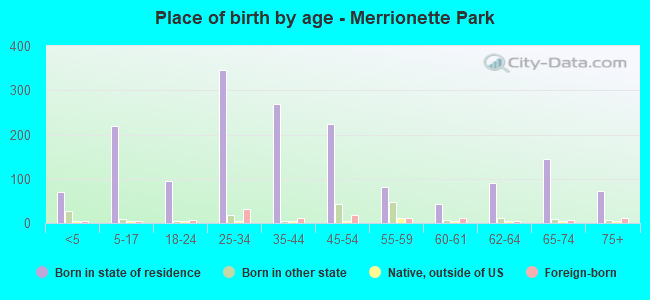
Children Nativity (place of birth) in Merrionette Park
Children under 6 years - Living with two parents Both parents native 6 100.0% NativeOne native, one foreign-born parent 18 100.0% NativeChildren under 6 years - Living with one parent Native parent 80 100.0% Native
Children 6 to 17 years - Living with two parents Both parents native 111 100.0% NativeBoth parents foreign-born 6 100.0% NativeChildren 6 to 17 years - Living with one parent Native parent 100 100.0% Native
Grandparents responsible for own grandchildren in Merrionette Park
Grandparents (30 to 59 years) White / Caucasian 4 100.0% Not responsible for grandchildrenOther race 12 100.0% Responsible for grandchildrenWhite alone, not Hispanic / Latino 4 100.0% Not responsible for grandchildrenHispanic or Latino 8 100.0% Responsible for grandchildren
Grandparents (60 years and over) White / Caucasian 5 100.0% Responsible for grandchildrenWhite alone, not Hispanic / Latino 6 100.0% Responsible for grandchildren