Races in Midvale, Utah (UT) Detailed Stats
Data:
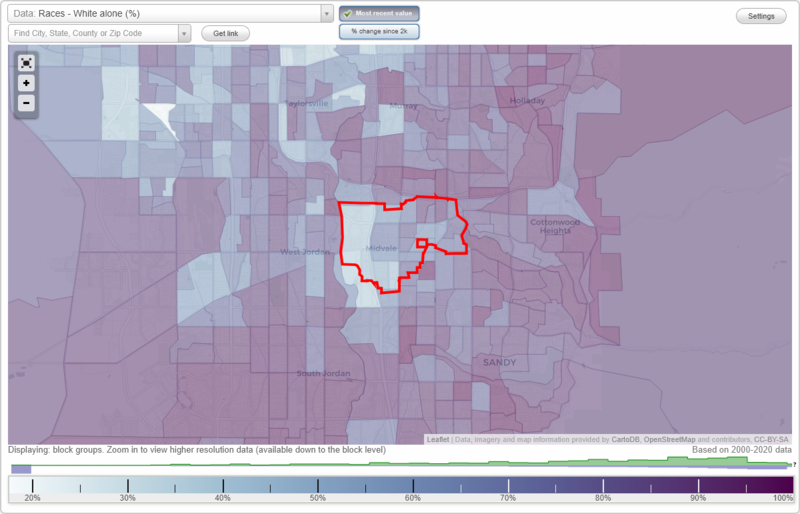
Races - White alone (%)
Races - White alone (% change since 2000)
Races - Black alone (%)
Races - Black alone (% change since 2000)
Races - American Indian alone (%)
Races - American Indian alone (% change since 2000)
Races - Asian alone (%)
Races - Asian alone (% change since 2000)
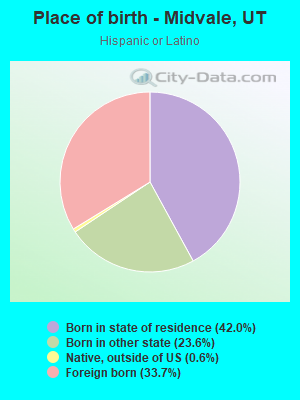
Races - Hispanic (%)
Races - Hispanic (% change since 2000)
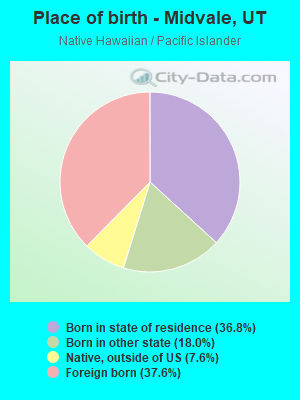
Races - Native Hawaiian and Other Pacific Islander alone (%)
Races - Native Hawaiian and Other Pacific Islander alone (% change since 2000)
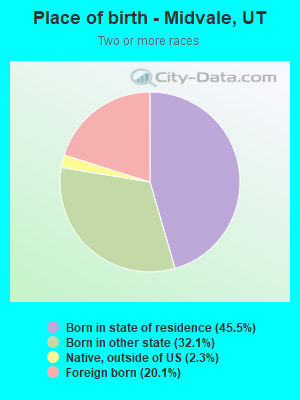
Races - Two or more races(%)
Races - Two or more races(% change since 2000)
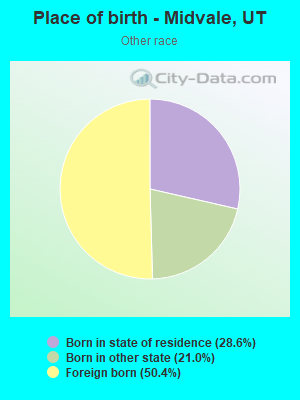
Races - Other race alone (%)
Races - Other race alone (% change since 2000)
Racial diversity
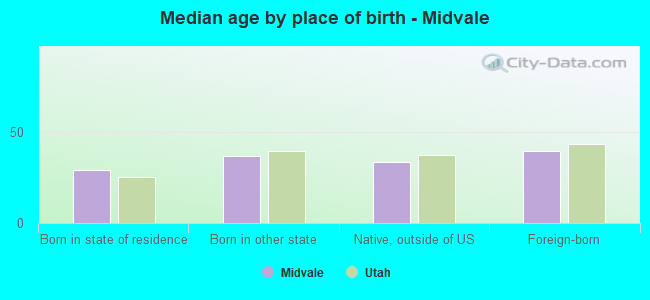
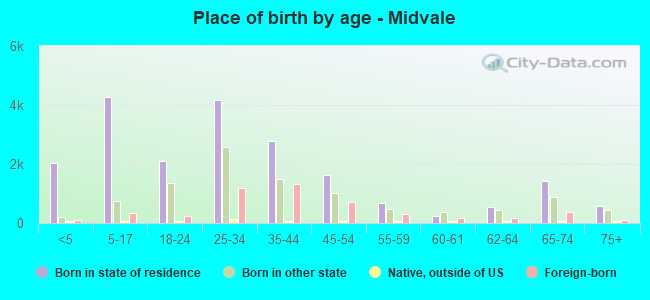
Place of birth - Born in state of residence (%)
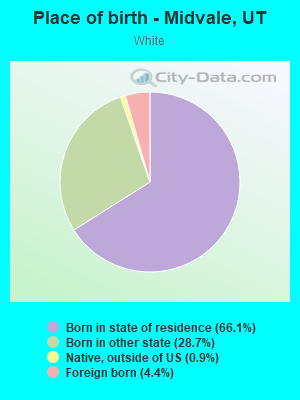
Place of birth - Born in state of residence (%) - White
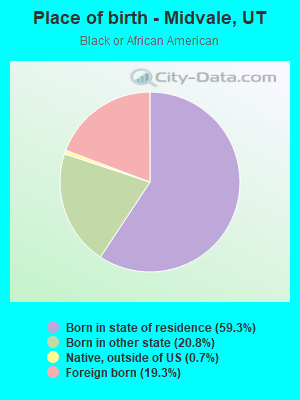
Place of birth - Born in state of residence (%) - Black or African American
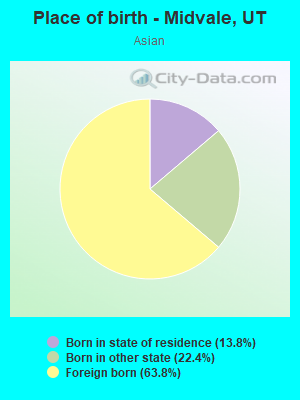
Place of birth - Born in state of residence (%) - Asian
Place of birth - Born in state of residence (%) - Hispanic or Latino
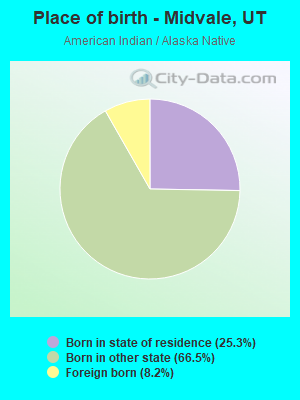
Place of birth - Born in state of residence (%) - American Indian and Alaska Native
Place of birth - Born in state of residence (%) - Multirace
Place of birth - Born in state of residence (%) - Other Race
Place of birth - Born in other state (%)
Place of birth - Born in other state (%) - White
Place of birth - Born in other state (%) - Black or African American
Place of birth - Born in other state (%) - Asian
Place of birth - Born in other state (%) - Hispanic or Latino
Place of birth - Born in other state (%) - American Indian and Alaska Native
Place of birth - Born in other state (%) - Multirace
Place of birth - Born in other state (%) - Other Race
Place of birth - Native, outside of US (%)
Place of birth - Native, outside of US (%) - White
Place of birth - Native, outside of US (%) - Black or African American
Place of birth - Native, outside of US (%) - Asian
Place of birth - Native, outside of US (%) - Hispanic or Latino
Place of birth - Native, outside of US (%) - American Indian and Alaska Native
Place of birth - Native, outside of US (%) - Multirace
Place of birth - Native, outside of US (%) - Other Race
Place of birth - Foreign born (%)
Place of birth - Foreign born (%) - White
Place of birth - Foreign born (%) - Black or African American
Place of birth - Foreign born (%) - Asian
Place of birth - Foreign born (%) - Hispanic or Latino
Place of birth - Foreign born (%) - American Indian and Alaska Native
Place of birth - Foreign born (%) - Multirace
Place of birth - Foreign born (%) - Other Race
Residents speaking English at home (%)
Residents speaking English at home - Born in the United States (%)
Residents speaking English at home - Native, born elsewhere (%)
Residents speaking English at home - Foreign born (%)
Residents speaking Spanish at home (%)
Residents speaking Spanish at home - Born in the United States (%)
Residents speaking Spanish at home - Native, born elsewhere (%)
Residents speaking Spanish at home - Foreign born (%)
Residents speaking other language at home (%)
Residents speaking other language at home - Born in the United States (%)
Residents speaking other language at home - Native, born elsewhere (%)
Residents speaking other language at home - Foreign born (%)
Marital status - Never married (%)
Marital status - Now married (%)
Marital status - Separated (%)
Marital status - Widowed (%)
Marital status - Divorced (%)
Ancestries Reported - Arab (%)
Ancestries Reported - Czech (%)
Ancestries Reported - Danish (%)
Ancestries Reported - Dutch (%)
Ancestries Reported - English (%)
Ancestries Reported - French (%)
Ancestries Reported - French Canadian (%)
Ancestries Reported - German (%)
Ancestries Reported - Greek (%)
Ancestries Reported - Hungarian (%)
Ancestries Reported - Irish (%)
Ancestries Reported - Italian (%)
Ancestries Reported - Lithuanian (%)
Ancestries Reported - Norwegian (%)
Ancestries Reported - Polish (%)
Ancestries Reported - Portuguese (%)
Ancestries Reported - Russian (%)
Ancestries Reported - Scotch-Irish (%)
Ancestries Reported - Scottish (%)
Ancestries Reported - Slovak (%)
Ancestries Reported - Subsaharan African (%)
Ancestries Reported - Swedish (%)
Ancestries Reported - Swiss (%)
Ancestries Reported - Ukrainian (%)
Ancestries Reported - United States (%)
Ancestries Reported - Welsh (%)
Ancestries Reported - West Indian (%)
Ancestries Reported - Other (%)
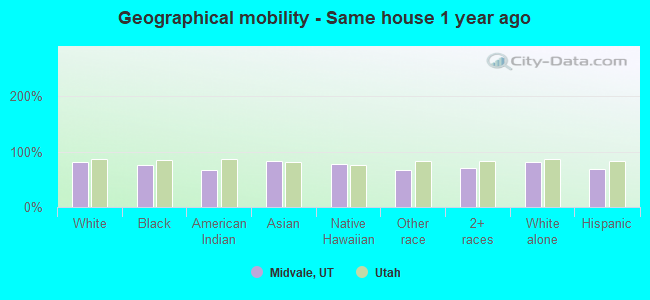
Geographical mobility - Same house 1 year ago (%)
Geographical mobility - Same house 1 year ago (%) - White
Geographical mobility - Same house 1 year ago (%) - Black or African American
Geographical mobility - Same house 1 year ago (%) - Asian
Geographical mobility - Same house 1 year ago (%) - Hispanic or Latino
Geographical mobility - Same house 1 year ago (%) - American Indian and Alaska Native
Geographical mobility - Same house 1 year ago (%) - Multirace
Geographical mobility - Same house 1 year ago (%) - Other Race
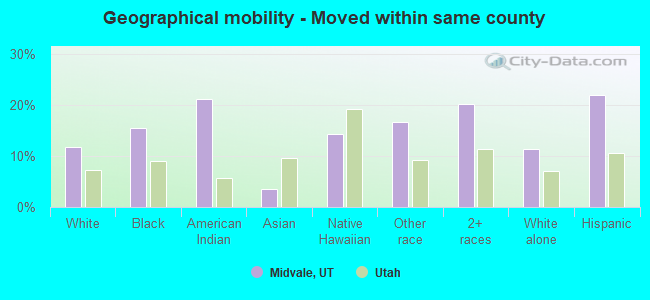
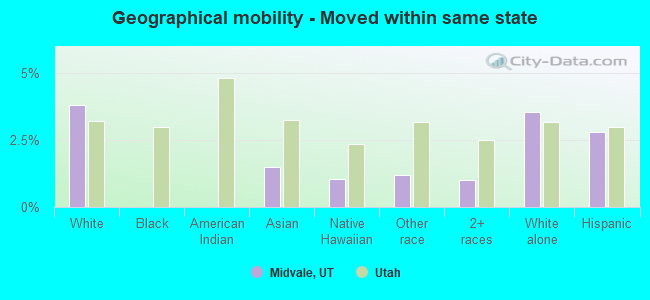
Geographical mobility - Moved within same county (%)
Geographical mobility - Moved within same county (%) - White
Geographical mobility - Moved within same county (%) - Black or African American
Geographical mobility - Moved within same county (%) - Asian
Geographical mobility - Moved within same county (%) - Hispanic or Latino
Geographical mobility - Moved within same county (%) - American Indian and Alaska Native
Geographical mobility - Moved within same county (%) - Multirace
Geographical mobility - Moved within same county (%) - Other Race
Geographical mobility - Moved from different county within same state (%)
Geographical mobility - Moved from different county within same state (%) - White
Geographical mobility - Moved from different county within same state (%) - Black or African American
Geographical mobility - Moved from different county within same state (%) - Asian
Geographical mobility - Moved from different county within same state (%) - Hispanic or Latino
Geographical mobility - Moved from different county within same state (%) - American Indian and Alaska Native
Geographical mobility - Moved from different county within same state (%) - Multirace
Geographical mobility - Moved from different county within same state (%) - Other Race
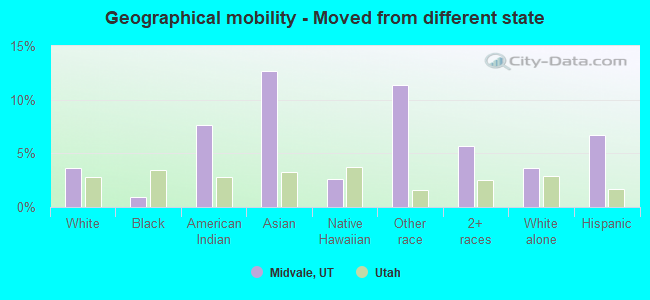
Geographical mobility - Moved from different state (%)
Geographical mobility - Moved from different state (%) - White
Geographical mobility - Moved from different state (%) - Black or African American
Geographical mobility - Moved from different state (%) - Asian
Geographical mobility - Moved from different state (%) - Hispanic or Latino
Geographical mobility - Moved from different state (%) - American Indian and Alaska Native
Geographical mobility - Moved from different state (%) - Multirace
Geographical mobility - Moved from different state (%) - Other Race
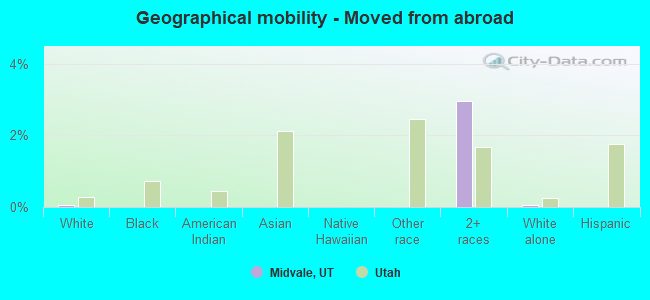
Geographical mobility - Moved from abroad (%)
Geographical mobility - Moved from abroad (%) - White
Geographical mobility - Moved from abroad (%) - Black or African American
Geographical mobility - Moved from abroad (%) - Asian
Geographical mobility - Moved from abroad (%) - Hispanic or Latino
Geographical mobility - Moved from abroad (%) - American Indian and Alaska Native
Geographical mobility - Moved from abroad (%) - Multirace
Geographical mobility - Moved from abroad (%) - Other Race
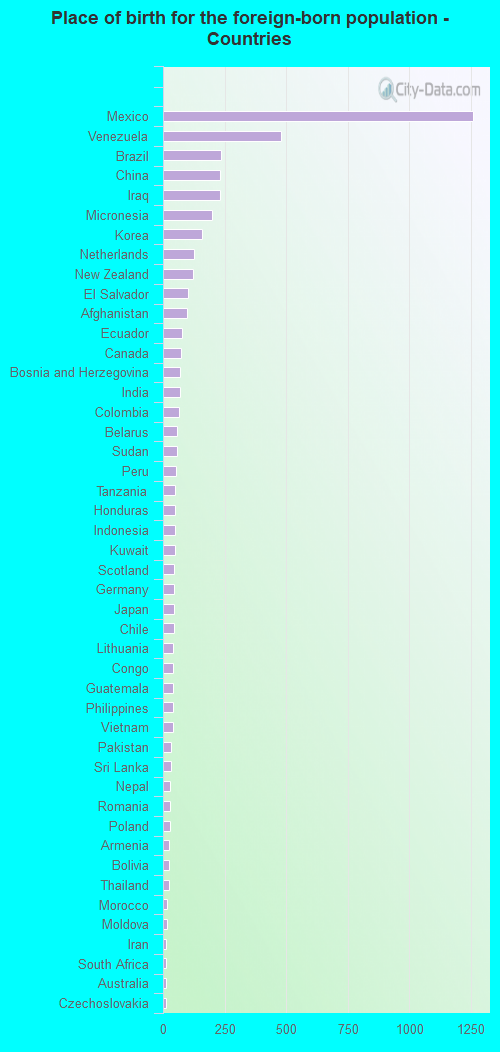
Place of birth for the foreign-born population - Ireland (%)
Place of birth for the foreign-born population - Denmark (%)
Place of birth for the foreign-born population - Norway (%)
Place of birth for the foreign-born population - Sweden (%)
Place of birth for the foreign-born population - United Kingdom (%)
Place of birth for the foreign-born population - England (%)
Place of birth for the foreign-born population - Scotland (%)
Place of birth for the foreign-born population - Other Northern Europe (%)
Place of birth for the foreign-born population - Austria (%)
Place of birth for the foreign-born population - Belgium (%)
Place of birth for the foreign-born population - France (%)
Place of birth for the foreign-born population - Germany (%)
Place of birth for the foreign-born population - Netherlands (%)
Place of birth for the foreign-born population - Switzerland (%)
Place of birth for the foreign-born population - Other Western Europe (%)
Place of birth for the foreign-born population - Greece (%)
Place of birth for the foreign-born population - Italy (%)
Place of birth for the foreign-born population - Portugal (%)
Place of birth for the foreign-born population - Spain (%)
Place of birth for the foreign-born population - Other Southern Europe (%)
Place of birth for the foreign-born population - Albania (%)
Place of birth for the foreign-born population - Belarus (%)
Place of birth for the foreign-born population - Bosnia and Herzegovina (%)
Place of birth for the foreign-born population - Bulgaria (%)
Place of birth for the foreign-born population - Croatia (%)
Place of birth for the foreign-born population - Czechoslovakia (%)
Place of birth for the foreign-born population - Hungary (%)
Place of birth for the foreign-born population - Latvia (%)
Place of birth for the foreign-born population - Lithuania (%)
Place of birth for the foreign-born population - North Macedonia (Macedonia) (%)
Place of birth for the foreign-born population - Moldova (%)
Place of birth for the foreign-born population - Poland (%)
Place of birth for the foreign-born population - Romania (%)
Place of birth for the foreign-born population - Russia (%)
Place of birth for the foreign-born population - Serbia (%)
Place of birth for the foreign-born population - Ukraine (%)
Place of birth for the foreign-born population - Other Eastern Europe (%)
Place of birth for the foreign-born population - China (%)
Place of birth for the foreign-born population - Hong Kong (%)
Place of birth for the foreign-born population - Taiwan (%)
Place of birth for the foreign-born population - Japan (%)
Place of birth for the foreign-born population - Korea (%)
Place of birth for the foreign-born population - Other Eastern Asia (%)
Place of birth for the foreign-born population - Afghanistan (%)
Place of birth for the foreign-born population - Bangladesh (%)
Place of birth for the foreign-born population - India (%)
Place of birth for the foreign-born population - Iran (%)
Place of birth for the foreign-born population - Kazakhstan (%)
Place of birth for the foreign-born population - Nepal (%)
Place of birth for the foreign-born population - Pakistan (%)
Place of birth for the foreign-born population - Sri Lanka (%)
Place of birth for the foreign-born population - Uzbekistan (%)
Place of birth for the foreign-born population - Other South Central Asia (%)
Place of birth for the foreign-born population - Burma (%)
Place of birth for the foreign-born population - Cambodia (%)
Place of birth for the foreign-born population - Indonesia (%)
Place of birth for the foreign-born population - Laos (%)
Place of birth for the foreign-born population - Malaysia (%)
Place of birth for the foreign-born population - Philippines (%)
Place of birth for the foreign-born population - Singapore (%)
Place of birth for the foreign-born population - Thailand (%)
Place of birth for the foreign-born population - Vietnam (%)
Place of birth for the foreign-born population - Other South Eastern Asia (%)
Place of birth for the foreign-born population - Armenia (%)
Place of birth for the foreign-born population - Iraq (%)
Place of birth for the foreign-born population - Israel (%)
Place of birth for the foreign-born population - Jordan (%)
Place of birth for the foreign-born population - Kuwait (%)
Place of birth for the foreign-born population - Lebanon (%)
Place of birth for the foreign-born population - Saudi Arabia (%)
Place of birth for the foreign-born population - Syria (%)
Place of birth for the foreign-born population - Turkey (%)
Place of birth for the foreign-born population - Yemen (%)
Place of birth for the foreign-born population - Other Western Asia (%)
Place of birth for the foreign-born population - Eritrea (%)
Place of birth for the foreign-born population - Ethiopia (%)
Place of birth for the foreign-born population - Kenya (%)
Place of birth for the foreign-born population - Somalia (%)
Place of birth for the foreign-born population - Uganda (%)
Place of birth for the foreign-born population - Zimbabwe (%)
Place of birth for the foreign-born population - Other Eastern Africa (%)
Place of birth for the foreign-born population - Cameroon (%)
Place of birth for the foreign-born population - Congo (%)
Place of birth for the foreign-born population - Democratic Republic of Congo (Zaire) (%)
Place of birth for the foreign-born population - Other Middle Africa (%)
Place of birth for the foreign-born population - Egypt (%)
Place of birth for the foreign-born population - Morocco (%)
Place of birth for the foreign-born population - Sudan (%)
Place of birth for the foreign-born population - Other Northern Africa (%)
Place of birth for the foreign-born population - South Africa (%)
Place of birth for the foreign-born population - Other Southern Africa (%)
Place of birth for the foreign-born population - Cabo Verde (%)
Place of birth for the foreign-born population - Ghana (%)
Place of birth for the foreign-born population - Liberia (%)
Place of birth for the foreign-born population - Nigeria (%)
Place of birth for the foreign-born population - Senegal (%)
Place of birth for the foreign-born population - Sierra Leone (%)
Place of birth for the foreign-born population - Other Western Africa (%)
Place of birth for the foreign-born population - Australia (%)
Place of birth for the foreign-born population - New Zealand (%)
Place of birth for the foreign-born population - Fiji (%)
Place of birth for the foreign-born population - Micronesia (%)
Place of birth for the foreign-born population - Bahamas (%)
Place of birth for the foreign-born population - Barbados (%)
Place of birth for the foreign-born population - Cuba (%)
Place of birth for the foreign-born population - Dominica (%)
Place of birth for the foreign-born population - Dominican Republic (%)
Place of birth for the foreign-born population - Grenada (%)
Place of birth for the foreign-born population - Haiti (%)
Place of birth for the foreign-born population - Jamaica (%)
Place of birth for the foreign-born population - St. Vincent and the Grenadines (%)
Place of birth for the foreign-born population - Trinidad and Tobago (%)
Place of birth for the foreign-born population - West Indies (%)
Place of birth for the foreign-born population - Other Caribbean (%)
Place of birth for the foreign-born population - Belize (%)
Place of birth for the foreign-born population - Costa Rica (%)
Place of birth for the foreign-born population - El Salvador (%)
Place of birth for the foreign-born population - Guatemala (%)
Place of birth for the foreign-born population - Honduras (%)
Place of birth for the foreign-born population - Mexico (%)
Place of birth for the foreign-born population - Nicaragua (%)
Place of birth for the foreign-born population - Panama (%)
Place of birth for the foreign-born population - Other Central America (%)
Place of birth for the foreign-born population - Argentina (%)
Place of birth for the foreign-born population - Bolivia (%)
Place of birth for the foreign-born population - Brazil (%)
Place of birth for the foreign-born population - Chile (%)
Place of birth for the foreign-born population - Colombia (%)
Place of birth for the foreign-born population - Ecuador (%)
Place of birth for the foreign-born population - Guyana (%)
Place of birth for the foreign-born population - Peru (%)
Place of birth for the foreign-born population - Uruguay (%)
Place of birth for the foreign-born population - Venezuela (%)
Place of birth for the foreign-born population - Other South America (%)
Place of birth for the foreign-born population - Canada (%)
Place of birth for the foreign-born population - Other Northern America (%)
Place of birth for the foreign-born population - Other (%)
Latest news about races in Midvale, UT collected exclusively by city-data.com from local newspapers, TV, and radio stations
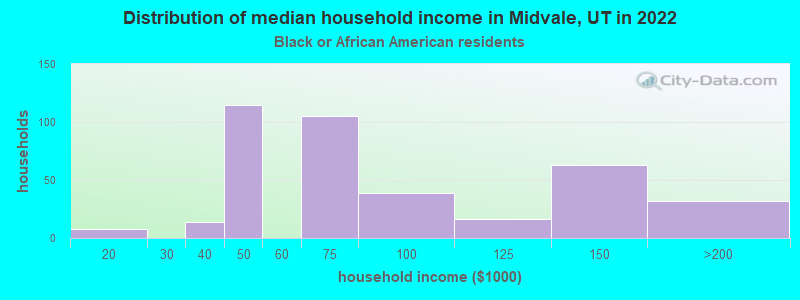
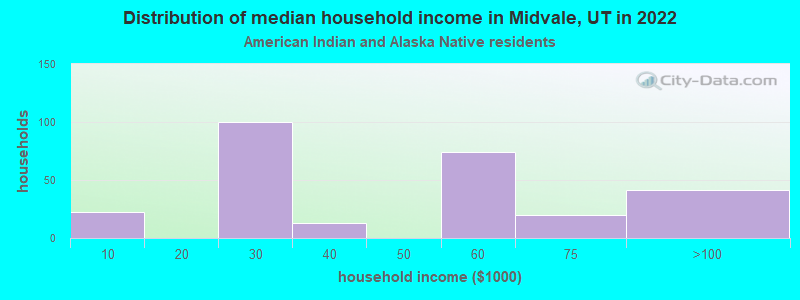
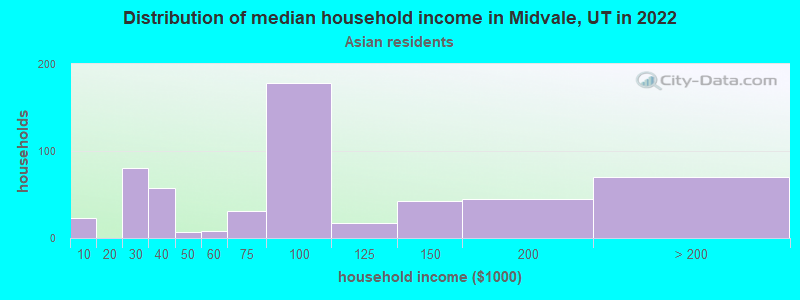
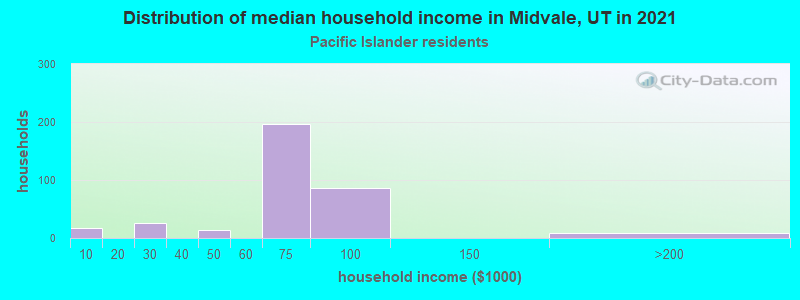
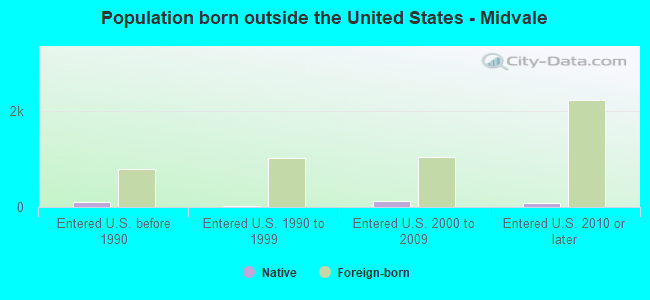
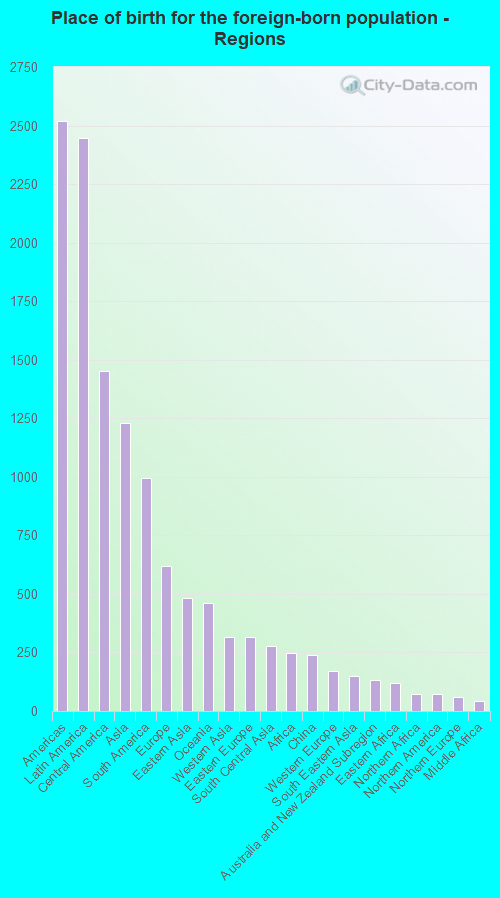
According to 2022 data, the most numerous races in Midvale, UT are White alone (23,332 residents), Hispanic (6,452 residents), and Two or more races (2,437 residents). 77.3% of Midvale residents speak English at home. 14.2% of Midvale, UT residents are foreign-born (6.5% born in Latin America, 3.3% born in Asia, 1.6% born in Europe), which is 43.7% greater than the foreign-born rate of 8.0% across the entire state of Utah.
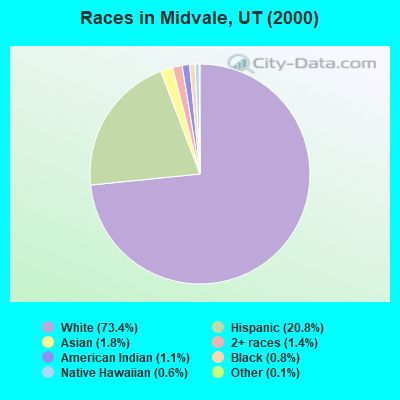
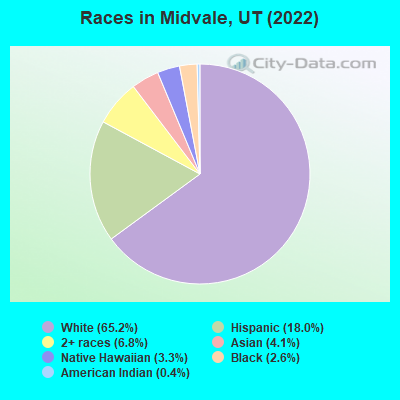
Race distribution in Midvale
2000 2022
1,904,265 85.3% White alone 201,559 9.0% Hispanic 36,483 1.6% Asian alone 31,308 1.4% Two or more races 26,663 1.2% American Indian alone 14,806 0.7% Native Hawaiian and Other 16,137 0.7% Black alone 1,948 0.09% Other race alone
2,557,466 75.6% White alone 512,086 15.1% Hispanic 119,308 3.5% Two or more races 82,388 2.4% Asian alone 36,978 1.1% Native Hawaiian and Other 34,873 1.0% Black alone 22,803 0.7% American Indian alone 14,898 0.4% Other race alone
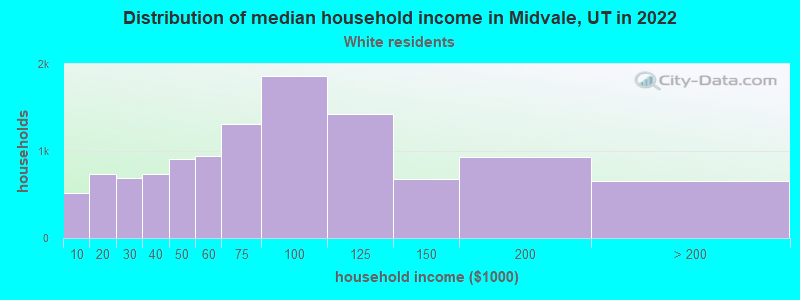
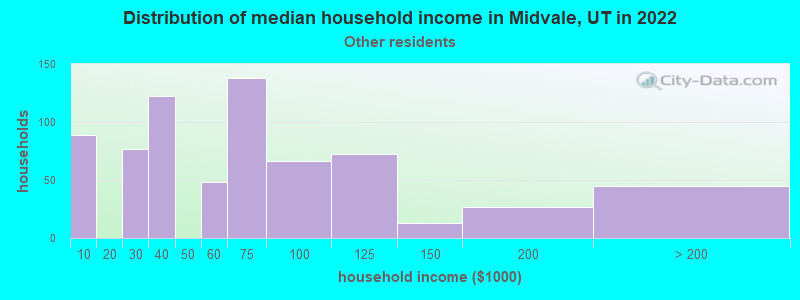
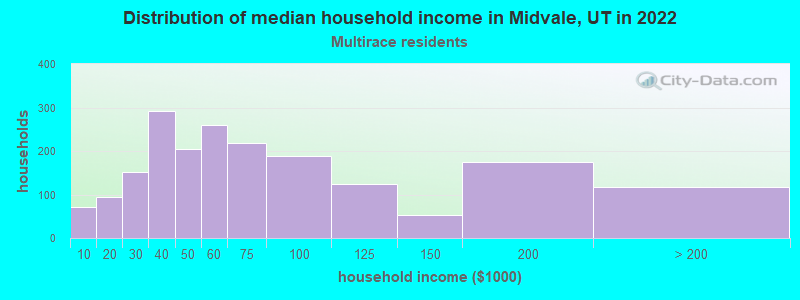
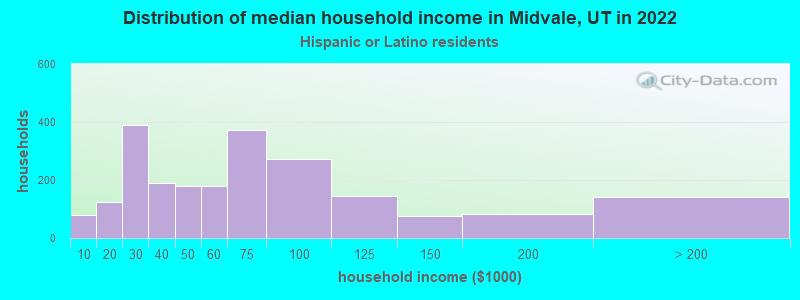
Income and house value in Midvale Median household income in 2022 $75,483 White non-Hispanic householders$92,214 Black householders$60,602 American Indian and Alaska Native householders$87,454 Asian householders$64,444 Native Hawaiian and other Pacific Islander householders$68,868 Some other race householders$53,279 Two or more races householders$55,562 Hispanic or Latino race householdersMedian 2022 house value $441,696 White Non-Hispanic householders$502,982 Black or African American householders$502,982 American Indian or Alaska Native householders $452,839 Asian householders$348,218 Some other race householders$425,600 Two or more races householders$352,552 Hispanic or Latino householders
Median age by race in Midvale
35.1 Median age for White residents34.0 36.0 27.0 Median age for Black or African American residents31.8 22.8 35.7 Median age for American Indian / Alaska Native residents36.5 25.8 34.0 Median age for Asian residents34.7 30.3 30.8 Median age for Native Hawaiian / Pacific Islander residents8.6 34.1 31.0 Median age for Other race residents27.4 33.6 30.9 Median age for Two or more races residents31.0 29.3 35.5 Median age for White alone residents34.5 36.6 29.2 Median age for Hispanic or Latino residents26.1 29.9
Owner/renter occupied households by race in Midvale
House owners and renters - White residents 5,892 51.3% Owner occupied5,598 48.7% Renter occupiedHouse owners and renters - Black or African American residents 111 34.6% Owner occupied209 65.4% Renter occupiedHouse owners and renters - American Indian / Alaska Native residents 50 21.4% Owner occupied182 78.6% Renter occupiedHouse owners and renters - Asian residents 166 28.6% Owner occupied416 71.4% Renter occupiedHouse owners and renters - Native Hawaiian / Pacific Islander residents 364 100.0% Renter occupiedHouse owners and renters - Other race residents 204 29.6% Owner occupied486 70.4% Renter occupiedHouse owners and renters - Two or more races residents 576 29.5% Owner occupied1,374 70.5% Renter occupiedHouse owners and renters - White alone residents 5,705 52.5% Owner occupied5,171 47.5% Renter occupiedHouse owners and renters - Hispanic or Latino residents 621 27.4% Owner occupied1,643 72.6% Renter occupied
Language usage in Midvale
English speakers - Total 77.3% of residents of Midvale speak English at home.
12.8% of residents speak Spanish at home 2,487 58.1% Speak English very well1,792 41.9% Speak English less than very well10.1% of residents speak other language at home 2,127 62.8% Speak English very well1,260 37.2% Speak English less than very well
English speakers - Born in the United States 85.1% of residents of Midvale speak English at home.
11.1% of residents speak Spanish at home 800 74.2% Speak English very well278 25.8% Speak English less than very well4.1% of residents speak other language at home 288 72.5% Speak English very well109 27.5% Speak English less than very well
English speakers - Native, born elsewhere 55.4% of residents of Midvale speak English at home.
14.9% of residents speak Spanish at home 43 84.3% Speak English very well8 15.7% Speak English less than very well35.0% of residents speak other language at home 120 100.0% Speak English very well
English speakers - Foreign-born 18.0% of residents of Midvale speak English at home.
40.1% of residents speak Spanish at home 745 37.5% Speak English very well1,240 62.5% Speak English less than very well42.1% of residents speak other language at home 978 46.9% Speak English very well1,108 53.1% Speak English less than very well
White (Caucasian) - Speak only English Native:
95.0% (20,983)Foreign-born:
31.9% (341)
White (Caucasian) - Speak another language Native:
4.9% (1,083)Foreign-born:
67.7% (724)
Black or African American - Speak another language Native:
38.9% (283)Foreign-born:
92.8% (195)
American Indian / Alaska Native - Speak another language Native:
59.5% (208)Foreign-born:
94.0% (31)
Asian - Speak only English Native:
41.5% (193)Foreign-born:
11.5% (108)
Asian - Speak another language Native:
61.1% (284)Foreign-born:
88.1% (827)
Native Hawaiian / Pacific Islander - Speak only English Native:
59.8% (427)Foreign-born:
47.8% (189)
Native Hawaiian / Pacific Islander - Speak another language Native:
39.8% (285)Foreign-born:
33.9% (134)
Other race - Speak only English Native:
18.1% (195)Foreign-born:
3.7% (45)
Other race - Speak another language Native:
84.0% (905)Foreign-born:
94.1% (1,166)
Two or more races - Speak only English Native:
80.9% (2,727)Foreign-born:
7.6% (76)
Two or more races - Speak another language Native:
19.0% (641)Foreign-born:
93.4% (938)
White alone - Speak only English Native:
96.7% (20,371)Foreign-born:
35.2% (330)
White alone - Speak another language Native:
3.3% (704)Foreign-born:
65.2% (610)
Hispanic or Latino - Speak only English Native:
50.8% (1,943)Foreign-born:
8.7% (189)
Hispanic or Latino - Speak another language Native:
49.0% (1,875)Foreign-born:
91.4% (1,982)
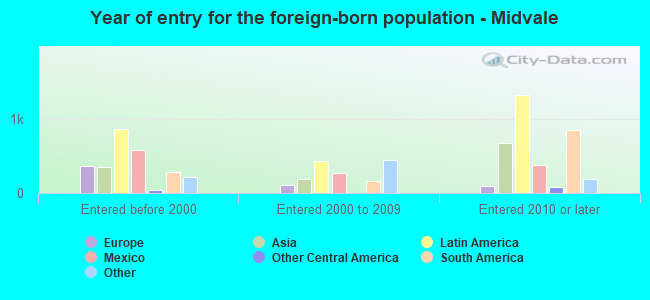
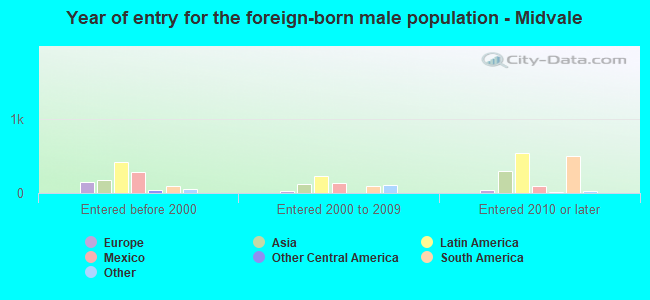
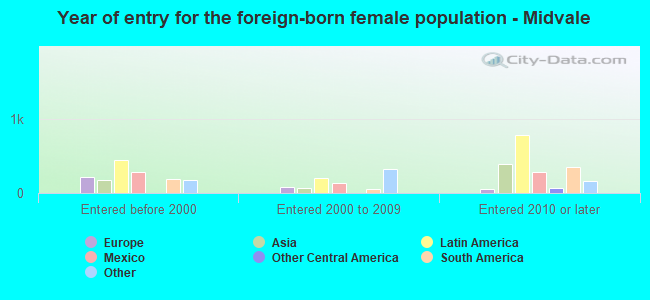
Foreign-born residents in Midvale 5,081 residents are foreign born (6.5% Latin America , 3.3% Asia , 1.6% Europe ).
Marital status for residents in Midvale Marital status - White (Caucasian) population 15 years and over
Males 42.3% Never married41.7% Now married0.4% Separated2.3% Widowed13.3% DivorcedFemales 31.9% Never married41.9% Now married0.6% Separated6.5% Widowed19.1% DivorcedWomen who gave birth in the past 12 months Now married:
51.0% (152)Unmarried:
49.0% (147)
Women who did not give birth in the past 12 months Now married:
41.4% (2,685)Unmarried:
58.6% (3,802)
Marital status - Black or African American population 15 years and over
Males 25.6% Never married37.6% Now married0.0% Separated0.0% Widowed36.8% DivorcedFemales 61.0% Never married34.3% Now married0.0% Separated4.7% Widowed0.0% DivorcedWomen who gave birth in the past 12 months Now married:
100.0% (38)Unmarried:
0.0% (0)
Women who did not give birth in the past 12 months Now married:
24.6% (52)Unmarried:
75.4% (160)
Marital status - American Indian / Alaska Native population 15 years and over
Males 41.8% Never married48.9% Now married0.0% Separated0.0% Widowed9.2% DivorcedFemales 58.1% Never married26.2% Now married0.0% Separated15.6% Widowed0.0% DivorcedWomen who did not give birth in the past 12 months Now married:
15.1% (28)Unmarried:
84.9% (158)
Marital status - Asian population 15 years and over
Males 37.1% Never married58.7% Now married4.1% Separated0.0% Widowed0.0% DivorcedFemales 21.4% Never married69.1% Now married0.0% Separated7.4% Widowed2.0% DivorcedWomen who did not give birth in the past 12 months Now married:
70.0% (313)Unmarried:
30.0% (134)
Marital status - Native Hawaiian / Pacific Islander population 15 years and over
Males 0.0% Never married100.0% Now married0.0% Separated0.0% Widowed0.0% DivorcedFemales 34.1% Never married29.3% Now married0.0% Separated4.3% Widowed32.2% DivorcedWomen who did not give birth in the past 12 months Now married:
19.1% (105)Unmarried:
80.9% (443)
Marital status - Other race population 15 years and over
Males 54.5% Never married29.6% Now married5.4% Separated3.7% Widowed6.8% DivorcedFemales 57.1% Never married33.5% Now married5.1% Separated0.0% Widowed4.3% DivorcedWomen who gave birth in the past 12 months Now married:
14.0% (8)Unmarried:
86.0% (50)
Women who did not give birth in the past 12 months Now married:
32.0% (214)Unmarried:
68.0% (457)
Marital status - Two or more races population 15 years and over
Males 43.1% Never married45.4% Now married5.7% Separated3.1% Widowed2.7% DivorcedFemales 32.4% Never married43.2% Now married1.7% Separated1.5% Widowed21.2% DivorcedWomen who gave birth in the past 12 months Now married:
100.0% (24)Unmarried:
0.0% (0)
Women who did not give birth in the past 12 months Now married:
39.7% (427)Unmarried:
60.3% (648)
Marital status - White alone, not Hispanic / Latino population 15 years and over
Males 41.4% Never married42.7% Now married0.3% Separated2.5% Widowed13.2% DivorcedFemales 31.2% Never married42.5% Now married0.6% Separated6.7% Widowed19.1% DivorcedWomen who gave birth in the past 12 months Now married:
51.0% (156)Unmarried:
49.0% (150)
Women who did not give birth in the past 12 months Now married:
41.6% (2,467)Unmarried:
58.4% (3,468)
Marital status - Hispanic or Latino population 15 years and over
Males 50.4% Never married32.5% Now married5.9% Separated1.4% Widowed9.9% DivorcedFemales 47.7% Never married35.1% Now married2.6% Separated1.7% Widowed12.9% DivorcedWomen who gave birth in the past 12 months Now married:
14.0% (8)Unmarried:
86.0% (51)
Women who did not give birth in the past 12 months Now married:
35.6% (675)Unmarried:
64.4% (1,223)
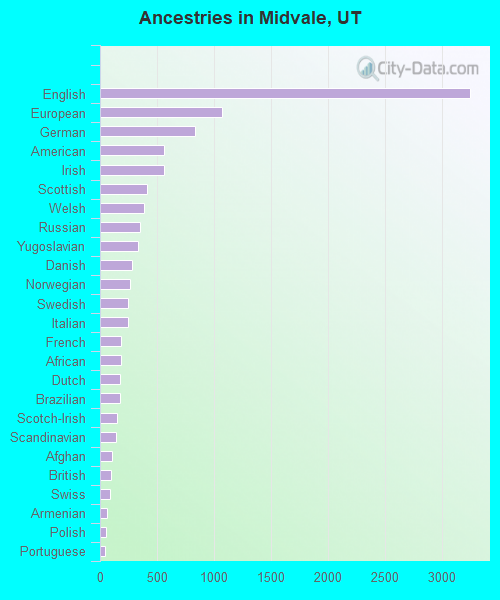
Ancestries in Midvale
3,252 17.2% English1,070 5.6% European831 4.4% German566 3.0% American566 3.0% Irish416 2.2% Scottish383 2.0% Welsh347 1.8% Russian336 1.8% Yugoslavian280 1.5% Danish263 1.4% Norwegian250 1.3% Swedish244 1.3% Italian187 1.0% French186 1.0% African177 0.9% Dutch174 0.9% Brazilian150 0.8% Scotch-Irish137 0.7% Scandinavian107 0.6% Afghan100 0.5% British90 0.5% Swiss62 0.3% Armenian57 0.3% Polish48 0.3% Portuguese47 0.2% Iraqi44 0.2% Jamaican40 0.2% Basque40 0.2% Icelander39 0.2% Eastern European36 0.2% South African27 0.1% Finnish24 0.1% Haitian23 0.1% Serbian22 0.1% Croatian22 0.1% Romanian20 0.1% Northern European16 0.08% Moroccan14 0.07% Lebanese12 0.06% Greek7 0.04% Australian6 0.03% Arab1 0.01% Czech
Geographical mobility in Midvale Same house 1 year ago 19,580 80.7% White (Caucasian)746 75.1% Black or African American225 66.0% American Indian / Alaska Native1,226 83.1% Asian892 77.6% Native Hawaiian / Pacific Islander1,599 66.7% Other race3,540 70.8% Two or more races18,722 81.2% White alone, not Hispanic / Latino4,279 67.8% Hispanic or LatinoMoved within same county 2,868 11.8% White / Caucasian154 15.5% Black or African American72 21.2% American Indian / Alaska Native51 3.4% Asian165 14.3% Native Hawaiian / Pacific Islander401 16.7% Other race1,008 20.2% Two or more races2,619 11.4% White alone, not Hispanic / Latino1,380 21.9% Hispanic or LatinoMoved within same state 924 3.8% White / Caucasian22 1.5% Asian12 1.1% Native Hawaiian / Pacific Islander29 1.2% Other race51 1.0% Two or more races818 3.5% White alone, not Hispanic / Latino177 2.8% Hispanic or LatinoMoved from different state 873 3.6% White / Caucasian9 0.9% Black or African American26 7.7% American Indian / Alaska Native187 12.7% Asian30 2.6% Native Hawaiian / Pacific Islander274 11.4% Other race284 5.7% Two or more races833 3.6% White alone, not Hispanic / Latino424 6.7% Hispanic or LatinoMoved from abroad 15 0.1% White148 3.0% Two or more races16 0.1% White alone, not Hispanic / Latino
Children Nativity (place of birth) in Midvale
Children under 6 years - Living with two parents Both parents native 1,392 100.0% NativeBoth parents foreign-born 306 93.9% Native20 6.1% Foreign-bornOne native, one foreign-born parent 165 100.0% NativeChildren under 6 years - Living with one parent Native parent 763 100.0% NativeForeign-born parent 196 85.6% Native33 14.4% Foreign-bornChildren 6 to 17 years - Living with two parents Both parents native 1,352 100.0% NativeBoth parents foreign-born 667 78.8% Native179 21.2% Foreign-bornOne native, one foreign-born parent 351 97.2% Native10 2.8% Foreign-bornChildren 6 to 17 years - Living with one parent Native parent 981 100.0% NativeForeign-born parent 1,175 53.2% Native1,036 46.8% Foreign-born
Grandparents responsible for own grandchildren in Midvale
Grandparents (30 to 59 years) White / Caucasian 8 9.3% Responsible for grandchildren81 90.7% Not responsible for grandchildrenAsian 33 100.0% Responsible for grandchildrenTwo or more races 6 100.0% Not responsible for grandchildrenWhite alone, not Hispanic / Latino 10 15.5% Responsible for grandchildren55 84.5% Not responsible for grandchildrenHispanic or Latino 31 100.0% Not responsible for grandchildrenGrandparents (60 years and over) White / Caucasian 14 25.1% Responsible for grandchildren43 74.9% Not responsible for grandchildrenTwo or more races 133 100.0% Not responsible for grandchildrenWhite alone, not Hispanic / Latino 14 24.1% Responsible for grandchildren45 75.9% Not responsible for grandchildren