Races in Mineral Bluff, Georgia (GA) Detailed Stats
Ancestries, Foreign-born residents, place of birth
Data:
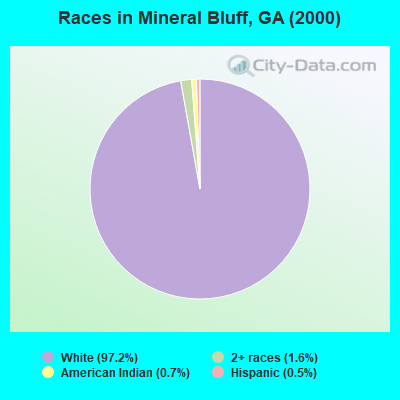
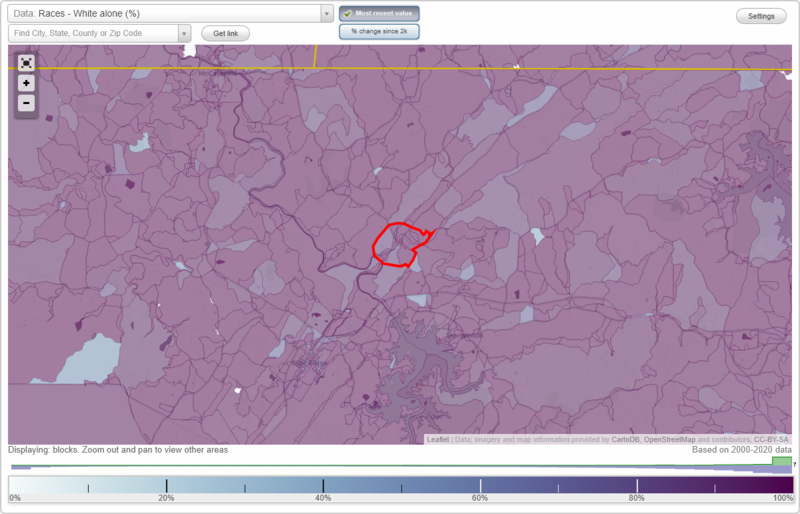
Race distribution in Mineral Bluff

- 2,77497.2%White alone
- 461.6%Two or more races
- 210.7%American Indian alone
- 130.5%Hispanic
- 10.04%Black alone
2000
2022
-
- 5,128,66162.6%White alone
- 2,331,46528.5%Black alone
- 435,2275.3%Hispanic
- 171,5132.1%Asian alone
- 87,3641.1%Two or more races
- 17,6700.2%American Indian alone
- 11,2750.1%Other race alone
- 3,2780.04%Native Hawaiian and Other
Pacific Islander alone
-
- 5,415,65749.6%White alone
- 3,349,24030.7%Black alone
- 1,132,60410.4%Hispanic
- 479,1564.4%Asian alone
- 462,9234.2%Two or more races
- 54,4160.5%Other race alone
- 11,9230.1%American Indian alone
- 6,9570.06%Native Hawaiian and Other
Pacific Islander alone
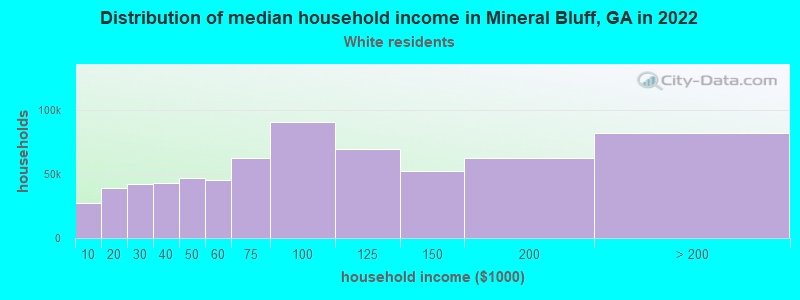
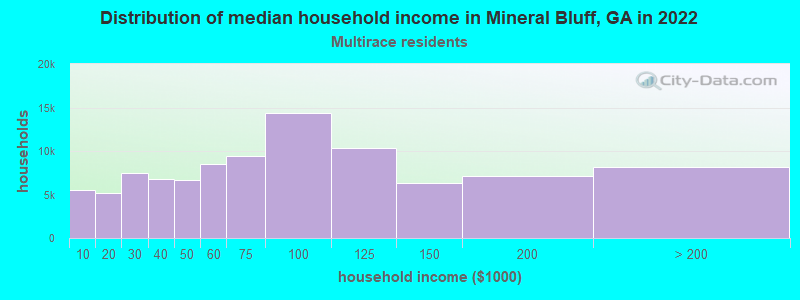
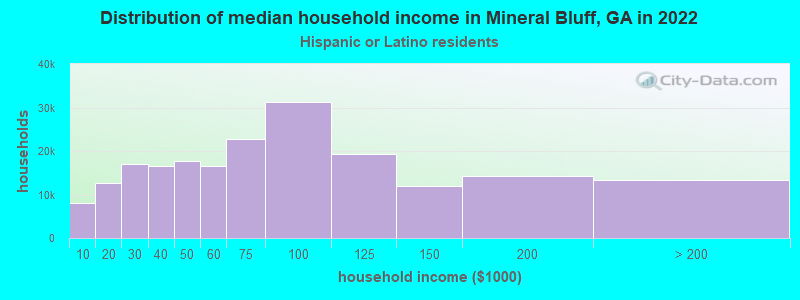
Income and house value in Mineral Bluff
- Median household income in 2022
- $48,811White non-Hispanic householders
- $46,098Some other race householders
- $55,174Two or more races householders
- $98,306Hispanic or Latino race householders
- Median 2022 house value
- $323,506White Non-Hispanic householders
- $252,435Some other race householders
- $430,694Two or more races householders
- $593,418Hispanic or Latino householders