Races in Mineral, Washington (WA) Detailed Stats
Ancestries, Foreign-born residents, place of birth
Data:
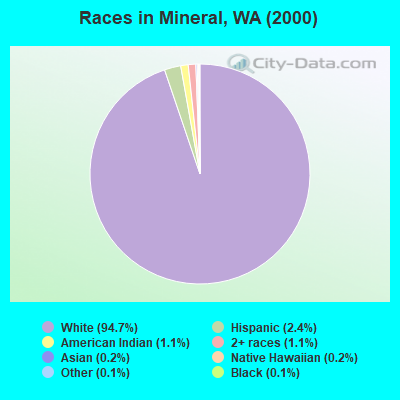
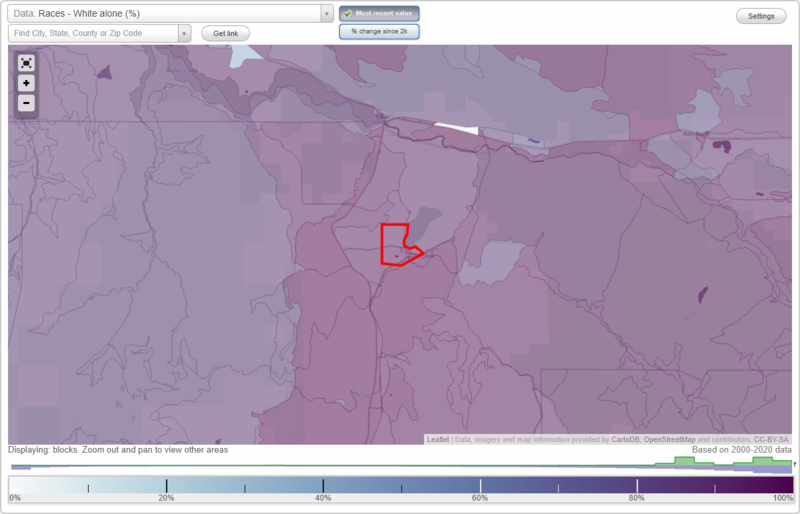
Race distribution in Mineral

- 3,41094.7%White alone
- 882.4%Hispanic
- 391.1%Two or more races
- 391.1%American Indian alone
- 80.2%Asian alone
- 60.2%Native Hawaiian and Other
Pacific Islander alone
- 40.1%Black alone
- 50.1%Other race alone
2000
2022
-
- 4,652,49078.9%White alone
- 441,5097.5%Hispanic
- 319,4015.4%Asian alone
- 184,6313.1%Black alone
- 175,9263.0%Two or more races
- 85,3961.4%American Indian alone
- 22,7790.4%Native Hawaiian and Other
Pacific Islander alone
- 11,9890.2%Other race alone
-
- 4,941,45663.5%White alone
- 1,093,31314.0%Hispanic
- 755,8329.7%Asian alone
- 523,4486.7%Two or more races
- 299,5373.8%Black alone
- 69,0240.9%American Indian alone
- 52,2310.7%Native Hawaiian and Other
Pacific Islander alone
- 50,9450.7%Other race alone
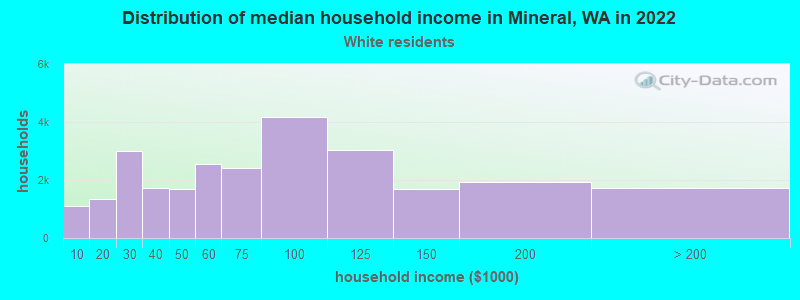
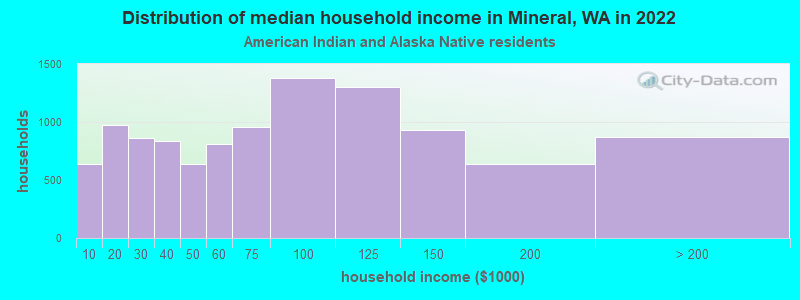
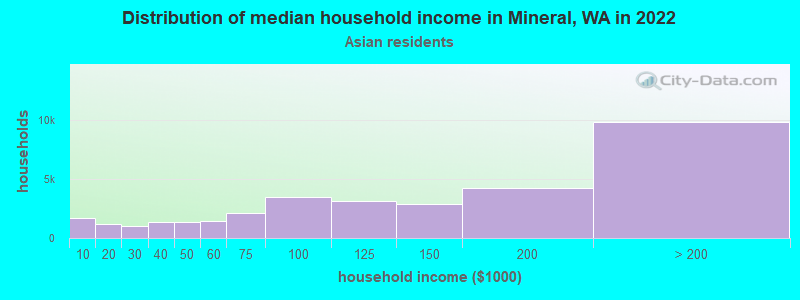
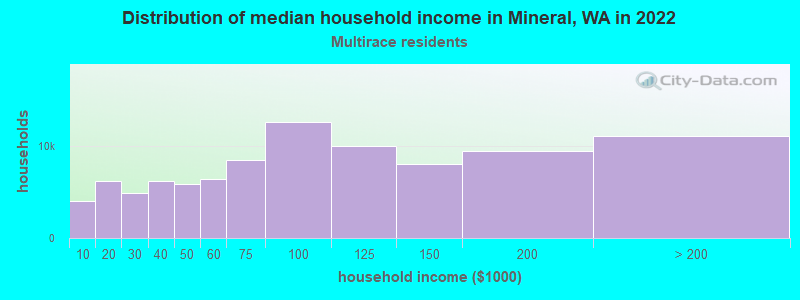
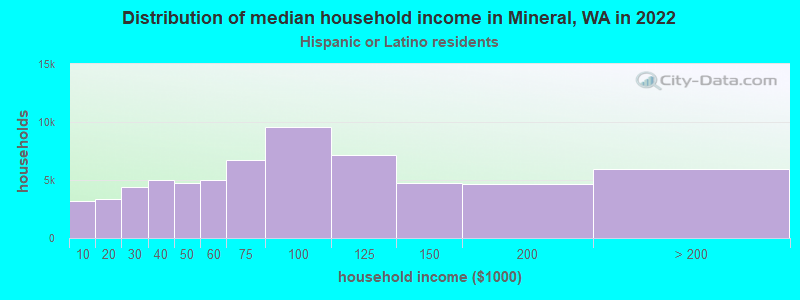
Income and house value in Mineral
- Median household income in 2022
- $68,317White non-Hispanic householders
- $45,555American Indian and Alaska Native householders
- $23,580Some other race householders
- $53,238Two or more races householders
- $19,326Hispanic or Latino race householders
- Median 2022 house value
- $334,705White Non-Hispanic householders
- $149,422Hispanic or Latino householders