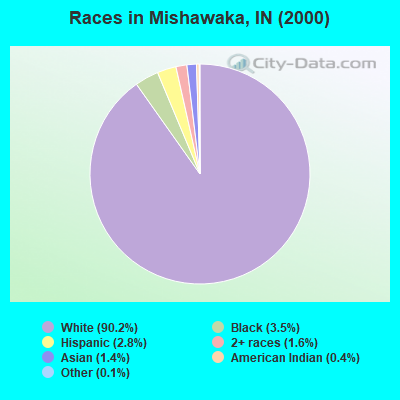
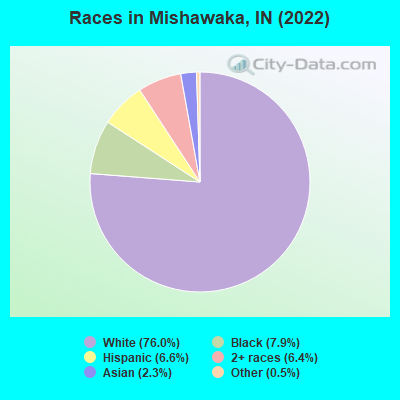
Races in Mishawaka, Indiana (IN) Detailed Stats
Data:
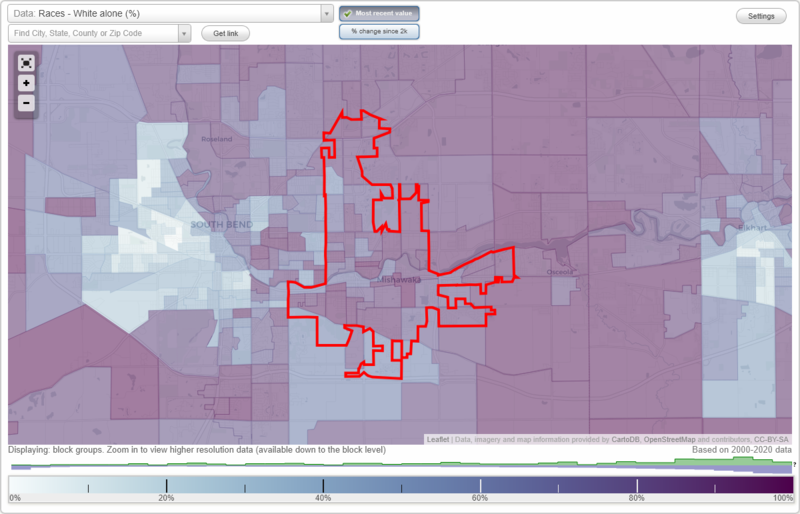
Races - White alone (%)
Races - White alone (% change since 2000)
Races - Black alone (%)
Races - Black alone (% change since 2000)
Races - American Indian alone (%)
Races - American Indian alone (% change since 2000)
Races - Asian alone (%)
Races - Asian alone (% change since 2000)
Races - Hispanic (%)
Races - Hispanic (% change since 2000)
Races - Native Hawaiian and Other Pacific Islander alone (%)
Races - Native Hawaiian and Other Pacific Islander alone (% change since 2000)
Races - Two or more races(%)
Races - Two or more races(% change since 2000)
Races - Other race alone (%)
Races - Other race alone (% change since 2000)
Racial diversity
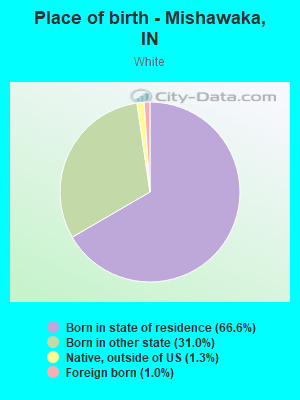
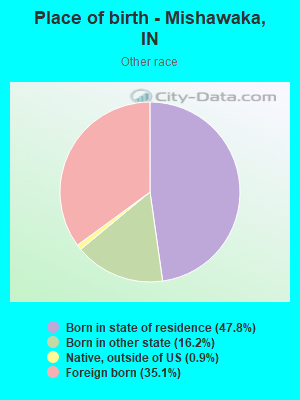
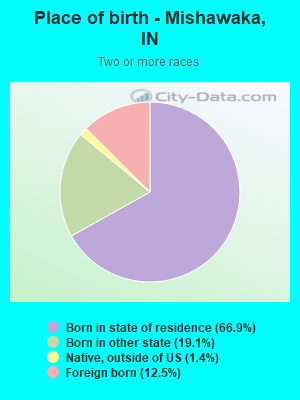
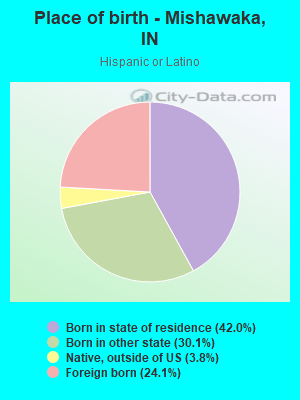
Place of birth - Born in state of residence (%)
Place of birth - Born in state of residence (%) - White
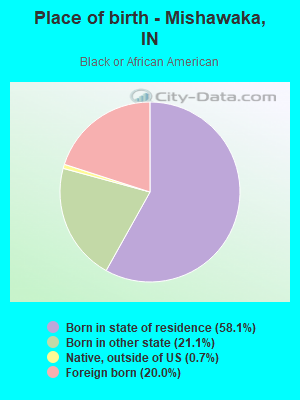
Place of birth - Born in state of residence (%) - Black or African American
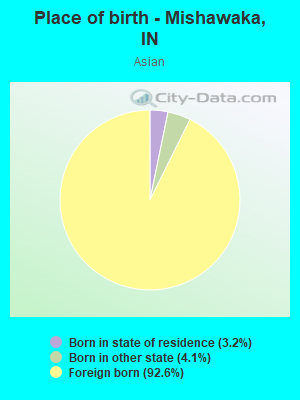
Place of birth - Born in state of residence (%) - Asian
Place of birth - Born in state of residence (%) - Hispanic or Latino
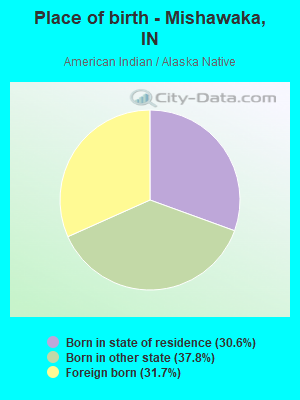
Place of birth - Born in state of residence (%) - American Indian and Alaska Native
Place of birth - Born in state of residence (%) - Multirace
Place of birth - Born in state of residence (%) - Other Race
Place of birth - Born in other state (%)
Place of birth - Born in other state (%) - White
Place of birth - Born in other state (%) - Black or African American
Place of birth - Born in other state (%) - Asian
Place of birth - Born in other state (%) - Hispanic or Latino
Place of birth - Born in other state (%) - American Indian and Alaska Native
Place of birth - Born in other state (%) - Multirace
Place of birth - Born in other state (%) - Other Race
Place of birth - Native, outside of US (%)
Place of birth - Native, outside of US (%) - White
Place of birth - Native, outside of US (%) - Black or African American
Place of birth - Native, outside of US (%) - Asian
Place of birth - Native, outside of US (%) - Hispanic or Latino
Place of birth - Native, outside of US (%) - American Indian and Alaska Native
Place of birth - Native, outside of US (%) - Multirace
Place of birth - Native, outside of US (%) - Other Race
Place of birth - Foreign born (%)
Place of birth - Foreign born (%) - White
Place of birth - Foreign born (%) - Black or African American
Place of birth - Foreign born (%) - Asian
Place of birth - Foreign born (%) - Hispanic or Latino
Place of birth - Foreign born (%) - American Indian and Alaska Native
Place of birth - Foreign born (%) - Multirace
Place of birth - Foreign born (%) - Other Race
Residents speaking English at home (%)
Residents speaking English at home - Born in the United States (%)
Residents speaking English at home - Native, born elsewhere (%)
Residents speaking English at home - Foreign born (%)
Residents speaking Spanish at home (%)
Residents speaking Spanish at home - Born in the United States (%)
Residents speaking Spanish at home - Native, born elsewhere (%)
Residents speaking Spanish at home - Foreign born (%)
Residents speaking other language at home (%)
Residents speaking other language at home - Born in the United States (%)
Residents speaking other language at home - Native, born elsewhere (%)
Residents speaking other language at home - Foreign born (%)
Marital status - Never married (%)
Marital status - Now married (%)
Marital status - Separated (%)
Marital status - Widowed (%)
Marital status - Divorced (%)
Ancestries Reported - Arab (%)
Ancestries Reported - Czech (%)
Ancestries Reported - Danish (%)
Ancestries Reported - Dutch (%)
Ancestries Reported - English (%)
Ancestries Reported - French (%)
Ancestries Reported - French Canadian (%)
Ancestries Reported - German (%)
Ancestries Reported - Greek (%)
Ancestries Reported - Hungarian (%)
Ancestries Reported - Irish (%)
Ancestries Reported - Italian (%)
Ancestries Reported - Lithuanian (%)
Ancestries Reported - Norwegian (%)
Ancestries Reported - Polish (%)
Ancestries Reported - Portuguese (%)
Ancestries Reported - Russian (%)
Ancestries Reported - Scotch-Irish (%)
Ancestries Reported - Scottish (%)
Ancestries Reported - Slovak (%)
Ancestries Reported - Subsaharan African (%)
Ancestries Reported - Swedish (%)
Ancestries Reported - Swiss (%)
Ancestries Reported - Ukrainian (%)
Ancestries Reported - United States (%)
Ancestries Reported - Welsh (%)
Ancestries Reported - West Indian (%)
Ancestries Reported - Other (%)
Geographical mobility - Same house 1 year ago (%)
Geographical mobility - Same house 1 year ago (%) - White
Geographical mobility - Same house 1 year ago (%) - Black or African American
Geographical mobility - Same house 1 year ago (%) - Asian
Geographical mobility - Same house 1 year ago (%) - Hispanic or Latino
Geographical mobility - Same house 1 year ago (%) - American Indian and Alaska Native
Geographical mobility - Same house 1 year ago (%) - Multirace
Geographical mobility - Same house 1 year ago (%) - Other Race
Geographical mobility - Moved within same county (%)
Geographical mobility - Moved within same county (%) - White
Geographical mobility - Moved within same county (%) - Black or African American
Geographical mobility - Moved within same county (%) - Asian
Geographical mobility - Moved within same county (%) - Hispanic or Latino
Geographical mobility - Moved within same county (%) - American Indian and Alaska Native
Geographical mobility - Moved within same county (%) - Multirace
Geographical mobility - Moved within same county (%) - Other Race
Geographical mobility - Moved from different county within same state (%)
Geographical mobility - Moved from different county within same state (%) - White
Geographical mobility - Moved from different county within same state (%) - Black or African American
Geographical mobility - Moved from different county within same state (%) - Asian
Geographical mobility - Moved from different county within same state (%) - Hispanic or Latino
Geographical mobility - Moved from different county within same state (%) - American Indian and Alaska Native
Geographical mobility - Moved from different county within same state (%) - Multirace
Geographical mobility - Moved from different county within same state (%) - Other Race
Geographical mobility - Moved from different state (%)
Geographical mobility - Moved from different state (%) - White
Geographical mobility - Moved from different state (%) - Black or African American
Geographical mobility - Moved from different state (%) - Asian
Geographical mobility - Moved from different state (%) - Hispanic or Latino
Geographical mobility - Moved from different state (%) - American Indian and Alaska Native
Geographical mobility - Moved from different state (%) - Multirace
Geographical mobility - Moved from different state (%) - Other Race
Geographical mobility - Moved from abroad (%)
Geographical mobility - Moved from abroad (%) - White
Geographical mobility - Moved from abroad (%) - Black or African American
Geographical mobility - Moved from abroad (%) - Asian
Geographical mobility - Moved from abroad (%) - Hispanic or Latino
Geographical mobility - Moved from abroad (%) - American Indian and Alaska Native
Geographical mobility - Moved from abroad (%) - Multirace
Geographical mobility - Moved from abroad (%) - Other Race
Place of birth for the foreign-born population - Ireland (%)
Place of birth for the foreign-born population - Denmark (%)
Place of birth for the foreign-born population - Norway (%)
Place of birth for the foreign-born population - Sweden (%)
Place of birth for the foreign-born population - United Kingdom (%)
Place of birth for the foreign-born population - England (%)
Place of birth for the foreign-born population - Scotland (%)
Place of birth for the foreign-born population - Other Northern Europe (%)
Place of birth for the foreign-born population - Austria (%)
Place of birth for the foreign-born population - Belgium (%)
Place of birth for the foreign-born population - France (%)
Place of birth for the foreign-born population - Germany (%)
Place of birth for the foreign-born population - Netherlands (%)
Place of birth for the foreign-born population - Switzerland (%)
Place of birth for the foreign-born population - Other Western Europe (%)
Place of birth for the foreign-born population - Greece (%)
Place of birth for the foreign-born population - Italy (%)
Place of birth for the foreign-born population - Portugal (%)
Place of birth for the foreign-born population - Spain (%)
Place of birth for the foreign-born population - Other Southern Europe (%)
Place of birth for the foreign-born population - Albania (%)
Place of birth for the foreign-born population - Belarus (%)
Place of birth for the foreign-born population - Bosnia and Herzegovina (%)
Place of birth for the foreign-born population - Bulgaria (%)
Place of birth for the foreign-born population - Croatia (%)
Place of birth for the foreign-born population - Czechoslovakia (%)
Place of birth for the foreign-born population - Hungary (%)
Place of birth for the foreign-born population - Latvia (%)
Place of birth for the foreign-born population - Lithuania (%)
Place of birth for the foreign-born population - North Macedonia (Macedonia) (%)
Place of birth for the foreign-born population - Moldova (%)
Place of birth for the foreign-born population - Poland (%)
Place of birth for the foreign-born population - Romania (%)
Place of birth for the foreign-born population - Russia (%)
Place of birth for the foreign-born population - Serbia (%)
Place of birth for the foreign-born population - Ukraine (%)
Place of birth for the foreign-born population - Other Eastern Europe (%)
Place of birth for the foreign-born population - China (%)
Place of birth for the foreign-born population - Hong Kong (%)
Place of birth for the foreign-born population - Taiwan (%)
Place of birth for the foreign-born population - Japan (%)
Place of birth for the foreign-born population - Korea (%)
Place of birth for the foreign-born population - Other Eastern Asia (%)
Place of birth for the foreign-born population - Afghanistan (%)
Place of birth for the foreign-born population - Bangladesh (%)
Place of birth for the foreign-born population - India (%)
Place of birth for the foreign-born population - Iran (%)
Place of birth for the foreign-born population - Kazakhstan (%)
Place of birth for the foreign-born population - Nepal (%)
Place of birth for the foreign-born population - Pakistan (%)
Place of birth for the foreign-born population - Sri Lanka (%)
Place of birth for the foreign-born population - Uzbekistan (%)
Place of birth for the foreign-born population - Other South Central Asia (%)
Place of birth for the foreign-born population - Burma (%)
Place of birth for the foreign-born population - Cambodia (%)
Place of birth for the foreign-born population - Indonesia (%)
Place of birth for the foreign-born population - Laos (%)
Place of birth for the foreign-born population - Malaysia (%)
Place of birth for the foreign-born population - Philippines (%)
Place of birth for the foreign-born population - Singapore (%)
Place of birth for the foreign-born population - Thailand (%)
Place of birth for the foreign-born population - Vietnam (%)
Place of birth for the foreign-born population - Other South Eastern Asia (%)
Place of birth for the foreign-born population - Armenia (%)
Place of birth for the foreign-born population - Iraq (%)
Place of birth for the foreign-born population - Israel (%)
Place of birth for the foreign-born population - Jordan (%)
Place of birth for the foreign-born population - Kuwait (%)
Place of birth for the foreign-born population - Lebanon (%)
Place of birth for the foreign-born population - Saudi Arabia (%)
Place of birth for the foreign-born population - Syria (%)
Place of birth for the foreign-born population - Turkey (%)
Place of birth for the foreign-born population - Yemen (%)
Place of birth for the foreign-born population - Other Western Asia (%)
Place of birth for the foreign-born population - Eritrea (%)
Place of birth for the foreign-born population - Ethiopia (%)
Place of birth for the foreign-born population - Kenya (%)
Place of birth for the foreign-born population - Somalia (%)
Place of birth for the foreign-born population - Uganda (%)
Place of birth for the foreign-born population - Zimbabwe (%)
Place of birth for the foreign-born population - Other Eastern Africa (%)
Place of birth for the foreign-born population - Cameroon (%)
Place of birth for the foreign-born population - Congo (%)
Place of birth for the foreign-born population - Democratic Republic of Congo (Zaire) (%)
Place of birth for the foreign-born population - Other Middle Africa (%)
Place of birth for the foreign-born population - Egypt (%)
Place of birth for the foreign-born population - Morocco (%)
Place of birth for the foreign-born population - Sudan (%)
Place of birth for the foreign-born population - Other Northern Africa (%)
Place of birth for the foreign-born population - South Africa (%)
Place of birth for the foreign-born population - Other Southern Africa (%)
Place of birth for the foreign-born population - Cabo Verde (%)
Place of birth for the foreign-born population - Ghana (%)
Place of birth for the foreign-born population - Liberia (%)
Place of birth for the foreign-born population - Nigeria (%)
Place of birth for the foreign-born population - Senegal (%)
Place of birth for the foreign-born population - Sierra Leone (%)
Place of birth for the foreign-born population - Other Western Africa (%)
Place of birth for the foreign-born population - Australia (%)
Place of birth for the foreign-born population - New Zealand (%)
Place of birth for the foreign-born population - Fiji (%)
Place of birth for the foreign-born population - Micronesia (%)
Place of birth for the foreign-born population - Bahamas (%)
Place of birth for the foreign-born population - Barbados (%)
Place of birth for the foreign-born population - Cuba (%)
Place of birth for the foreign-born population - Dominica (%)
Place of birth for the foreign-born population - Dominican Republic (%)
Place of birth for the foreign-born population - Grenada (%)
Place of birth for the foreign-born population - Haiti (%)
Place of birth for the foreign-born population - Jamaica (%)
Place of birth for the foreign-born population - St. Vincent and the Grenadines (%)
Place of birth for the foreign-born population - Trinidad and Tobago (%)
Place of birth for the foreign-born population - West Indies (%)
Place of birth for the foreign-born population - Other Caribbean (%)
Place of birth for the foreign-born population - Belize (%)
Place of birth for the foreign-born population - Costa Rica (%)
Place of birth for the foreign-born population - El Salvador (%)
Place of birth for the foreign-born population - Guatemala (%)
Place of birth for the foreign-born population - Honduras (%)
Place of birth for the foreign-born population - Mexico (%)
Place of birth for the foreign-born population - Nicaragua (%)
Place of birth for the foreign-born population - Panama (%)
Place of birth for the foreign-born population - Other Central America (%)
Place of birth for the foreign-born population - Argentina (%)
Place of birth for the foreign-born population - Bolivia (%)
Place of birth for the foreign-born population - Brazil (%)
Place of birth for the foreign-born population - Chile (%)
Place of birth for the foreign-born population - Colombia (%)
Place of birth for the foreign-born population - Ecuador (%)
Place of birth for the foreign-born population - Guyana (%)
Place of birth for the foreign-born population - Peru (%)
Place of birth for the foreign-born population - Uruguay (%)
Place of birth for the foreign-born population - Venezuela (%)
Place of birth for the foreign-born population - Other South America (%)
Place of birth for the foreign-born population - Canada (%)
Place of birth for the foreign-born population - Other Northern America (%)
Place of birth for the foreign-born population - Other (%)
Latest news about races in Mishawaka, IN collected exclusively by city-data.com from local newspapers, TV, and radio stations
According to 2022 data, the most numerous races in Mishawaka, IN are White alone (38,669 residents), Black alone (4,036 residents), and Hispanic (3,366 residents). 90.9% of Mishawaka residents speak English at home. 6.3% of Mishawaka, IN residents are foreign-born (2.4% born in Asia, 1.2% born in Latin America, 1.2% born in Africa, 0.7% born in Europe), which is 4.7% greater than the foreign-born rate of 6.0% across the entire state of Indiana.
Race distribution in Mishawaka
2000 2022
5,219,373 85.8% White alone 505,462 8.3% Black alone 214,536 3.5% Hispanic 61,115 1.0% Two or more races 58,424 1.0% Asian alone 13,654 0.2% American Indian alone 6,348 0.1% Other race alone 1,573 0.03% Native Hawaiian and Other
5,192,455 76.0% White alone 628,054 9.2% Black alone 534,528 7.8% Hispanic 263,242 3.9% Two or more races 172,880 2.5% Asian alone 33,467 0.5% Other race alone 5,866 0.09% American Indian alone 2,545 0.04% Native Hawaiian and Other
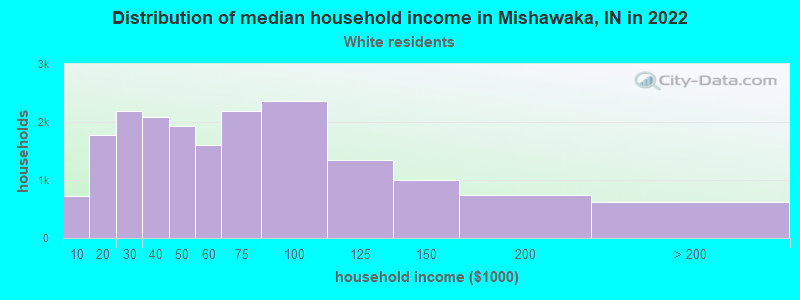
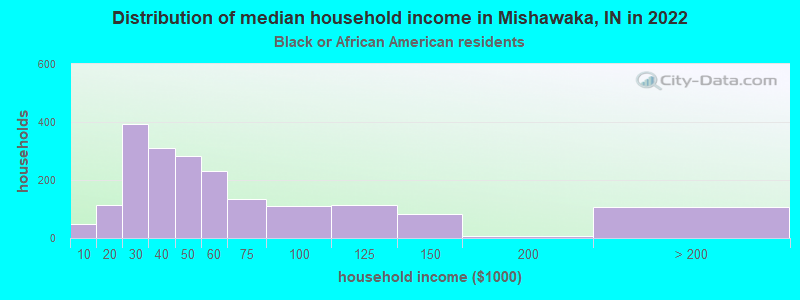
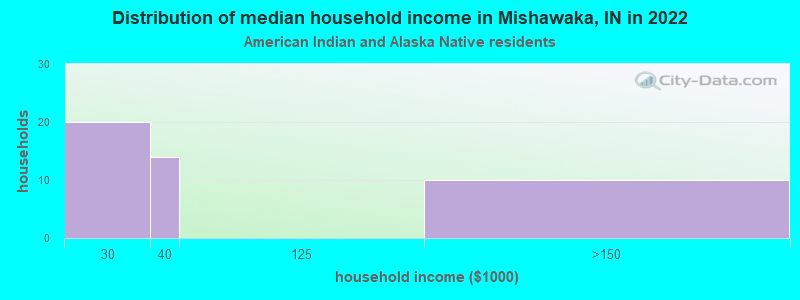
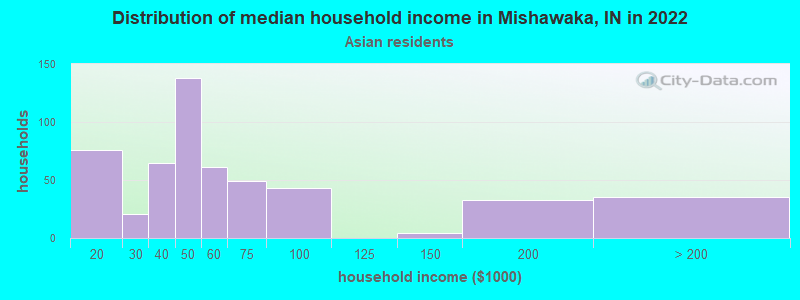
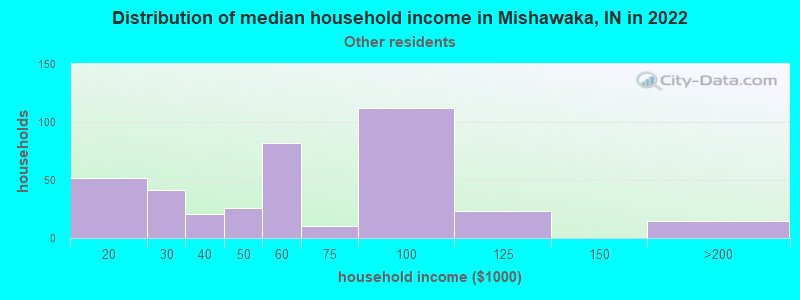
Income and house value in Mishawaka Median household income in 2022 $52,377 White non-Hispanic householders$45,026 Black householders$33,509 Asian householders$67,264 Some other race householders$47,294 Two or more races householders$61,079 Hispanic or Latino race householdersMedian 2022 house value $150,859 White Non-Hispanic householders$198,601 Black or African American householders$191,557 American Indian or Alaska Native householders $149,685 Asian householders$111,725 Some other race householders$183,731 Two or more races householders$117,400 Hispanic or Latino householders
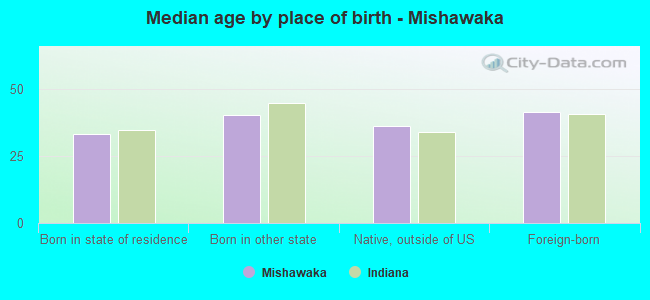
Median age by race in Mishawaka
39.3 Median age for White residents37.3 41.3 30.8 Median age for Black or African American residents29.2 32.2 52.3 Median age for American Indian / Alaska Native residents33.1 -616,822,429.3 37.0 Median age for Asian residents42.4 28.7 -669,999,999.3 Median age for Native Hawaiian / Pacific Islander residents-644,025,156.6 -666,666,666.0 34.6 Median age for Other race residents30.5 43.6 21.1 Median age for Two or more races residents22.2 19.9 39.8 Median age for White alone residents37.8 42.1 23.1 Median age for Hispanic or Latino residents21.4 27.9
Owner/renter occupied households by race in Mishawaka
House owners and renters - White residents 9,739 51.2% Owner occupied9,299 48.8% Renter occupiedHouse owners and renters - Black or African American residents 229 12.3% Owner occupied1,633 87.7% Renter occupiedHouse owners and renters - American Indian / Alaska Native residents 37 52.1% Owner occupied34 47.9% Renter occupiedHouse owners and renters - Asian residents 79 15.6% Owner occupied430 84.4% Renter occupiedHouse owners and renters - Native Hawaiian / Pacific Islander residents 6 100.0% Owner occupiedHouse owners and renters - Other race residents 96 30.4% Owner occupied219 69.6% Renter occupiedHouse owners and renters - Two or more races residents 655 54.3% Owner occupied552 45.7% Renter occupiedHouse owners and renters - White alone residents 9,758 51.9% Owner occupied9,031 48.1% Renter occupiedHouse owners and renters - Hispanic or Latino residents 529 46.8% Owner occupied601 53.2% Renter occupied
Language usage in Mishawaka
English speakers - Total 90.9% of residents of Mishawaka speak English at home.
4.5% of residents speak Spanish at home 1,233 57.4% Speak English very well915 42.6% Speak English less than very well4.1% of residents speak other language at home 1,184 60.3% Speak English very well779 39.7% Speak English less than very well
English speakers - Born in the United States 94.5% of residents of Mishawaka speak English at home.
4.2% of residents speak Spanish at home 414 71.8% Speak English very well163 28.2% Speak English less than very well1.4% of residents speak other language at home 95 49.0% Speak English very well99 51.0% Speak English less than very well
English speakers - Native, born elsewhere 86.1% of residents of Mishawaka speak English at home.
18.2% of residents speak Spanish at home 123 100.0% Speak English very well2.5% of residents speak other language at home 17 100.0% Speak English very well
English speakers - Foreign-born 21.7% of residents of Mishawaka speak English at home.
23.3% of residents speak Spanish at home 171 21.8% Speak English very well615 78.2% Speak English less than very well52.2% of residents speak other language at home 1,054 59.9% Speak English very well705 40.1% Speak English less than very well
White (Caucasian) - Speak only English Native:
98.0% (36,295)Foreign-born:
66.7% (264)
White (Caucasian) - Speak another language Native:
2.1% (760)Foreign-born:
42.0% (166)
Black or African American - Speak only English Native:
98.9% (3,441)Foreign-born:
19.8% (172)
Black or African American - Speak another language Native:
1.1% (38)Foreign-born:
84.8% (739)
American Indian / Alaska Native - Speak only English Native:
44.1% (37)Foreign-born:
33.6% (15)
American Indian / Alaska Native - Speak another language Native:
65.9% (55)Foreign-born:
59.9% (27)
Asian - Speak only English Native:
20.7% (17)Foreign-born:
21.7% (255)
Asian - Speak another language Native:
92.8% (77)Foreign-born:
74.4% (873)
Native Hawaiian / Pacific Islander - Speak only English Native:
99.5% (18)Foreign-born:
96.3% (5)
Other race - Speak only English Native:
95.7% (478)Foreign-born:
4.9% (13)
Other race - Speak another language Native:
12.2% (61)Foreign-born:
95.4% (253)
Two or more races - Speak another language Native:
22.5% (707)Foreign-born:
100.0% (614)
White alone - Speak only English Native:
98.2% (35,863)Foreign-born:
66.4% (267)
White alone - Speak another language Native:
1.8% (666)Foreign-born:
37.4% (150)
Hispanic or Latino - Speak only English Native:
66.9% (1,437)Foreign-born:
2.1% (17)
Hispanic or Latino - Speak another language Native:
32.8% (705)Foreign-born:
98.3% (772)
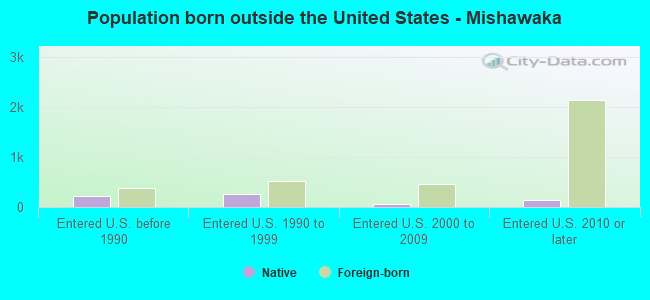
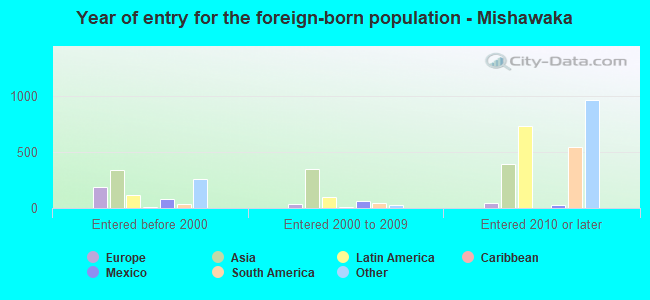
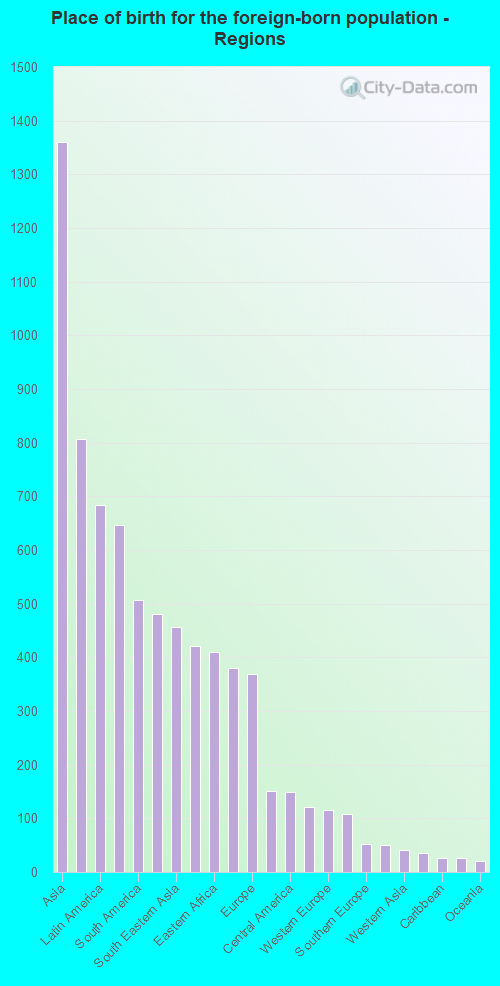
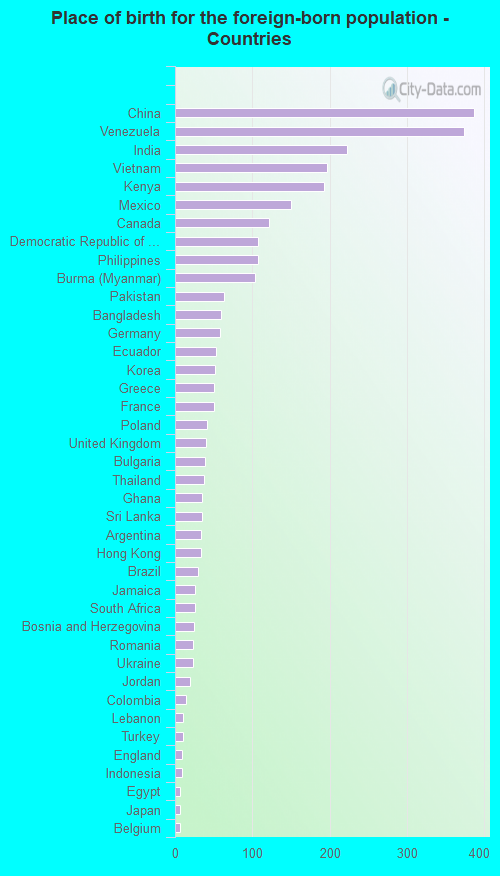
Foreign-born residents in Mishawaka 3,204 residents are foreign born (2.4% Asia , 1.2% Latin America , 1.2% Africa , 0.7% Europe ).
This city:
6.3%Indiana:
5.6%
Marital status for residents in Mishawaka Marital status - White (Caucasian) population 15 years and over
Males 38.0% Never married42.0% Now married1.4% Separated4.0% Widowed14.7% DivorcedFemales 29.1% Never married37.3% Now married1.0% Separated10.3% Widowed22.3% DivorcedWomen who gave birth in the past 12 months Now married:
42.8% (303)Unmarried:
57.2% (406)
Women who did not give birth in the past 12 months Now married:
35.7% (2,892)Unmarried:
64.3% (5,204)
Marital status - Black or African American population 15 years and over
Males 66.3% Never married23.2% Now married0.8% Separated0.7% Widowed9.1% DivorcedFemales 57.5% Never married24.3% Now married1.4% Separated3.2% Widowed13.6% DivorcedWomen who gave birth in the past 12 months Now married:
75.0% (12)Unmarried:
25.0% (4)
Women who did not give birth in the past 12 months Now married:
26.7% (323)Unmarried:
73.3% (888)
Marital status - American Indian / Alaska Native population 15 years and over
Males 36.9% Never married63.1% Now married0.0% Separated0.0% Widowed0.0% DivorcedFemales 35.7% Never married64.3% Now married0.0% Separated0.0% Widowed0.0% DivorcedWomen who did not give birth in the past 12 months Now married:
0.0% (0)Unmarried:
100.0% (12)
Marital status - Asian population 15 years and over
Males 39.0% Never married61.0% Now married0.0% Separated0.0% Widowed0.0% DivorcedFemales 25.0% Never married71.7% Now married0.0% Separated0.0% Widowed3.3% DivorcedWomen who gave birth in the past 12 months Now married:
100.0% (40)Unmarried:
0.0% (0)
Women who did not give birth in the past 12 months Now married:
60.6% (205)Unmarried:
39.4% (133)
Marital status - Native Hawaiian / Pacific Islander population 15 years and over
Males 100.0% Never married0.0% Now married0.0% Separated0.0% Widowed0.0% DivorcedFemales 0.0% Never married100.0% Now married0.0% Separated0.0% Widowed0.0% DivorcedMarital status - Other race population 15 years and over
Males 34.9% Never married54.1% Now married0.0% Separated0.0% Widowed10.9% DivorcedFemales 23.6% Never married55.4% Now married0.0% Separated7.7% Widowed13.3% DivorcedWomen who gave birth in the past 12 months Now married:
100.0% (30)Unmarried:
0.0% (0)
Women who did not give birth in the past 12 months Now married:
50.0% (83)Unmarried:
50.0% (83)
Marital status - Two or more races population 15 years and over
Males 61.1% Never married26.9% Now married0.0% Separated6.0% Widowed6.1% DivorcedFemales 55.0% Never married26.7% Now married2.7% Separated8.3% Widowed7.3% DivorcedWomen who gave birth in the past 12 months Now married:
50.7% (84)Unmarried:
49.3% (82)
Women who did not give birth in the past 12 months Now married:
25.3% (221)Unmarried:
74.7% (654)
Marital status - White alone, not Hispanic / Latino population 15 years and over
Males 36.8% Never married42.7% Now married1.4% Separated3.9% Widowed15.1% DivorcedFemales 28.6% Never married37.3% Now married1.1% Separated10.5% Widowed22.6% DivorcedWomen who gave birth in the past 12 months Now married:
39.0% (265)Unmarried:
61.0% (414)
Women who did not give birth in the past 12 months Now married:
36.0% (2,868)Unmarried:
64.0% (5,088)
Marital status - Hispanic or Latino population 15 years and over
Males 64.9% Never married31.9% Now married0.0% Separated2.4% Widowed0.7% DivorcedFemales 47.1% Never married43.8% Now married0.1% Separated5.6% Widowed3.5% DivorcedWomen who gave birth in the past 12 months Now married:
77.6% (101)Unmarried:
22.4% (29)
Women who did not give birth in the past 12 months Now married:
38.1% (281)Unmarried:
61.9% (456)
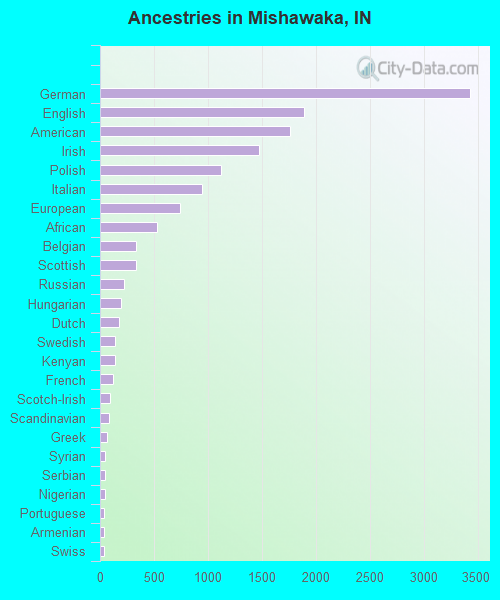
Ancestries in Mishawaka
3,431 16.0% German1,885 8.8% English1,762 8.2% American1,473 6.9% Irish1,122 5.2% Polish946 4.4% Italian744 3.5% European529 2.5% African337 1.6% Belgian329 1.5% Scottish219 1.0% Russian191 0.9% Hungarian180 0.8% Dutch137 0.6% Swedish136 0.6% Kenyan120 0.6% French97 0.5% Scotch-Irish81 0.4% Scandinavian67 0.3% Greek49 0.2% Syrian46 0.2% Serbian42 0.2% Nigerian37 0.2% Portuguese36 0.2% Armenian36 0.2% Swiss35 0.2% Romanian34 0.2% Norwegian34 0.2% Ghanaian34 0.2% Eastern European32 0.1% British28 0.1% Finnish27 0.1% Jordanian26 0.1% Brazilian22 0.1% Northern European22 0.1% Lebanese22 0.1% Ukrainian20 0.09% Pennsylvania German20 0.09% Jamaican20 0.09% Yugoslavian18 0.08% Canadian16 0.07% Welsh16 0.07% Bulgarian16 0.07% Austrian15 0.07% Lithuanian15 0.07% Macedonian13 0.06% Czech12 0.06% Turkish8 0.04% French Canadian5 0.02% Egyptian
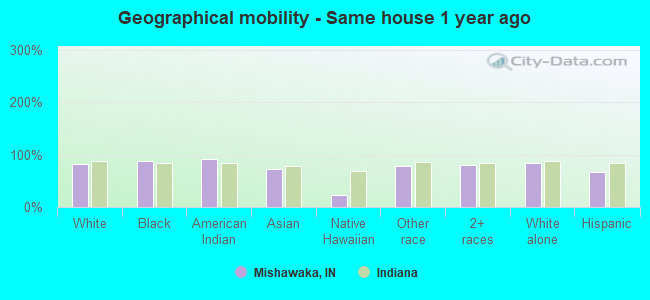
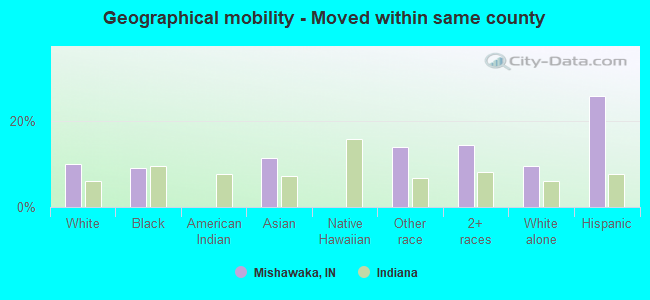
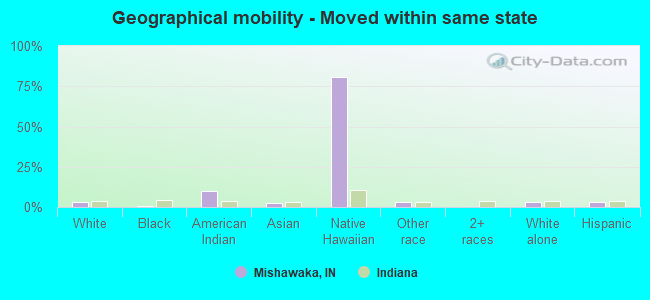
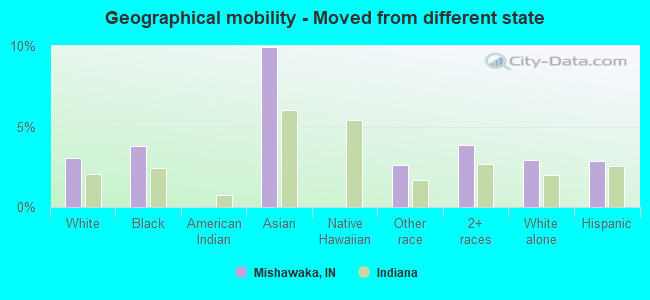
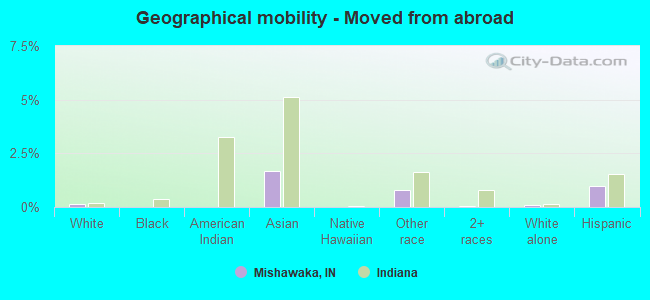
Geographical mobility in Mishawaka Same house 1 year ago 32,230 82.9% White (Caucasian)3,794 87.0% Black or African American154 91.9% American Indian / Alaska Native842 73.2% Asian5 23.0% Native Hawaiian / Pacific Islander587 78.5% Other race3,706 80.3% Two or more races32,063 83.7% White alone, not Hispanic / Latino2,166 67.4% Hispanic or LatinoMoved within same county 3,912 10.1% White / Caucasian399 9.1% Black or African American131 11.4% Asian105 14.0% Other race669 14.5% Two or more races3,659 9.6% White alone, not Hispanic / Latino833 25.9% Hispanic or LatinoMoved within same state 1,216 3.1% White / Caucasian27 0.6% Black or African American17 9.9% American Indian / Alaska Native26 2.3% Asian19 81.0% Native Hawaiian / Pacific Islander21 2.9% Other race2 0.0% Two or more races1,219 3.2% White alone, not Hispanic / Latino96 3.0% Hispanic or LatinoMoved from different state 1,181 3.0% White / Caucasian166 3.8% Black or African American114 9.9% Asian19 2.6% Other race178 3.9% Two or more races1,127 2.9% White alone, not Hispanic / Latino92 2.9% Hispanic or LatinoMoved from abroad 45 0.1% White19 1.7% Asian6 0.8% Other race2 0.0% Two or more races40 0.1% White alone, not Hispanic / Latino32 1.0% Hispanic or Latino
Children Nativity (place of birth) in Mishawaka
Children under 6 years - Living with two parents Both parents native 1,666 98.1% Native32 1.9% Foreign-bornBoth parents foreign-born 87 88.3% Native12 11.7% Foreign-bornOne native, one foreign-born parent 91 86.7% Native14 13.3% Foreign-bornChildren under 6 years - Living with one parent Native parent 1,526 100.0% NativeChildren 6 to 17 years - Living with two parents Both parents native 2,753 95.9% Native117 4.1% Foreign-bornBoth parents foreign-born 47 20.8% Native181 79.2% Foreign-bornOne native, one foreign-born parent 187 100.0% NativeChildren 6 to 17 years - Living with one parent Native parent 2,564 98.3% Native45 1.7% Foreign-bornForeign-born parent 43 85.4% Native7 14.6% Foreign-born
Grandparents responsible for own grandchildren in Mishawaka
Grandparents (30 to 59 years) White / Caucasian 296 58.9% Responsible for grandchildren207 41.1% Not responsible for grandchildrenBlack or African American 120 84.5% Responsible for grandchildren22 15.5% Not responsible for grandchildrenOther race 13 100.0% Not responsible for grandchildrenTwo or more races 20 42.4% Responsible for grandchildren27 57.6% Not responsible for grandchildrenWhite alone, not Hispanic / Latino 302 61.1% Responsible for grandchildren192 38.9% Not responsible for grandchildrenGrandparents (60 years and over) White / Caucasian 59 29.2% Responsible for grandchildren144 70.8% Not responsible for grandchildrenOther race 30 100.0% Not responsible for grandchildrenTwo or more races 1 100.0% Not responsible for grandchildrenWhite alone, not Hispanic / Latino 62 31.4% Responsible for grandchildren136 68.6% Not responsible for grandchildren