Races in Mitchell, South Dakota (SD) Detailed Stats
Ancestries, Foreign-born residents, place of birth
Settings
X


Recent posts about races in Mitchell, South Dakota on our local forum with over 2,400,000 registered users:
 | Tell me the best things about Rapid City. (72 replies) |
| Small town around Sioux Falls? Recommendations? (18 replies) |
| Some questions about Brookings (6 replies) |
| Introductions / Hoping to move to SD from Illinois (15 replies) |
| Info on Mitchell (50 replies) |
| Chef Louie's, Mitchell SD? (25 replies) |
Latest news about races in Mitchell, SD collected exclusively by city-data.com from local newspapers, TV, and radio stations
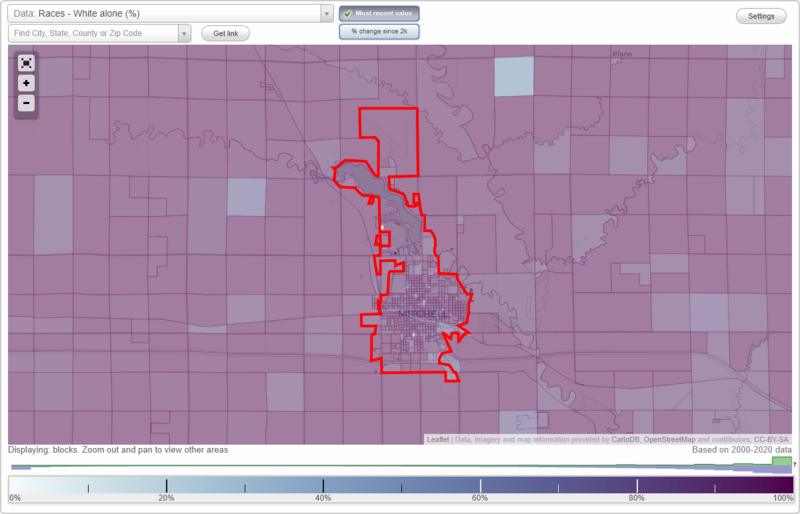
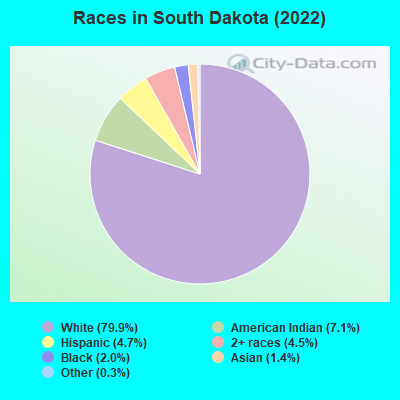
According to 2022 data, the most numerous races in Mitchell, SD are White alone (14,088 residents), American Indian alone (469 residents), and Hispanic (713 residents). 95.4% of Mitchell residents speak English at home. 1.8% of Mitchell, SD residents are foreign-born , which is 69.0% less than the foreign-born rate of 3.0% across the entire state of South Dakota.
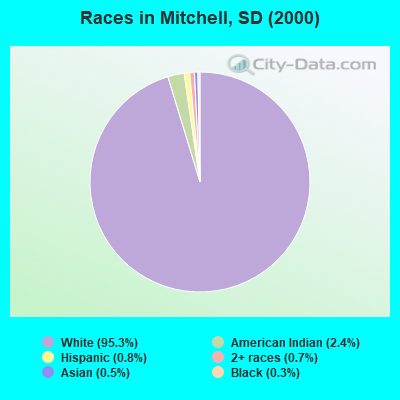
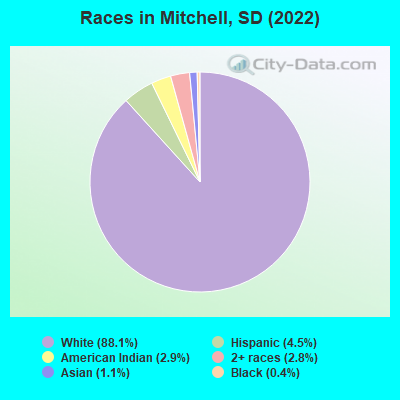
Race distribution in Mitchell
2000
2022

- 13,87995.3%White alone
- 3482.4%American Indian alone
- 1120.8%Hispanic
- 1050.7%Two or more races
- 660.5%Asian alone
- 440.3%Black alone
- 30.02%Native Hawaiian and Other
Pacific Islander alone - 10.01%Other race alone
-
- 14,08888.1%White alone
- 7134.5%Hispanic
- 4692.9%American Indian alone
- 4422.8%Two or more races
- 1811.1%Asian alone
- 670.4%Black alone
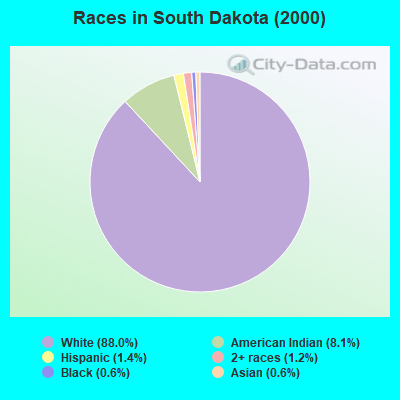
2000
2022
-
- 664,58588.0%White alone
- 60,9888.1%American Indian alone
- 10,9031.4%Hispanic
- 8,9601.2%Two or more races
- 4,5630.6%Black alone
- 4,3160.6%Asian alone
- 3100.04%Other race alone
- 2190.03%Native Hawaiian and Other
Pacific Islander alone
-
- 726,88579.9%White alone
- 64,6667.1%American Indian alone
- 42,4304.7%Hispanic
- 40,9844.5%Two or more races
- 18,0532.0%Black alone
- 12,8741.4%Asian alone
- 3,1360.3%Other race alone
- 7960.09%Native Hawaiian and Other
Pacific Islander alone
Income and house value in Mitchell
- Median household income in 2022
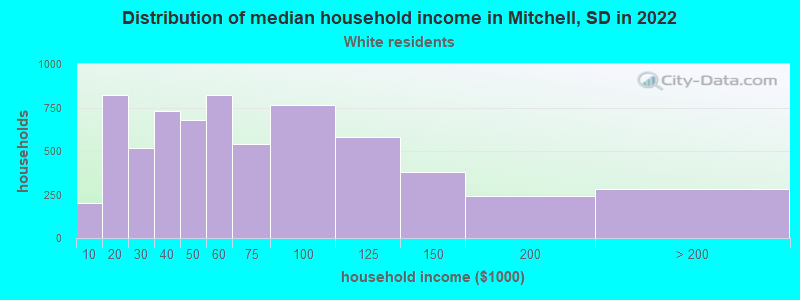
- $53,065White non-Hispanic householders
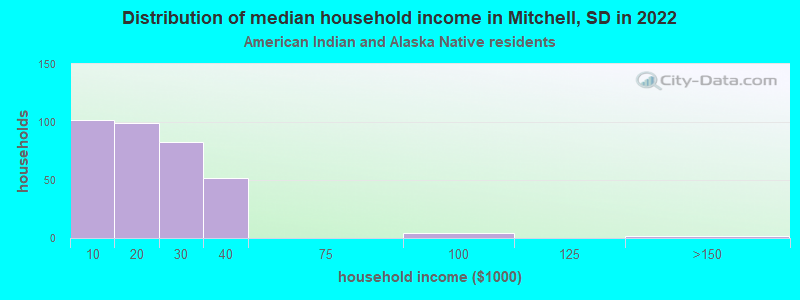
- $13,361American Indian and Alaska Native householders
- $69,213Two or more races householders
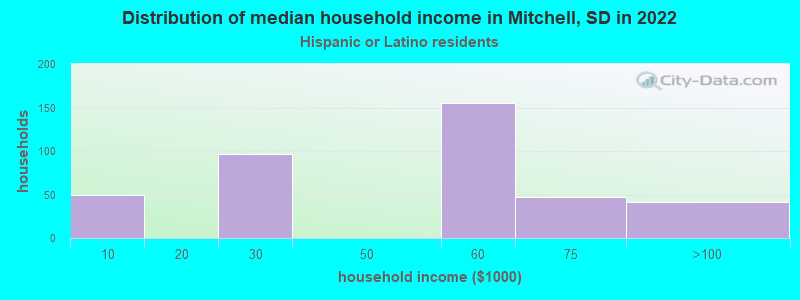
- $50,440Hispanic or Latino race householders
- Median 2022 house value
- $194,666White Non-Hispanic householders
- $181,539Black or African American householders
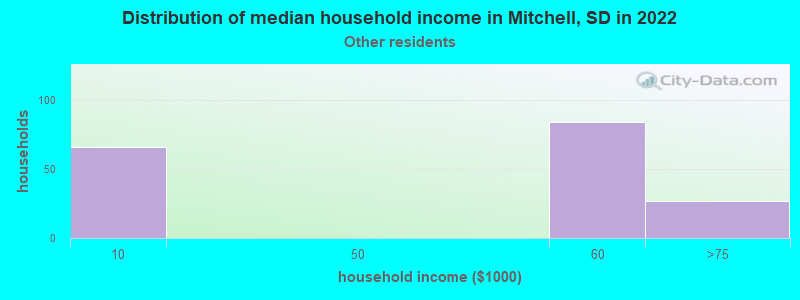
Household income for White non-Hispanic householders
Household income for American Indian and Alaska Native householders
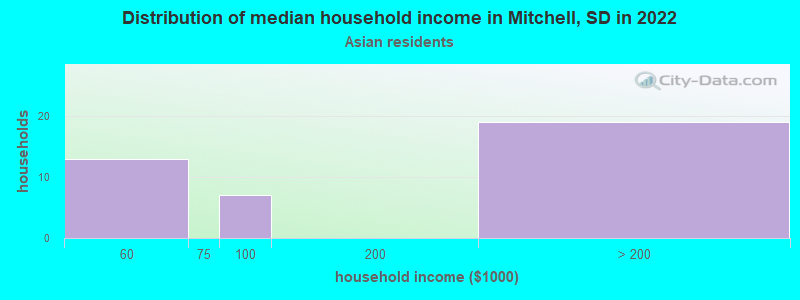
Household income for Asian householders
Household income for Some other race householders
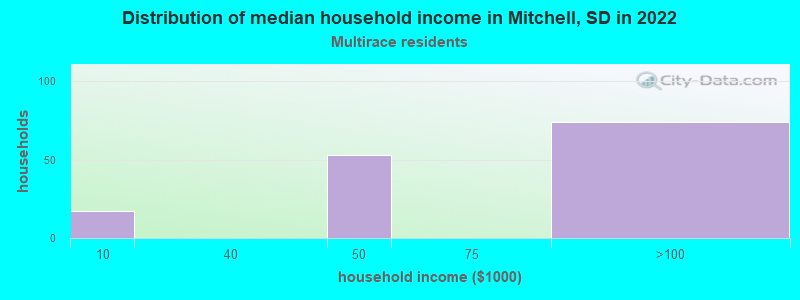
Household income for Two or more races householders
Household income for Hispanic or Latino race householders
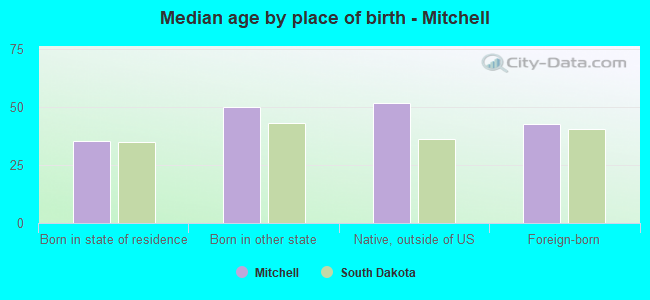
Median age by race in Mitchell
- 41.3Median age for White residents
- 38.9Males
- 43.8Females
- 49.7Median age for Black or African American residents
- 35.7Males
- -630,098,452.3Females
- 24.6Median age for American Indian / Alaska Native residents
- 30.5Males
- 18.0Females
- 22.4Median age for Asian residents
- 12.3Males
- 39.8Females
- -1,333,333,332.0Median age for Native Hawaiian / Pacific Islander residents
- -1,038,202,246.2Males
- -670,599,802.7Females
- 40.1Median age for Other race residents
- 30.0Males
- 57.3Females
- 20.9Median age for Two or more races residents
- 27.0Males
- 10.7Females
- 41.6Median age for White alone residents
- 40.0Males
- 44.0Females
- 28.8Median age for Hispanic or Latino residents
- 30.0Males
- 12.0Females
Owner/renter occupied households by race in Mitchell
- House owners and renters - White residents
- 4,22264.4%Owner occupied
- 2,33135.6%Renter occupied
- House owners and renters - American Indian / Alaska Native residents
- 31.1%Owner occupied
- 29498.9%Renter occupied
- House owners and renters - Asian residents
- 2360.8%Owner occupied
- 1539.2%Renter occupied
- House owners and renters - Other race residents
- 258100.0%Renter occupied
- House owners and renters - Two or more races residents
- 10867.1%Owner occupied
- 5332.9%Renter occupied
- House owners and renters - White alone residents
- 4,23264.8%Owner occupied
- 2,30035.2%Renter occupied
- House owners and renters - Hispanic or Latino residents
- 4213.2%Owner occupied
- 27586.8%Renter occupied
Language usage in Mitchell
- English speakers - Total
- 95.4% of residents of Mitchell speak English at home.
- 2.8% of residents speak Spanish at home
- 24057.8%Speak English very well
- 17542.2%Speak English less than very well
- 1.4% of residents speak other language at home
- 12863.1%Speak English very well
- 7536.9%Speak English less than very well
- English speakers - Born in the United States
- 94.2% of residents of Mitchell speak English at home.
- 5.0% of residents speak Spanish at home
- 190100.0%Speak English very well
- 0.8% of residents speak other language at home
- 619.4%Speak English very well
- 2580.6%Speak English less than very well
- English speakers - Native, born elsewhere
- 90.4% of residents of Mitchell speak English at home.
- 8.4% of residents speak other language at home
- 7100.0%Speak English very well
- English speakers - Foreign-born
- 32.6% of residents of Mitchell speak English at home.
- 74.3% of residents speak Spanish at home
- 194100.0%Speak English less than very well
- 11.1% of residents speak other language at home
- 1344.8%Speak English very well
- 1655.2%Speak English less than very well
White (Caucasian) - Speak only English
| Native: | 98.1% (13,215) |
| Foreign-born: | 100.0% (18) |
Black or African American - Speak only English
| Native: | 100.0% (62) |
| Foreign-born: | 100.0% (11) |
Asian - Speak only English
| Native: | 91.5% (110) |
| Foreign-born: | 39.0% (28) |
Other race - Speak another language
| Native: | 81.2% (87) |
| Foreign-born: | 100.0% (293) |
Two or more races - Speak another language
| Native: | 11.9% (44) |
| Foreign-born: | 100.0% (17) |
White alone - Speak only English
| Native: | 98.6% (13,115) |
| Foreign-born: | 94.5% (20) |
Hispanic or Latino - Speak another language
| Native: | 47.5% (199) |
| Foreign-born: | 100.0% (172) |
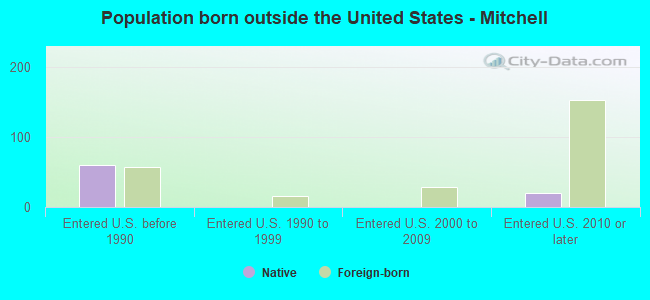
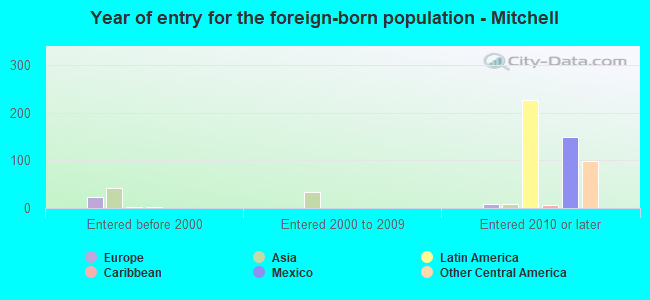
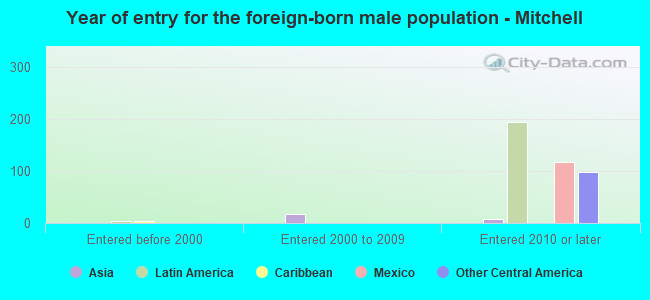
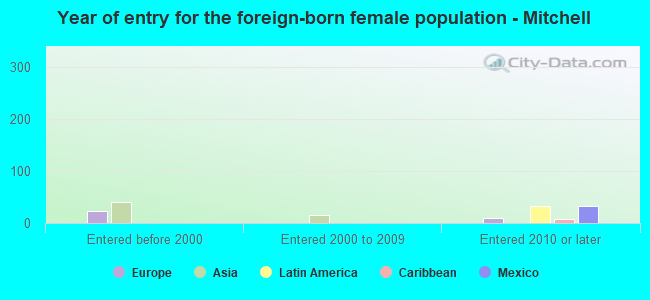
Foreign-born residents in Mitchell
284 residents are foreign born
| This city: | 1.8% |
| South Dakota: | 3.8% |

Marital status for residents in Mitchell
Marital status - White (Caucasian) population 15 years and over
- Males
- 36.3%Never married
- 46.7%Now married
- 1.4%Separated
- 3.9%Widowed
- 11.6%Divorced
- Females
- 27.6%Never married
- 47.9%Now married
- 0.5%Separated
- 13.8%Widowed
- 10.2%Divorced
Women who gave birth in the past 12 months
| Now married: | 79.8% (71) |
| Unmarried: | 20.2% (18) |
Women who did not give birth in the past 12 months
| Now married: | 44.3% (1,180) |
| Unmarried: | 55.7% (1,487) |
Marital status - Black or African American population 15 years and over
- Males
- 75.0%Never married
- 25.0%Now married
- 0.0%Separated
- 0.0%Widowed
- 0.0%Divorced
- Females
- 71.7%Never married
- 28.3%Now married
- 0.0%Separated
- 0.0%Widowed
- 0.0%Divorced
Women who did not give birth in the past 12 months
| Now married: | 28.3% (16) |
| Unmarried: | 71.7% (40) |
Marital status - American Indian / Alaska Native population 15 years and over
- Males
- 67.7%Never married
- 3.4%Now married
- 0.0%Separated
- 0.0%Widowed
- 29.0%Divorced
- Females
- 87.2%Never married
- 3.3%Now married
- 0.0%Separated
- 8.3%Widowed
- 1.1%Divorced
Women who did not give birth in the past 12 months
| Now married: | 1.7% (3) |
| Unmarried: | 98.3% (170) |
Marital status - Asian population 15 years and over
- Males
- 54.5%Never married
- 45.5%Now married
- 0.0%Separated
- 0.0%Widowed
- 0.0%Divorced
- Females
- 78.7%Never married
- 21.3%Now married
- 0.0%Separated
- 0.0%Widowed
- 0.0%Divorced
Women who did not give birth in the past 12 months
| Now married: | 9.2% (6) |
| Unmarried: | 90.8% (57) |
Marital status - Other race population 15 years and over
- Males
- 55.7%Never married
- 32.2%Now married
- 12.1%Separated
- 0.0%Widowed
- 0.0%Divorced
- Females
- 4.0%Never married
- 48.0%Now married
- 48.0%Separated
- 0.0%Widowed
- 0.0%Divorced
Women who did not give birth in the past 12 months
| Now married: | 92.3% (31) |
| Unmarried: | 7.7% (3) |
Marital status - Two or more races population 15 years and over
- Males
- 75.7%Never married
- 24.3%Now married
- 0.0%Separated
- 0.0%Widowed
- 0.0%Divorced
- Females
- 46.3%Never married
- 39.6%Now married
- 3.7%Separated
- 0.0%Widowed
- 10.4%Divorced
Women who did not give birth in the past 12 months
| Now married: | 32.7% (43) |
| Unmarried: | 67.3% (88) |
Marital status - White alone, not Hispanic / Latino population 15 years and over
- Males
- 35.5%Never married
- 47.2%Now married
- 1.4%Separated
- 4.0%Widowed
- 11.9%Divorced
- Females
- 27.7%Never married
- 47.7%Now married
- 0.5%Separated
- 13.8%Widowed
- 10.3%Divorced
Women who gave birth in the past 12 months
| Now married: | 79.8% (71) |
| Unmarried: | 20.2% (18) |
Women who did not give birth in the past 12 months
| Now married: | 43.8% (1,166) |
| Unmarried: | 56.2% (1,498) |
Marital status - Hispanic or Latino population 15 years and over
- Males
- 64.5%Never married
- 28.3%Now married
- 7.2%Separated
- 0.0%Widowed
- 0.0%Divorced
- Females
- 56.2%Never married
- 29.0%Now married
- 14.8%Separated
- 0.0%Widowed
- 0.0%Divorced
Women who did not give birth in the past 12 months
| Now married: | 34.1% (49) |
| Unmarried: | 65.9% (95) |
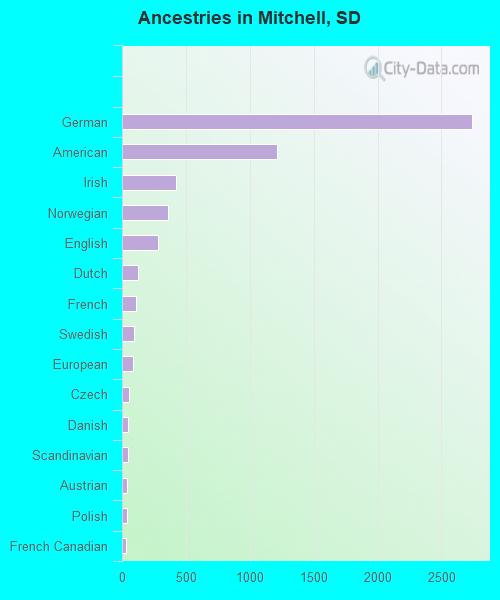
Ancestries in Mitchell

- 2,73538.6%German
- 1,21617.2%American
- 4236.0%Irish
- 3595.1%Norwegian
- 2814.0%English
- 1291.8%Dutch
- 1101.6%French
- 961.4%Swedish
- 851.2%European
- 570.8%Czech
- 470.7%Danish
- 470.7%Scandinavian
- 430.6%Austrian
- 410.6%Polish
- 340.5%French Canadian
- 220.3%Lebanese
- 210.3%Russian
- 170.2%Jamaican
- 160.2%Finnish
- 140.2%Pennsylvania German
- 130.2%Scottish
- 120.2%Czechoslovakian
- 60.08%Luxembourger
- 50.07%Italian
- 40.06%Hungarian
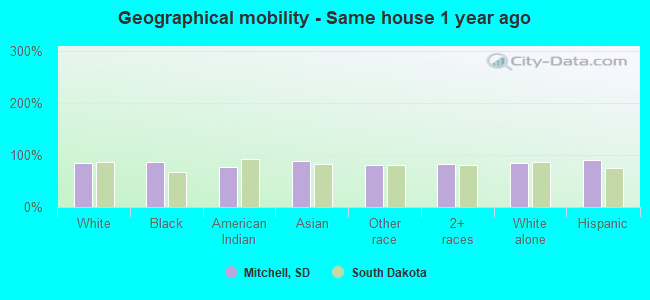
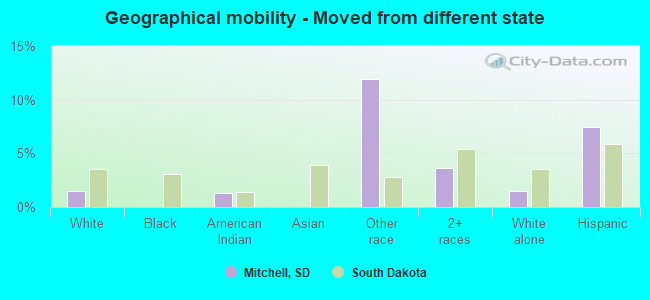
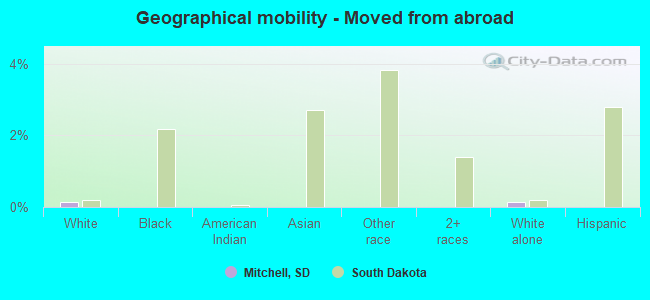
Geographical mobility in Mitchell

- Same house 1 year ago
- 12,00184.9%White (Caucasian)
- 5885.8%Black or African American
- 49677.9%American Indian / Alaska Native
- 16189.4%Asian
- 28881.4%Other race
- 40182.3%Two or more races
- 11,85684.6%White alone, not Hispanic / Latino
- 64390.6%Hispanic or Latino
-
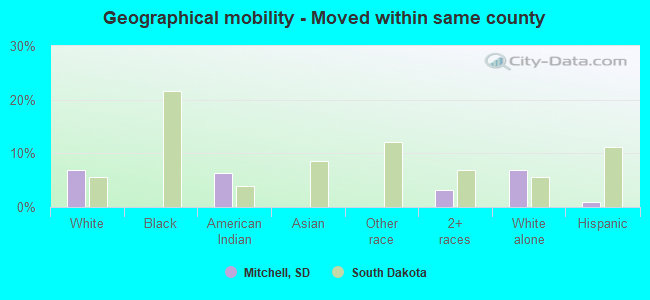
- Moved within same county
- 9796.9%White / Caucasian
- 406.3%American Indian / Alaska Native
- 163.2%Two or more races
- 9777.0%White alone, not Hispanic / Latino
- 60.8%Hispanic or Latino
-
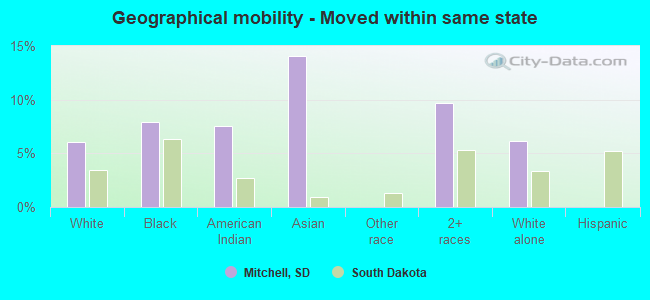
- Moved within same state
- 8506.0%White / Caucasian
- 57.9%Black or African American
- 487.6%American Indian / Alaska Native
- 2514.0%Asian
- 479.7%Two or more races
- 8586.1%White alone, not Hispanic / Latino
-
- Moved from different state
- 2041.4%White / Caucasian
- 81.3%American Indian / Alaska Native
- 4212.0%Other race
- 183.7%Two or more races
- 2061.5%White alone, not Hispanic / Latino
- 537.5%Hispanic or Latino
-
- Moved from abroad
- 180.1%White
- 200.1%White alone, not Hispanic / Latino
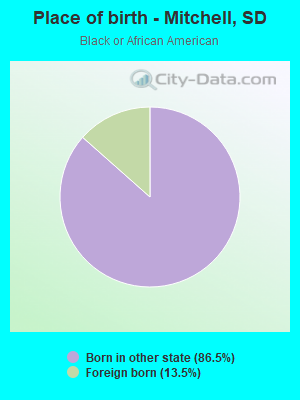
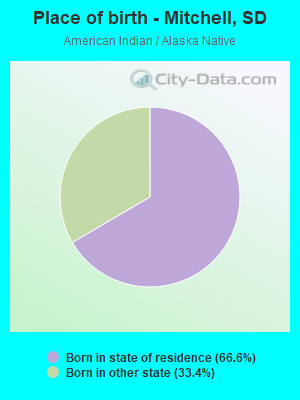
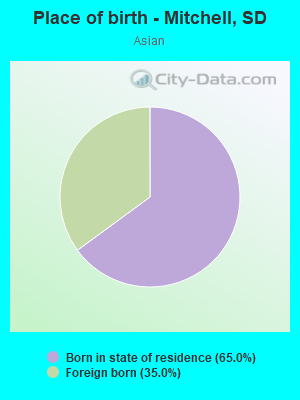
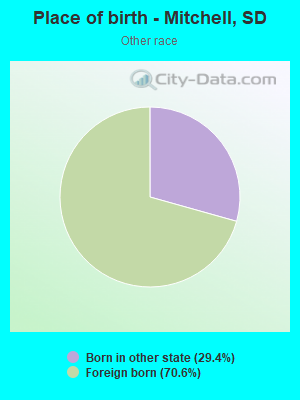
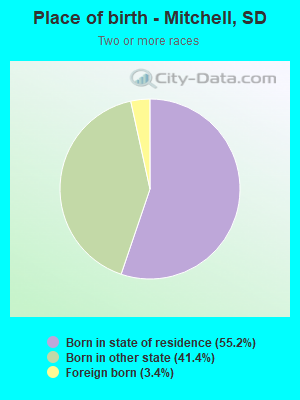
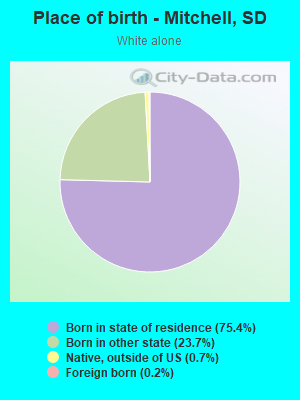
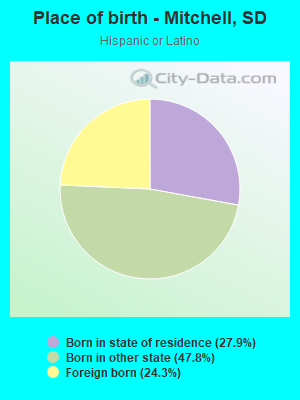
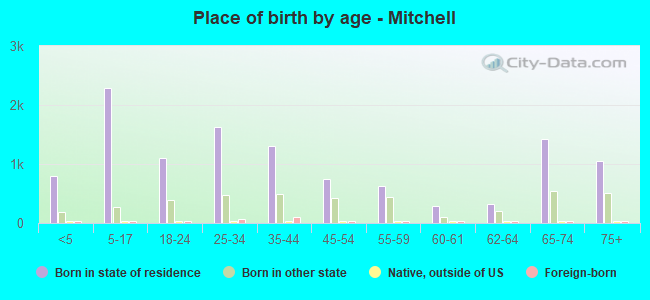
Children Nativity (place of birth) in Mitchell
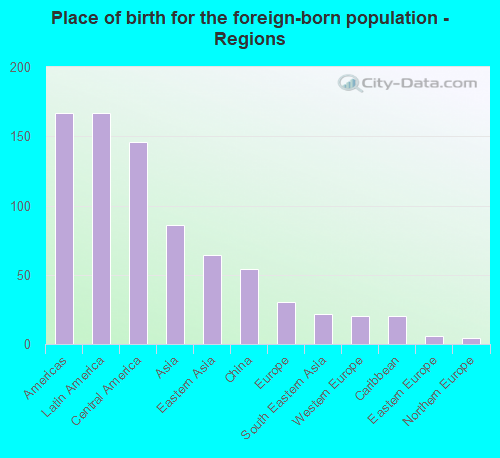
Place of birth for residents in Mitchell
![Place of birth for the foreign-born population - Regions]()
- 167Americas
- 167Latin America
- 146Central America
- 86Asia
- 64Eastern Asia
- 54China
- 30Europe
- 22South Eastern Asia
- 20Western Europe
- 20Caribbean
- 6Eastern Europe
- 4Northern Europe
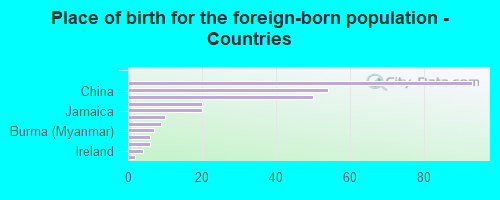
![Place of birth for the foreign-born population - Countries]()
- 93Mexico
- 54China
- 50Guatemala
- 20Germany
- 20Jamaica
- 10Korea
- 9Thailand
- 7Burma (Myanmar)
- 6Russia
- 6Philippines
- 4Ireland
- 2El Salvador
Zip codes: 57301.