Races in Monroe, North Carolina (NC) Detailed Stats
Data:
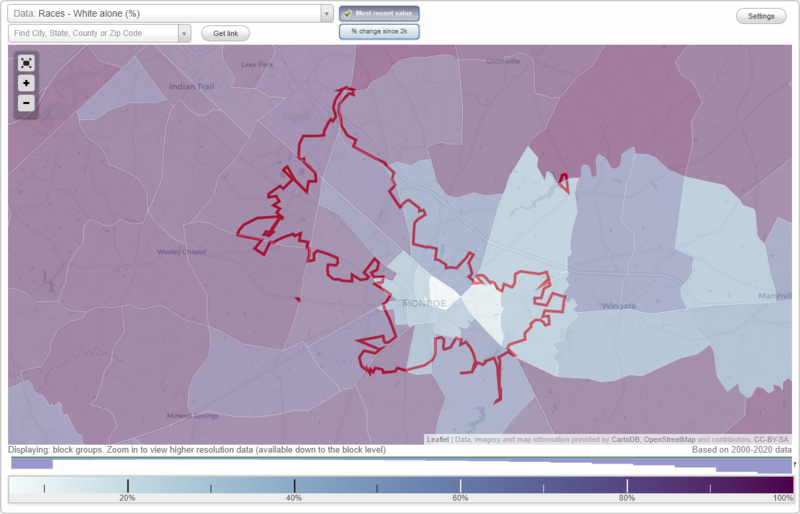
Races - White alone (%)
Races - White alone (% change since 2000)
Races - Black alone (%)
Races - Black alone (% change since 2000)
Races - American Indian alone (%)
Races - American Indian alone (% change since 2000)
Races - Asian alone (%)
Races - Asian alone (% change since 2000)
Races - Hispanic (%)
Races - Hispanic (% change since 2000)
Races - Native Hawaiian and Other Pacific Islander alone (%)
Races - Native Hawaiian and Other Pacific Islander alone (% change since 2000)
Races - Two or more races(%)
Races - Two or more races(% change since 2000)
Races - Other race alone (%)
Races - Other race alone (% change since 2000)
Racial diversity
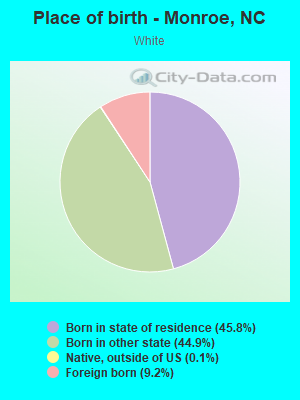
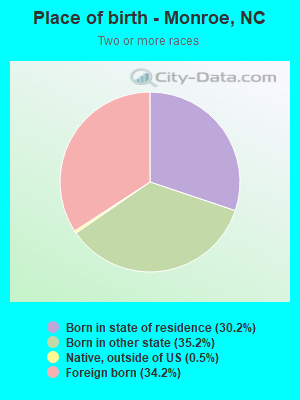
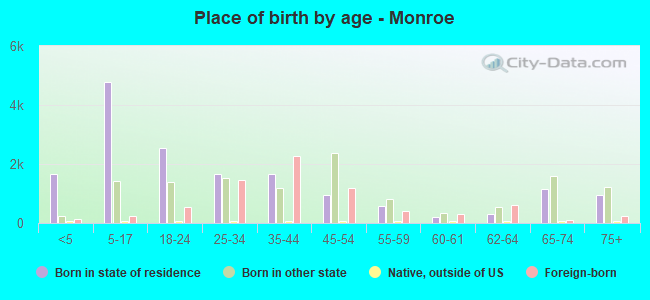
Place of birth - Born in state of residence (%)
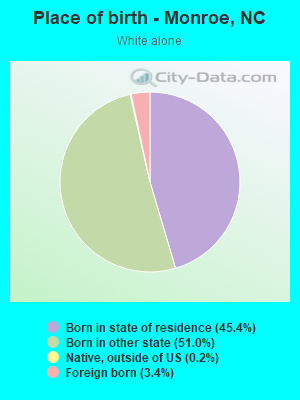
Place of birth - Born in state of residence (%) - White
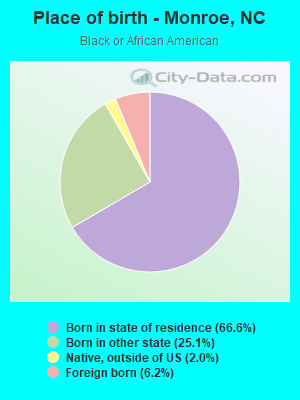
Place of birth - Born in state of residence (%) - Black or African American
Place of birth - Born in state of residence (%) - Asian
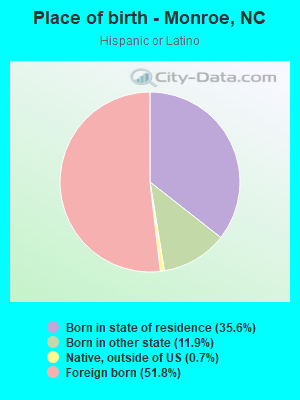
Place of birth - Born in state of residence (%) - Hispanic or Latino
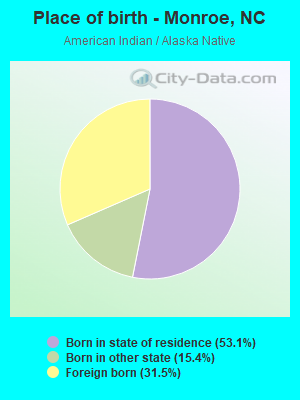
Place of birth - Born in state of residence (%) - American Indian and Alaska Native
Place of birth - Born in state of residence (%) - Multirace
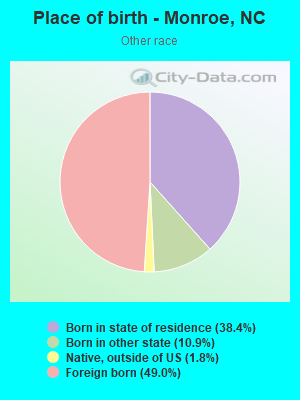
Place of birth - Born in state of residence (%) - Other Race
Place of birth - Born in other state (%)
Place of birth - Born in other state (%) - White
Place of birth - Born in other state (%) - Black or African American
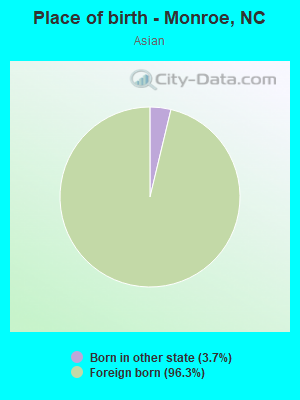
Place of birth - Born in other state (%) - Asian
Place of birth - Born in other state (%) - Hispanic or Latino
Place of birth - Born in other state (%) - American Indian and Alaska Native
Place of birth - Born in other state (%) - Multirace
Place of birth - Born in other state (%) - Other Race
Place of birth - Native, outside of US (%)
Place of birth - Native, outside of US (%) - White
Place of birth - Native, outside of US (%) - Black or African American
Place of birth - Native, outside of US (%) - Asian
Place of birth - Native, outside of US (%) - Hispanic or Latino
Place of birth - Native, outside of US (%) - American Indian and Alaska Native
Place of birth - Native, outside of US (%) - Multirace
Place of birth - Native, outside of US (%) - Other Race
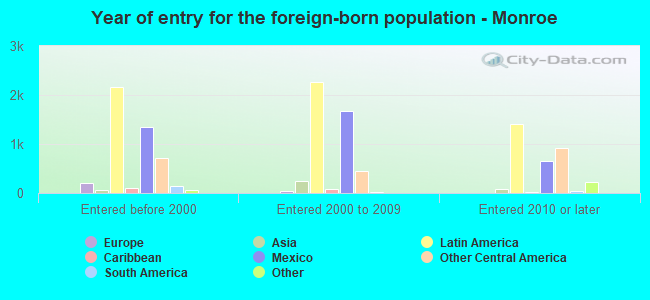
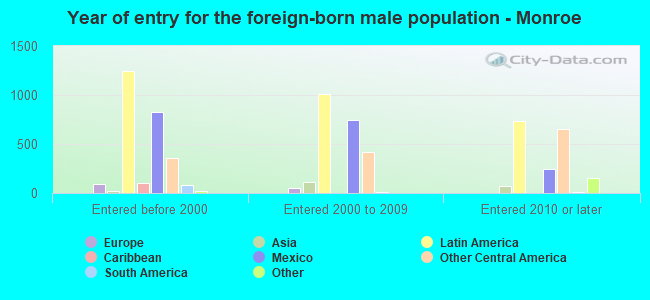
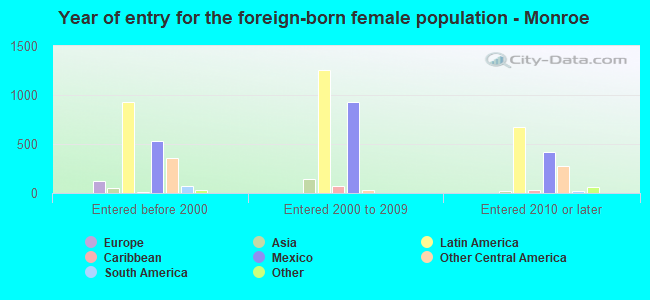
Place of birth - Foreign born (%)
Place of birth - Foreign born (%) - White
Place of birth - Foreign born (%) - Black or African American
Place of birth - Foreign born (%) - Asian
Place of birth - Foreign born (%) - Hispanic or Latino
Place of birth - Foreign born (%) - American Indian and Alaska Native
Place of birth - Foreign born (%) - Multirace
Place of birth - Foreign born (%) - Other Race
Residents speaking English at home (%)
Residents speaking English at home - Born in the United States (%)
Residents speaking English at home - Native, born elsewhere (%)
Residents speaking English at home - Foreign born (%)
Residents speaking Spanish at home (%)
Residents speaking Spanish at home - Born in the United States (%)
Residents speaking Spanish at home - Native, born elsewhere (%)
Residents speaking Spanish at home - Foreign born (%)
Residents speaking other language at home (%)
Residents speaking other language at home - Born in the United States (%)
Residents speaking other language at home - Native, born elsewhere (%)
Residents speaking other language at home - Foreign born (%)
Marital status - Never married (%)
Marital status - Now married (%)
Marital status - Separated (%)
Marital status - Widowed (%)
Marital status - Divorced (%)
Ancestries Reported - Arab (%)
Ancestries Reported - Czech (%)
Ancestries Reported - Danish (%)
Ancestries Reported - Dutch (%)
Ancestries Reported - English (%)
Ancestries Reported - French (%)
Ancestries Reported - French Canadian (%)
Ancestries Reported - German (%)
Ancestries Reported - Greek (%)
Ancestries Reported - Hungarian (%)
Ancestries Reported - Irish (%)
Ancestries Reported - Italian (%)
Ancestries Reported - Lithuanian (%)
Ancestries Reported - Norwegian (%)
Ancestries Reported - Polish (%)
Ancestries Reported - Portuguese (%)
Ancestries Reported - Russian (%)
Ancestries Reported - Scotch-Irish (%)
Ancestries Reported - Scottish (%)
Ancestries Reported - Slovak (%)
Ancestries Reported - Subsaharan African (%)
Ancestries Reported - Swedish (%)
Ancestries Reported - Swiss (%)
Ancestries Reported - Ukrainian (%)
Ancestries Reported - United States (%)
Ancestries Reported - Welsh (%)
Ancestries Reported - West Indian (%)
Ancestries Reported - Other (%)
Geographical mobility - Same house 1 year ago (%)
Geographical mobility - Same house 1 year ago (%) - White
Geographical mobility - Same house 1 year ago (%) - Black or African American
Geographical mobility - Same house 1 year ago (%) - Asian
Geographical mobility - Same house 1 year ago (%) - Hispanic or Latino
Geographical mobility - Same house 1 year ago (%) - American Indian and Alaska Native
Geographical mobility - Same house 1 year ago (%) - Multirace
Geographical mobility - Same house 1 year ago (%) - Other Race
Geographical mobility - Moved within same county (%)
Geographical mobility - Moved within same county (%) - White
Geographical mobility - Moved within same county (%) - Black or African American
Geographical mobility - Moved within same county (%) - Asian
Geographical mobility - Moved within same county (%) - Hispanic or Latino
Geographical mobility - Moved within same county (%) - American Indian and Alaska Native
Geographical mobility - Moved within same county (%) - Multirace
Geographical mobility - Moved within same county (%) - Other Race
Geographical mobility - Moved from different county within same state (%)
Geographical mobility - Moved from different county within same state (%) - White
Geographical mobility - Moved from different county within same state (%) - Black or African American
Geographical mobility - Moved from different county within same state (%) - Asian
Geographical mobility - Moved from different county within same state (%) - Hispanic or Latino
Geographical mobility - Moved from different county within same state (%) - American Indian and Alaska Native
Geographical mobility - Moved from different county within same state (%) - Multirace
Geographical mobility - Moved from different county within same state (%) - Other Race
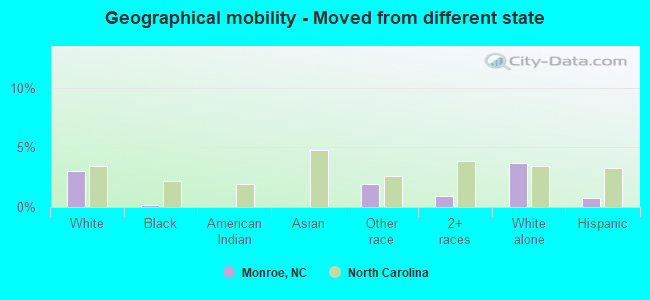
Geographical mobility - Moved from different state (%)
Geographical mobility - Moved from different state (%) - White
Geographical mobility - Moved from different state (%) - Black or African American
Geographical mobility - Moved from different state (%) - Asian
Geographical mobility - Moved from different state (%) - Hispanic or Latino
Geographical mobility - Moved from different state (%) - American Indian and Alaska Native
Geographical mobility - Moved from different state (%) - Multirace
Geographical mobility - Moved from different state (%) - Other Race
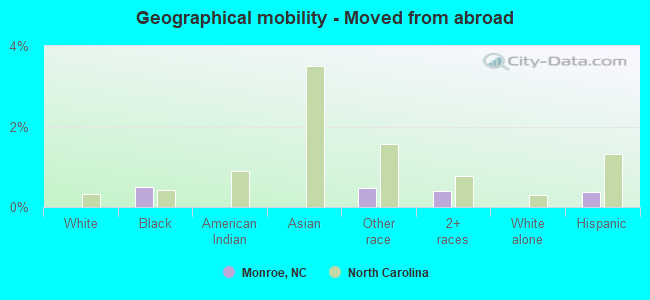
Geographical mobility - Moved from abroad (%)
Geographical mobility - Moved from abroad (%) - White
Geographical mobility - Moved from abroad (%) - Black or African American
Geographical mobility - Moved from abroad (%) - Asian
Geographical mobility - Moved from abroad (%) - Hispanic or Latino
Geographical mobility - Moved from abroad (%) - American Indian and Alaska Native
Geographical mobility - Moved from abroad (%) - Multirace
Geographical mobility - Moved from abroad (%) - Other Race
Place of birth for the foreign-born population - Ireland (%)
Place of birth for the foreign-born population - Denmark (%)
Place of birth for the foreign-born population - Norway (%)
Place of birth for the foreign-born population - Sweden (%)
Place of birth for the foreign-born population - United Kingdom (%)
Place of birth for the foreign-born population - England (%)
Place of birth for the foreign-born population - Scotland (%)
Place of birth for the foreign-born population - Other Northern Europe (%)
Place of birth for the foreign-born population - Austria (%)
Place of birth for the foreign-born population - Belgium (%)
Place of birth for the foreign-born population - France (%)
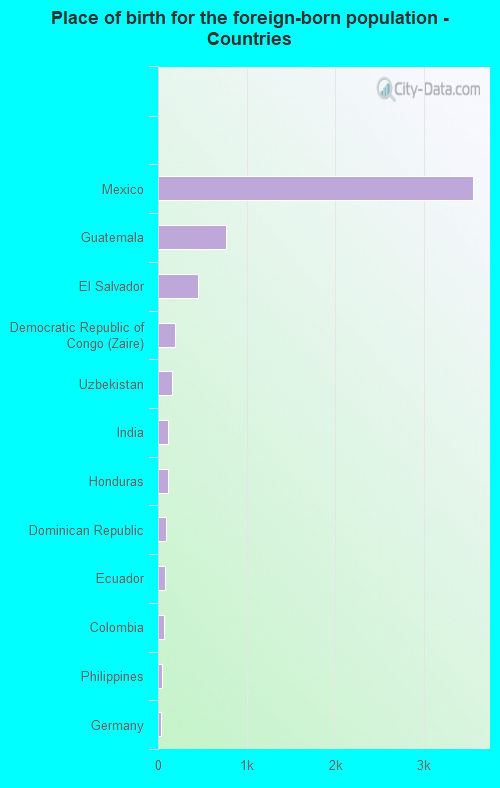
Place of birth for the foreign-born population - Germany (%)
Place of birth for the foreign-born population - Netherlands (%)
Place of birth for the foreign-born population - Switzerland (%)
Place of birth for the foreign-born population - Other Western Europe (%)
Place of birth for the foreign-born population - Greece (%)
Place of birth for the foreign-born population - Italy (%)
Place of birth for the foreign-born population - Portugal (%)
Place of birth for the foreign-born population - Spain (%)
Place of birth for the foreign-born population - Other Southern Europe (%)
Place of birth for the foreign-born population - Albania (%)
Place of birth for the foreign-born population - Belarus (%)
Place of birth for the foreign-born population - Bosnia and Herzegovina (%)
Place of birth for the foreign-born population - Bulgaria (%)
Place of birth for the foreign-born population - Croatia (%)
Place of birth for the foreign-born population - Czechoslovakia (%)
Place of birth for the foreign-born population - Hungary (%)
Place of birth for the foreign-born population - Latvia (%)
Place of birth for the foreign-born population - Lithuania (%)
Place of birth for the foreign-born population - North Macedonia (Macedonia) (%)
Place of birth for the foreign-born population - Moldova (%)
Place of birth for the foreign-born population - Poland (%)
Place of birth for the foreign-born population - Romania (%)
Place of birth for the foreign-born population - Russia (%)
Place of birth for the foreign-born population - Serbia (%)
Place of birth for the foreign-born population - Ukraine (%)
Place of birth for the foreign-born population - Other Eastern Europe (%)
Place of birth for the foreign-born population - China (%)
Place of birth for the foreign-born population - Hong Kong (%)
Place of birth for the foreign-born population - Taiwan (%)
Place of birth for the foreign-born population - Japan (%)
Place of birth for the foreign-born population - Korea (%)
Place of birth for the foreign-born population - Other Eastern Asia (%)
Place of birth for the foreign-born population - Afghanistan (%)
Place of birth for the foreign-born population - Bangladesh (%)
Place of birth for the foreign-born population - India (%)
Place of birth for the foreign-born population - Iran (%)
Place of birth for the foreign-born population - Kazakhstan (%)
Place of birth for the foreign-born population - Nepal (%)
Place of birth for the foreign-born population - Pakistan (%)
Place of birth for the foreign-born population - Sri Lanka (%)
Place of birth for the foreign-born population - Uzbekistan (%)
Place of birth for the foreign-born population - Other South Central Asia (%)
Place of birth for the foreign-born population - Burma (%)
Place of birth for the foreign-born population - Cambodia (%)
Place of birth for the foreign-born population - Indonesia (%)
Place of birth for the foreign-born population - Laos (%)
Place of birth for the foreign-born population - Malaysia (%)
Place of birth for the foreign-born population - Philippines (%)
Place of birth for the foreign-born population - Singapore (%)
Place of birth for the foreign-born population - Thailand (%)
Place of birth for the foreign-born population - Vietnam (%)
Place of birth for the foreign-born population - Other South Eastern Asia (%)
Place of birth for the foreign-born population - Armenia (%)
Place of birth for the foreign-born population - Iraq (%)
Place of birth for the foreign-born population - Israel (%)
Place of birth for the foreign-born population - Jordan (%)
Place of birth for the foreign-born population - Kuwait (%)
Place of birth for the foreign-born population - Lebanon (%)
Place of birth for the foreign-born population - Saudi Arabia (%)
Place of birth for the foreign-born population - Syria (%)
Place of birth for the foreign-born population - Turkey (%)
Place of birth for the foreign-born population - Yemen (%)
Place of birth for the foreign-born population - Other Western Asia (%)
Place of birth for the foreign-born population - Eritrea (%)
Place of birth for the foreign-born population - Ethiopia (%)
Place of birth for the foreign-born population - Kenya (%)
Place of birth for the foreign-born population - Somalia (%)
Place of birth for the foreign-born population - Uganda (%)
Place of birth for the foreign-born population - Zimbabwe (%)
Place of birth for the foreign-born population - Other Eastern Africa (%)
Place of birth for the foreign-born population - Cameroon (%)
Place of birth for the foreign-born population - Congo (%)
Place of birth for the foreign-born population - Democratic Republic of Congo (Zaire) (%)
Place of birth for the foreign-born population - Other Middle Africa (%)
Place of birth for the foreign-born population - Egypt (%)
Place of birth for the foreign-born population - Morocco (%)
Place of birth for the foreign-born population - Sudan (%)
Place of birth for the foreign-born population - Other Northern Africa (%)
Place of birth for the foreign-born population - South Africa (%)
Place of birth for the foreign-born population - Other Southern Africa (%)
Place of birth for the foreign-born population - Cabo Verde (%)
Place of birth for the foreign-born population - Ghana (%)
Place of birth for the foreign-born population - Liberia (%)
Place of birth for the foreign-born population - Nigeria (%)
Place of birth for the foreign-born population - Senegal (%)
Place of birth for the foreign-born population - Sierra Leone (%)
Place of birth for the foreign-born population - Other Western Africa (%)
Place of birth for the foreign-born population - Australia (%)
Place of birth for the foreign-born population - New Zealand (%)
Place of birth for the foreign-born population - Fiji (%)
Place of birth for the foreign-born population - Micronesia (%)
Place of birth for the foreign-born population - Bahamas (%)
Place of birth for the foreign-born population - Barbados (%)
Place of birth for the foreign-born population - Cuba (%)
Place of birth for the foreign-born population - Dominica (%)
Place of birth for the foreign-born population - Dominican Republic (%)
Place of birth for the foreign-born population - Grenada (%)
Place of birth for the foreign-born population - Haiti (%)
Place of birth for the foreign-born population - Jamaica (%)
Place of birth for the foreign-born population - St. Vincent and the Grenadines (%)
Place of birth for the foreign-born population - Trinidad and Tobago (%)
Place of birth for the foreign-born population - West Indies (%)
Place of birth for the foreign-born population - Other Caribbean (%)
Place of birth for the foreign-born population - Belize (%)
Place of birth for the foreign-born population - Costa Rica (%)
Place of birth for the foreign-born population - El Salvador (%)
Place of birth for the foreign-born population - Guatemala (%)
Place of birth for the foreign-born population - Honduras (%)
Place of birth for the foreign-born population - Mexico (%)
Place of birth for the foreign-born population - Nicaragua (%)
Place of birth for the foreign-born population - Panama (%)
Place of birth for the foreign-born population - Other Central America (%)
Place of birth for the foreign-born population - Argentina (%)
Place of birth for the foreign-born population - Bolivia (%)
Place of birth for the foreign-born population - Brazil (%)
Place of birth for the foreign-born population - Chile (%)
Place of birth for the foreign-born population - Colombia (%)
Place of birth for the foreign-born population - Ecuador (%)
Place of birth for the foreign-born population - Guyana (%)
Place of birth for the foreign-born population - Peru (%)
Place of birth for the foreign-born population - Uruguay (%)
Place of birth for the foreign-born population - Venezuela (%)
Place of birth for the foreign-born population - Other South America (%)
Place of birth for the foreign-born population - Canada (%)
Place of birth for the foreign-born population - Other Northern America (%)
Place of birth for the foreign-born population - Other (%)
Latest news about races in Monroe, NC collected exclusively by city-data.com from local newspapers, TV, and radio stations
According to 2022 data, the most numerous races in Monroe, NC are White alone (15,512 residents), Black alone (7,689 residents), and Hispanic (10,655 residents). 69.9% of Monroe residents speak English at home. 17.0% of Monroe, NC residents are foreign-born (14.5% born in Latin America), which is 52.8% greater than the foreign-born rate of 8.0% across the entire state of North Carolina.
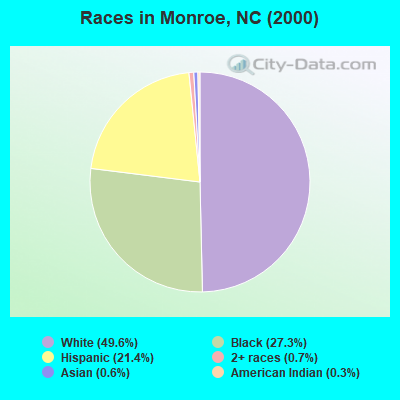
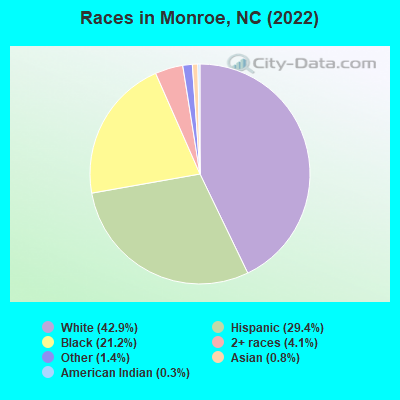
Race distribution in Monroe
2000 2022
5,647,155 70.2% White alone 1,723,301 21.4% Black alone 378,963 4.7% Hispanic 112,416 1.4% Asian alone 95,333 1.2% American Indian alone 79,965 1.0% Two or more races 9,015 0.1% Other race alone 3,165 0.04% Native Hawaiian and Other
6,497,519 60.7% White alone 2,155,650 20.1% Black alone 1,114,799 10.4% Hispanic 438,061 4.1% Two or more races 341,052 3.2% Asian alone 91,758 0.9% American Indian alone 50,180 0.5% Other race alone 9,954 0.09% Native Hawaiian and Other
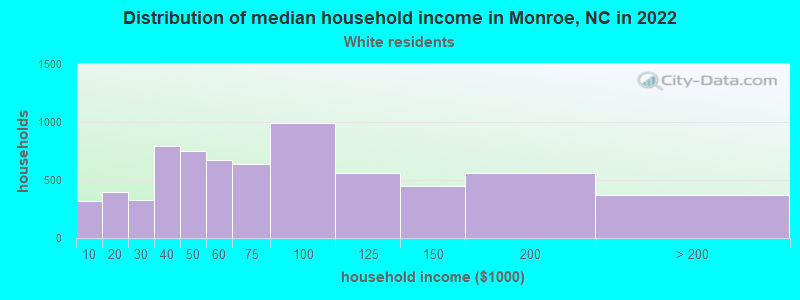
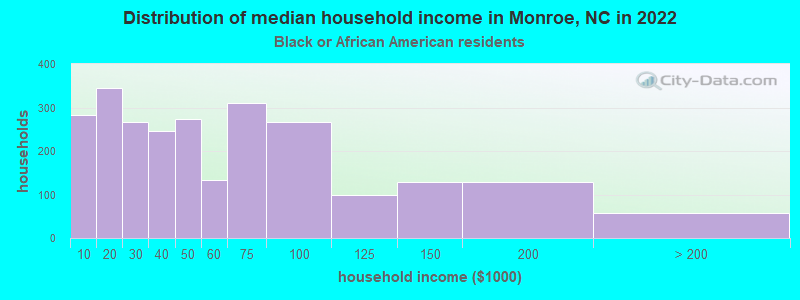
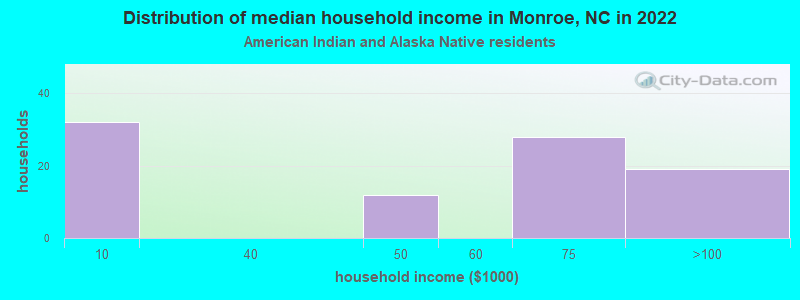
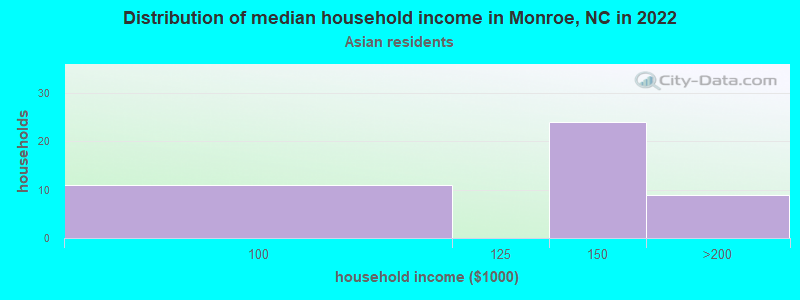
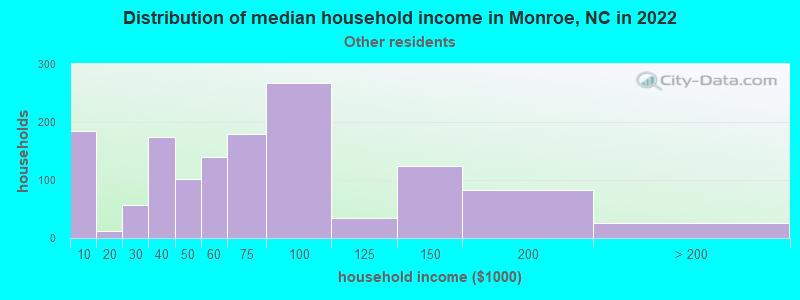
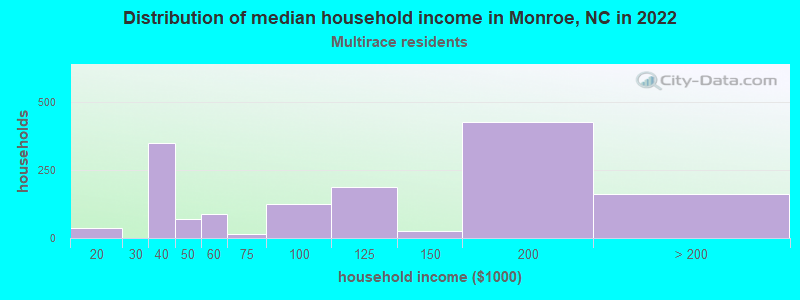
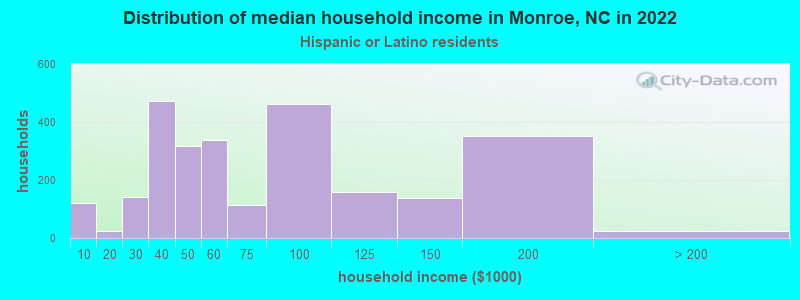
Income and house value in Monroe Median household income in 2022 $66,674 White non-Hispanic householders$61,666 Black householders$73,461 American Indian and Alaska Native householders$115,542 Asian householders$60,507 Some other race householders$129,747 Two or more races householders$60,239 Hispanic or Latino race householdersMedian 2022 house value $312,680 White Non-Hispanic householders$210,378 Black or African American householders$229,078 Some other race householders$279,404 Two or more races householders$240,354 Hispanic or Latino householders
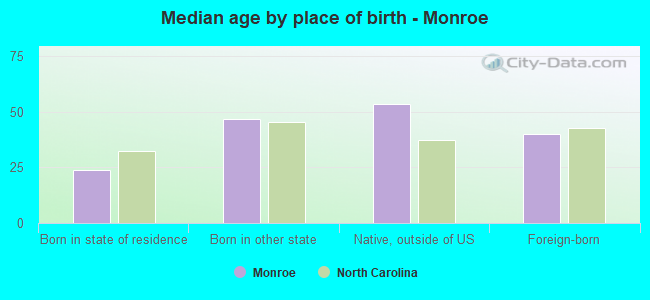
Median age by race in Monroe
40.2 Median age for White residents38.2 43.7 38.0 Median age for Black or African American residents34.8 43.0 24.0 Median age for American Indian / Alaska Native residents35.2 14.9 40.2 Median age for Asian residents11.4 40.2 -560,606,060.0 Median age for Native Hawaiian / Pacific Islander residents-666,666,666.0 -559,017,940.9 23.8 Median age for Other race residents24.9 26.2 30.4 Median age for Two or more races residents25.1 36.4 45.8 Median age for White alone residents40.3 48.9 26.8 Median age for Hispanic or Latino residents27.4 26.9
Owner/renter occupied households by race in Monroe
House owners and renters - White residents 4,514 66.8% Owner occupied2,240 33.2% Renter occupiedHouse owners and renters - Black or African American residents 1,272 44.9% Owner occupied1,564 55.1% Renter occupiedHouse owners and renters - American Indian / Alaska Native residents 51 54.0% Owner occupied43 46.0% Renter occupiedHouse owners and renters - Asian residents 58 100.0% Owner occupiedHouse owners and renters - Other race residents 829 46.9% Owner occupied940 53.1% Renter occupiedHouse owners and renters - Two or more races residents 517 48.7% Owner occupied544 51.3% Renter occupiedHouse owners and renters - White alone residents 4,300 70.7% Owner occupied1,784 29.3% Renter occupiedHouse owners and renters - Hispanic or Latino residents 1,035 42.3% Owner occupied1,411 57.7% Renter occupied
Language usage in Monroe
English speakers - Total 69.9% of residents of Monroe speak English at home.
28.8% of residents speak Spanish at home 4,656 47.4% Speak English very well5,172 52.6% Speak English less than very well2.3% of residents speak other language at home 384 48.1% Speak English very well415 51.9% Speak English less than very well
English speakers - Born in the United States 89.3% of residents of Monroe speak English at home.
10.9% of residents speak Spanish at home 947 70.1% Speak English very well403 29.9% Speak English less than very well0.1% of residents speak other language at home 9 100.0% Speak English very well
English speakers - Native, born elsewhere 46.5% of residents of Monroe speak English at home.
37.2% of residents speak Spanish at home 14 14.0% Speak English very well86 86.0% Speak English less than very well21.6% of residents speak other language at home 23 39.7% Speak English very well35 60.3% Speak English less than very well
English speakers - Foreign-born 8.0% of residents of Monroe speak English at home.
79.5% of residents speak Spanish at home 1,147 20.5% Speak English very well4,453 79.5% Speak English less than very well8.2% of residents speak other language at home 283 49.2% Speak English very well292 50.8% Speak English less than very well
White (Caucasian) - Speak only English Native:
90.6% (14,236)Foreign-born:
3.3% (56)
White (Caucasian) - Speak another language Native:
6.6% (1,029)Foreign-born:
88.6% (1,491)
Black or African American - Speak only English Native:
98.1% (7,238)Foreign-born:
76.1% (172)
Black or African American - Speak another language Native:
1.9% (137)Foreign-born:
24.6% (56)
American Indian / Alaska Native - Speak only English Native:
36.1% (77)Foreign-born:
18.1% (23)
American Indian / Alaska Native - Speak another language Native:
81.1% (174)Foreign-born:
70.2% (91)
Asian - Speak another language Native:
100.0% (9)Foreign-born:
37.2% (86)
Other race - Speak only English Native:
20.8% (685)Foreign-born:
3.0% (111)
Other race - Speak another language Native:
76.0% (2,500)Foreign-born:
97.3% (3,562)
Two or more races - Speak only English Native:
65.4% (1,514)Foreign-born:
1.0% (13)
Two or more races - Speak another language Native:
38.8% (899)Foreign-born:
100.0% (1,347)
White alone - Speak only English Native:
98.2% (14,194)Foreign-born:
11.6% (61)
White alone - Speak another language Native:
1.7% (239)Foreign-born:
91.7% (481)
Hispanic or Latino - Speak only English Native:
15.9% (678)Foreign-born:
1.7% (98)
Hispanic or Latino - Speak another language Native:
81.7% (3,485)Foreign-born:
97.3% (5,456)
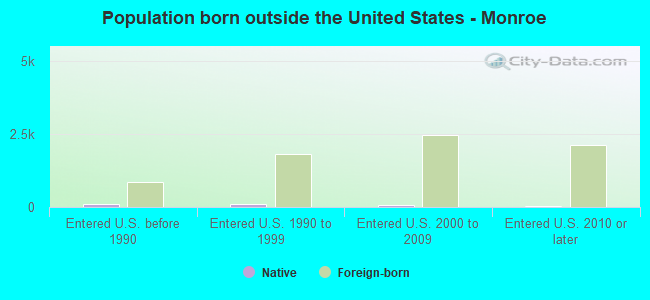
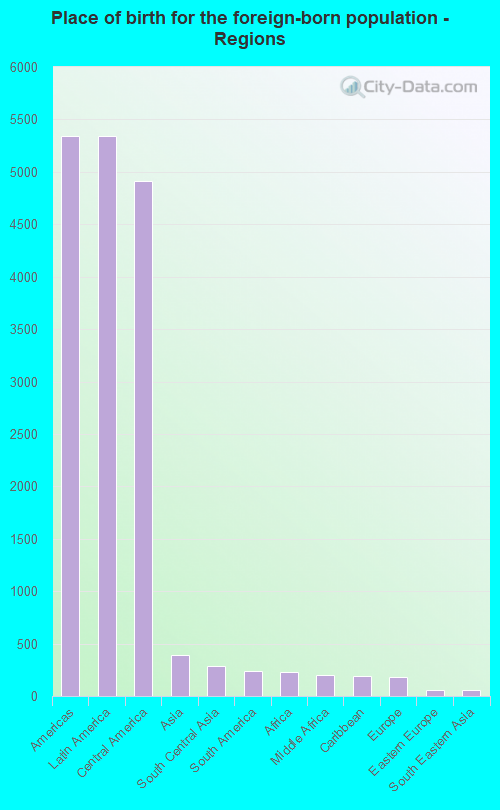
Foreign-born residents in Monroe 6,137 residents are foreign born (14.5% Latin America ).
This city:
17.0%North Carolina:
8.3%
Marital status for residents in Monroe Marital status - White (Caucasian) population 15 years and over
Males 34.9% Never married50.9% Now married3.1% Separated2.0% Widowed9.0% DivorcedFemales 26.7% Never married49.1% Now married3.1% Separated13.1% Widowed8.0% DivorcedWomen who gave birth in the past 12 months Now married:
82.4% (220)Unmarried:
17.6% (47)
Women who did not give birth in the past 12 months Now married:
49.4% (1,928)Unmarried:
50.6% (1,978)
Marital status - Black or African American population 15 years and over
Males 47.3% Never married31.4% Now married9.0% Separated1.6% Widowed10.8% DivorcedFemales 42.4% Never married23.5% Now married8.4% Separated8.1% Widowed17.4% DivorcedWomen who gave birth in the past 12 months Now married:
72.9% (91)Unmarried:
27.1% (34)
Women who did not give birth in the past 12 months Now married:
25.4% (486)Unmarried:
74.6% (1,424)
Marital status - American Indian / Alaska Native population 15 years and over
Males 24.3% Never married47.6% Now married0.0% Separated0.0% Widowed28.2% DivorcedFemales 35.7% Never married64.3% Now married0.0% Separated0.0% Widowed0.0% DivorcedWomen who gave birth in the past 12 months Now married:
100.0% (13)Unmarried:
0.0% (0)
Women who did not give birth in the past 12 months Now married:
52.9% (48)Unmarried:
47.1% (42)
Marital status - Asian population 15 years and over
Males 12.5% Never married87.5% Now married0.0% Separated0.0% Widowed0.0% DivorcedFemales 30.0% Never married42.5% Now married0.0% Separated0.0% Widowed27.5% DivorcedWomen who did not give birth in the past 12 months Now married:
35.4% (37)Unmarried:
64.6% (67)
Marital status - Other race population 15 years and over
Males 39.5% Never married50.1% Now married0.6% Separated1.2% Widowed8.6% DivorcedFemales 29.9% Never married57.5% Now married1.9% Separated6.5% Widowed4.2% DivorcedWomen who gave birth in the past 12 months Now married:
36.0% (37)Unmarried:
64.0% (66)
Women who did not give birth in the past 12 months Now married:
58.5% (949)Unmarried:
41.5% (673)
Marital status - Two or more races population 15 years and over
Males 35.9% Never married59.9% Now married0.0% Separated0.2% Widowed4.0% DivorcedFemales 35.8% Never married48.5% Now married3.6% Separated2.6% Widowed9.5% DivorcedWomen who gave birth in the past 12 months Now married:
100.0% (44)Unmarried:
0.0% (0)
Women who did not give birth in the past 12 months Now married:
47.4% (379)Unmarried:
52.6% (421)
Marital status - White alone, not Hispanic / Latino population 15 years and over
Males 34.2% Never married51.1% Now married1.4% Separated2.4% Widowed10.8% DivorcedFemales 26.4% Never married47.6% Now married2.8% Separated14.0% Widowed9.2% DivorcedWomen who gave birth in the past 12 months Now married:
81.9% (229)Unmarried:
18.1% (51)
Women who did not give birth in the past 12 months Now married:
44.9% (1,442)Unmarried:
55.1% (1,772)
Marital status - Hispanic or Latino population 15 years and over
Males 35.9% Never married55.0% Now married4.4% Separated0.5% Widowed4.1% DivorcedFemales 30.7% Never married55.5% Now married3.6% Separated6.1% Widowed4.0% DivorcedWomen who gave birth in the past 12 months Now married:
61.9% (86)Unmarried:
38.1% (53)
Women who did not give birth in the past 12 months Now married:
58.8% (1,632)Unmarried:
41.2% (1,142)
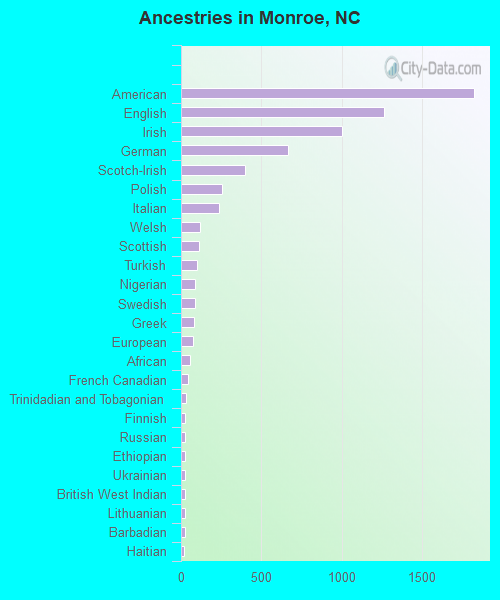
Ancestries in Monroe
1,827 9.9% American1,263 6.8% English1,000 5.4% Irish665 3.6% German399 2.2% Scotch-Irish255 1.4% Polish237 1.3% Italian121 0.7% Welsh111 0.6% Scottish100 0.5% Turkish90 0.5% Nigerian89 0.5% Swedish78 0.4% Greek73 0.4% European58 0.3% African44 0.2% French Canadian29 0.2% Trinidadian and Tobagonian28 0.2% Finnish28 0.2% Russian28 0.2% Ethiopian25 0.1% Ukrainian25 0.1% British West Indian24 0.1% Lithuanian23 0.1% Barbadian17 0.09% Haitian15 0.08% Czech15 0.08% Norwegian12 0.06% British11 0.06% Hungarian11 0.06% Pennsylvania German6 0.03% Jamaican4 0.02% Kenyan
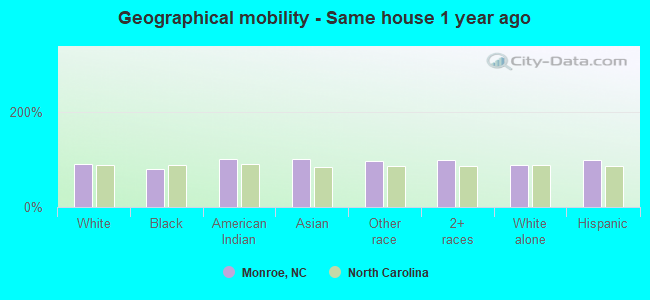
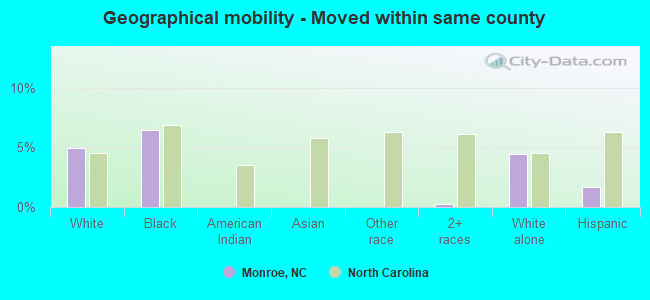
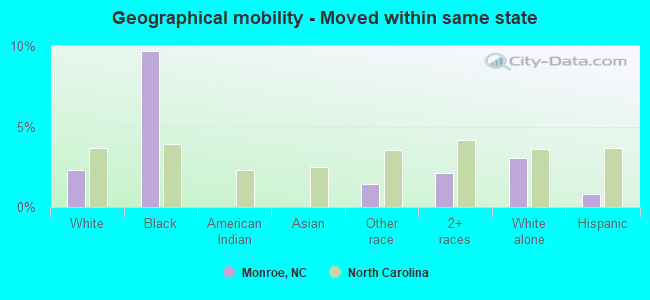
Geographical mobility in Monroe Same house 1 year ago 16,467 89.5% White (Caucasian)5,812 78.5% Black or African American394 100.0% American Indian / Alaska Native233 100.0% Asian7,115 95.9% Other race3,867 98.4% Two or more races13,675 88.7% White alone, not Hispanic / Latino10,367 98.5% Hispanic or LatinoMoved within same county 913 5.0% White / Caucasian480 6.5% Black or African American10 0.2% Two or more races686 4.4% White alone, not Hispanic / Latino180 1.7% Hispanic or LatinoMoved within same state 426 2.3% White / Caucasian717 9.7% Black or African American104 1.4% Other race82 2.1% Two or more races469 3.0% White alone, not Hispanic / Latino84 0.8% Hispanic or LatinoMoved from different state 555 3.0% White / Caucasian9 0.1% Black or African American140 1.9% Other race36 0.9% Two or more races565 3.7% White alone, not Hispanic / Latino81 0.8% Hispanic or LatinoMoved from abroad 37 0.5% Black or African American35 0.5% Other race15 0.4% Two or more races38 0.4% Hispanic or Latino
Children Nativity (place of birth) in Monroe
Children under 6 years - Living with two parents Both parents native 955 100.0% Native0 0.0% Foreign-bornBoth parents foreign-born 646 92.1% Native55 7.9% Foreign-bornOne native, one foreign-born parent 160 100.0% NativeChildren under 6 years - Living with one parent Native parent 416 77.6% Native120 22.4% Foreign-bornForeign-born parent 103 64.4% Native57 35.6% Foreign-bornChildren 6 to 17 years - Living with two parents Both parents native 1,714 100.0% NativeBoth parents foreign-born 1,750 92.8% Native136 7.2% Foreign-bornOne native, one foreign-born parent 161 100.0% NativeChildren 6 to 17 years - Living with one parent Native parent 1,084 100.0% NativeForeign-born parent 731 50.2% Native724 49.8% Foreign-born
Grandparents responsible for own grandchildren in Monroe
Grandparents (30 to 59 years) White / Caucasian 91 38.3% Responsible for grandchildren146 61.7% Not responsible for grandchildrenBlack or African American 72 67.9% Responsible for grandchildren34 32.1% Not responsible for grandchildrenOther race 24 100.0% Not responsible for grandchildrenTwo or more races 21 100.0% Responsible for grandchildrenWhite alone, not Hispanic / Latino 96 45.0% Responsible for grandchildren118 55.0% Not responsible for grandchildrenHispanic or Latino 57 100.0% Not responsible for grandchildren
Grandparents (60 years and over) White / Caucasian 3 1.2% Responsible for grandchildren272 98.8% Not responsible for grandchildrenBlack or African American 7 100.0% Not responsible for grandchildrenOther race 22 100.0% Not responsible for grandchildrenTwo or more races 33 100.0% Responsible for grandchildrenWhite alone, not Hispanic / Latino 3 2.5% Responsible for grandchildren126 97.5% Not responsible for grandchildrenHispanic or Latino 32 100.0% Not responsible for grandchildren