Races in Moorestown-Lenola, New Jersey (NJ) Detailed Stats
Data:
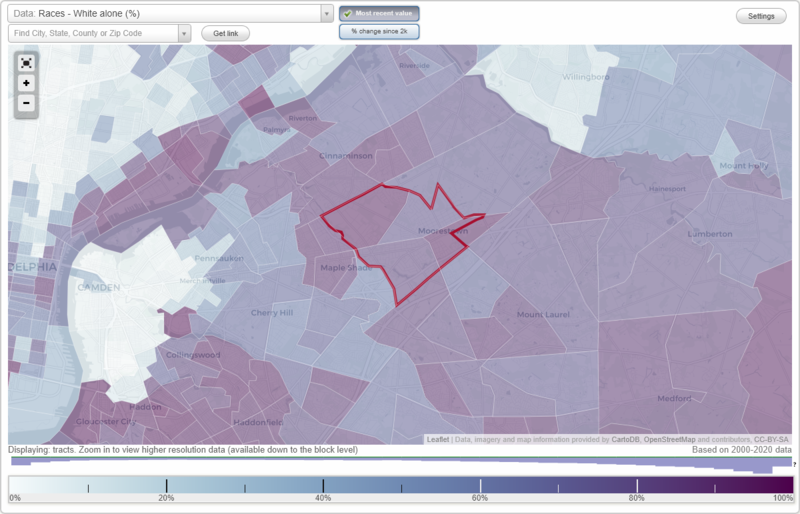
Races - White alone (%)
Races - White alone (% change since 2000)
Races - Black alone (%)
Races - Black alone (% change since 2000)
Races - American Indian alone (%)
Races - American Indian alone (% change since 2000)
Races - Asian alone (%)
Races - Asian alone (% change since 2000)
Races - Hispanic (%)
Races - Hispanic (% change since 2000)
Races - Native Hawaiian and Other Pacific Islander alone (%)
Races - Native Hawaiian and Other Pacific Islander alone (% change since 2000)
Races - Two or more races(%)
Races - Two or more races(% change since 2000)
Races - Other race alone (%)
Races - Other race alone (% change since 2000)
Racial diversity
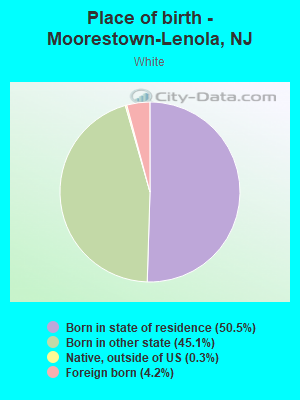
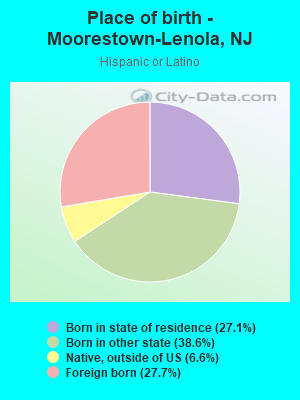
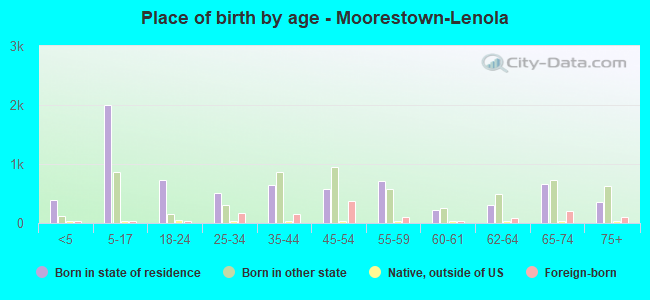
Place of birth - Born in state of residence (%)
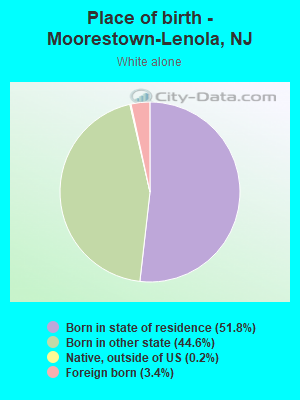
Place of birth - Born in state of residence (%) - White
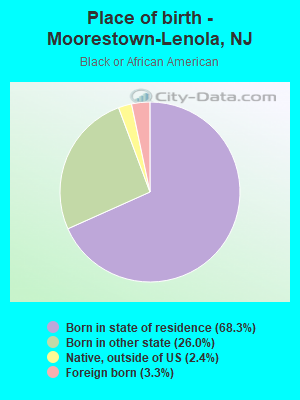
Place of birth - Born in state of residence (%) - Black or African American
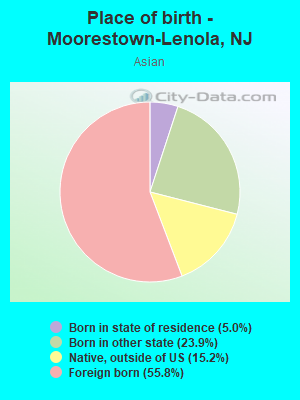
Place of birth - Born in state of residence (%) - Asian
Place of birth - Born in state of residence (%) - Hispanic or Latino
Place of birth - Born in state of residence (%) - American Indian and Alaska Native
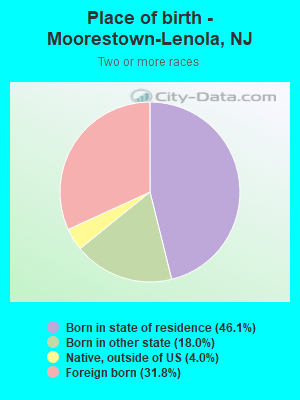
Place of birth - Born in state of residence (%) - Multirace
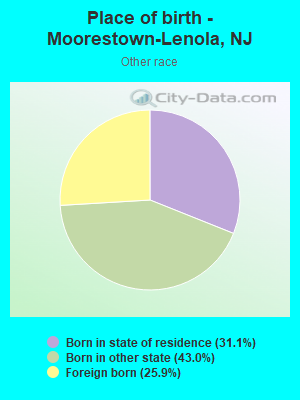
Place of birth - Born in state of residence (%) - Other Race
Place of birth - Born in other state (%)
Place of birth - Born in other state (%) - White
Place of birth - Born in other state (%) - Black or African American
Place of birth - Born in other state (%) - Asian
Place of birth - Born in other state (%) - Hispanic or Latino
Place of birth - Born in other state (%) - American Indian and Alaska Native
Place of birth - Born in other state (%) - Multirace
Place of birth - Born in other state (%) - Other Race
Place of birth - Native, outside of US (%)
Place of birth - Native, outside of US (%) - White
Place of birth - Native, outside of US (%) - Black or African American
Place of birth - Native, outside of US (%) - Asian
Place of birth - Native, outside of US (%) - Hispanic or Latino
Place of birth - Native, outside of US (%) - American Indian and Alaska Native
Place of birth - Native, outside of US (%) - Multirace
Place of birth - Native, outside of US (%) - Other Race
Place of birth - Foreign born (%)
Place of birth - Foreign born (%) - White
Place of birth - Foreign born (%) - Black or African American
Place of birth - Foreign born (%) - Asian
Place of birth - Foreign born (%) - Hispanic or Latino
Place of birth - Foreign born (%) - American Indian and Alaska Native
Place of birth - Foreign born (%) - Multirace
Place of birth - Foreign born (%) - Other Race
Residents speaking English at home (%)
Residents speaking English at home - Born in the United States (%)
Residents speaking English at home - Native, born elsewhere (%)
Residents speaking English at home - Foreign born (%)
Residents speaking Spanish at home (%)
Residents speaking Spanish at home - Born in the United States (%)
Residents speaking Spanish at home - Native, born elsewhere (%)
Residents speaking Spanish at home - Foreign born (%)
Residents speaking other language at home (%)
Residents speaking other language at home - Born in the United States (%)
Residents speaking other language at home - Native, born elsewhere (%)
Residents speaking other language at home - Foreign born (%)
Marital status - Never married (%)
Marital status - Now married (%)
Marital status - Separated (%)
Marital status - Widowed (%)
Marital status - Divorced (%)
Ancestries Reported - Arab (%)
Ancestries Reported - Czech (%)
Ancestries Reported - Danish (%)
Ancestries Reported - Dutch (%)
Ancestries Reported - English (%)
Ancestries Reported - French (%)
Ancestries Reported - French Canadian (%)
Ancestries Reported - German (%)
Ancestries Reported - Greek (%)
Ancestries Reported - Hungarian (%)
Ancestries Reported - Irish (%)
Ancestries Reported - Italian (%)
Ancestries Reported - Lithuanian (%)
Ancestries Reported - Norwegian (%)
Ancestries Reported - Polish (%)
Ancestries Reported - Portuguese (%)
Ancestries Reported - Russian (%)
Ancestries Reported - Scotch-Irish (%)
Ancestries Reported - Scottish (%)
Ancestries Reported - Slovak (%)
Ancestries Reported - Subsaharan African (%)
Ancestries Reported - Swedish (%)
Ancestries Reported - Swiss (%)
Ancestries Reported - Ukrainian (%)
Ancestries Reported - United States (%)
Ancestries Reported - Welsh (%)
Ancestries Reported - West Indian (%)
Ancestries Reported - Other (%)
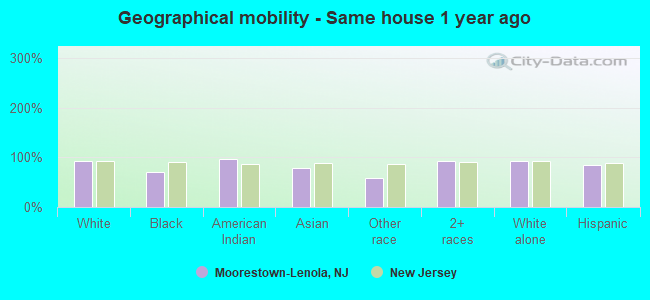
Geographical mobility - Same house 1 year ago (%)
Geographical mobility - Same house 1 year ago (%) - White
Geographical mobility - Same house 1 year ago (%) - Black or African American
Geographical mobility - Same house 1 year ago (%) - Asian
Geographical mobility - Same house 1 year ago (%) - Hispanic or Latino
Geographical mobility - Same house 1 year ago (%) - American Indian and Alaska Native
Geographical mobility - Same house 1 year ago (%) - Multirace
Geographical mobility - Same house 1 year ago (%) - Other Race
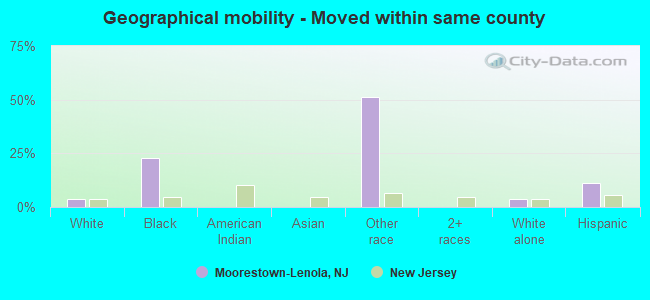
Geographical mobility - Moved within same county (%)
Geographical mobility - Moved within same county (%) - White
Geographical mobility - Moved within same county (%) - Black or African American
Geographical mobility - Moved within same county (%) - Asian
Geographical mobility - Moved within same county (%) - Hispanic or Latino
Geographical mobility - Moved within same county (%) - American Indian and Alaska Native
Geographical mobility - Moved within same county (%) - Multirace
Geographical mobility - Moved within same county (%) - Other Race
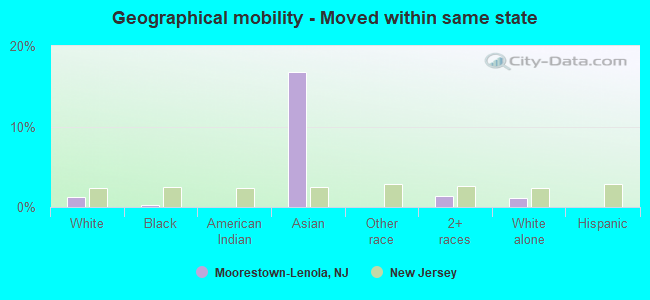
Geographical mobility - Moved from different county within same state (%)
Geographical mobility - Moved from different county within same state (%) - White
Geographical mobility - Moved from different county within same state (%) - Black or African American
Geographical mobility - Moved from different county within same state (%) - Asian
Geographical mobility - Moved from different county within same state (%) - Hispanic or Latino
Geographical mobility - Moved from different county within same state (%) - American Indian and Alaska Native
Geographical mobility - Moved from different county within same state (%) - Multirace
Geographical mobility - Moved from different county within same state (%) - Other Race
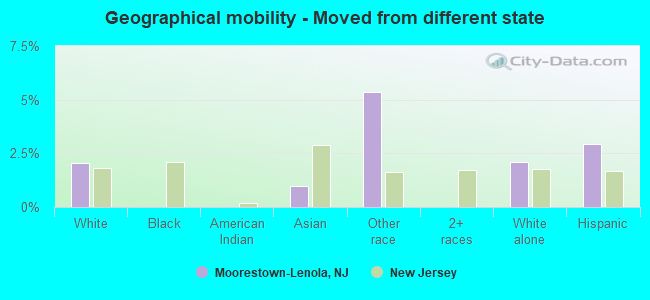
Geographical mobility - Moved from different state (%)
Geographical mobility - Moved from different state (%) - White
Geographical mobility - Moved from different state (%) - Black or African American
Geographical mobility - Moved from different state (%) - Asian
Geographical mobility - Moved from different state (%) - Hispanic or Latino
Geographical mobility - Moved from different state (%) - American Indian and Alaska Native
Geographical mobility - Moved from different state (%) - Multirace
Geographical mobility - Moved from different state (%) - Other Race
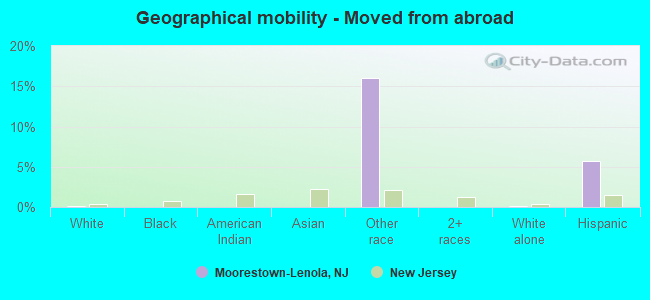
Geographical mobility - Moved from abroad (%)
Geographical mobility - Moved from abroad (%) - White
Geographical mobility - Moved from abroad (%) - Black or African American
Geographical mobility - Moved from abroad (%) - Asian
Geographical mobility - Moved from abroad (%) - Hispanic or Latino
Geographical mobility - Moved from abroad (%) - American Indian and Alaska Native
Geographical mobility - Moved from abroad (%) - Multirace
Geographical mobility - Moved from abroad (%) - Other Race
Place of birth for the foreign-born population - Ireland (%)
Place of birth for the foreign-born population - Denmark (%)
Place of birth for the foreign-born population - Norway (%)
Place of birth for the foreign-born population - Sweden (%)
Place of birth for the foreign-born population - United Kingdom (%)
Place of birth for the foreign-born population - England (%)
Place of birth for the foreign-born population - Scotland (%)
Place of birth for the foreign-born population - Other Northern Europe (%)
Place of birth for the foreign-born population - Austria (%)
Place of birth for the foreign-born population - Belgium (%)
Place of birth for the foreign-born population - France (%)
Place of birth for the foreign-born population - Germany (%)
Place of birth for the foreign-born population - Netherlands (%)
Place of birth for the foreign-born population - Switzerland (%)
Place of birth for the foreign-born population - Other Western Europe (%)
Place of birth for the foreign-born population - Greece (%)
Place of birth for the foreign-born population - Italy (%)
Place of birth for the foreign-born population - Portugal (%)
Place of birth for the foreign-born population - Spain (%)
Place of birth for the foreign-born population - Other Southern Europe (%)
Place of birth for the foreign-born population - Albania (%)
Place of birth for the foreign-born population - Belarus (%)
Place of birth for the foreign-born population - Bosnia and Herzegovina (%)
Place of birth for the foreign-born population - Bulgaria (%)
Place of birth for the foreign-born population - Croatia (%)
Place of birth for the foreign-born population - Czechoslovakia (%)
Place of birth for the foreign-born population - Hungary (%)
Place of birth for the foreign-born population - Latvia (%)
Place of birth for the foreign-born population - Lithuania (%)
Place of birth for the foreign-born population - North Macedonia (Macedonia) (%)
Place of birth for the foreign-born population - Moldova (%)
Place of birth for the foreign-born population - Poland (%)
Place of birth for the foreign-born population - Romania (%)
Place of birth for the foreign-born population - Russia (%)
Place of birth for the foreign-born population - Serbia (%)
Place of birth for the foreign-born population - Ukraine (%)
Place of birth for the foreign-born population - Other Eastern Europe (%)
Place of birth for the foreign-born population - China (%)
Place of birth for the foreign-born population - Hong Kong (%)
Place of birth for the foreign-born population - Taiwan (%)
Place of birth for the foreign-born population - Japan (%)
Place of birth for the foreign-born population - Korea (%)
Place of birth for the foreign-born population - Other Eastern Asia (%)
Place of birth for the foreign-born population - Afghanistan (%)
Place of birth for the foreign-born population - Bangladesh (%)
Place of birth for the foreign-born population - India (%)
Place of birth for the foreign-born population - Iran (%)
Place of birth for the foreign-born population - Kazakhstan (%)
Place of birth for the foreign-born population - Nepal (%)
Place of birth for the foreign-born population - Pakistan (%)
Place of birth for the foreign-born population - Sri Lanka (%)
Place of birth for the foreign-born population - Uzbekistan (%)
Place of birth for the foreign-born population - Other South Central Asia (%)
Place of birth for the foreign-born population - Burma (%)
Place of birth for the foreign-born population - Cambodia (%)
Place of birth for the foreign-born population - Indonesia (%)
Place of birth for the foreign-born population - Laos (%)
Place of birth for the foreign-born population - Malaysia (%)
Place of birth for the foreign-born population - Philippines (%)
Place of birth for the foreign-born population - Singapore (%)
Place of birth for the foreign-born population - Thailand (%)
Place of birth for the foreign-born population - Vietnam (%)
Place of birth for the foreign-born population - Other South Eastern Asia (%)
Place of birth for the foreign-born population - Armenia (%)
Place of birth for the foreign-born population - Iraq (%)
Place of birth for the foreign-born population - Israel (%)
Place of birth for the foreign-born population - Jordan (%)
Place of birth for the foreign-born population - Kuwait (%)
Place of birth for the foreign-born population - Lebanon (%)
Place of birth for the foreign-born population - Saudi Arabia (%)
Place of birth for the foreign-born population - Syria (%)
Place of birth for the foreign-born population - Turkey (%)
Place of birth for the foreign-born population - Yemen (%)
Place of birth for the foreign-born population - Other Western Asia (%)
Place of birth for the foreign-born population - Eritrea (%)
Place of birth for the foreign-born population - Ethiopia (%)
Place of birth for the foreign-born population - Kenya (%)
Place of birth for the foreign-born population - Somalia (%)
Place of birth for the foreign-born population - Uganda (%)
Place of birth for the foreign-born population - Zimbabwe (%)
Place of birth for the foreign-born population - Other Eastern Africa (%)
Place of birth for the foreign-born population - Cameroon (%)
Place of birth for the foreign-born population - Congo (%)
Place of birth for the foreign-born population - Democratic Republic of Congo (Zaire) (%)
Place of birth for the foreign-born population - Other Middle Africa (%)
Place of birth for the foreign-born population - Egypt (%)
Place of birth for the foreign-born population - Morocco (%)
Place of birth for the foreign-born population - Sudan (%)
Place of birth for the foreign-born population - Other Northern Africa (%)
Place of birth for the foreign-born population - South Africa (%)
Place of birth for the foreign-born population - Other Southern Africa (%)
Place of birth for the foreign-born population - Cabo Verde (%)
Place of birth for the foreign-born population - Ghana (%)
Place of birth for the foreign-born population - Liberia (%)
Place of birth for the foreign-born population - Nigeria (%)
Place of birth for the foreign-born population - Senegal (%)
Place of birth for the foreign-born population - Sierra Leone (%)
Place of birth for the foreign-born population - Other Western Africa (%)
Place of birth for the foreign-born population - Australia (%)
Place of birth for the foreign-born population - New Zealand (%)
Place of birth for the foreign-born population - Fiji (%)
Place of birth for the foreign-born population - Micronesia (%)
Place of birth for the foreign-born population - Bahamas (%)
Place of birth for the foreign-born population - Barbados (%)
Place of birth for the foreign-born population - Cuba (%)
Place of birth for the foreign-born population - Dominica (%)
Place of birth for the foreign-born population - Dominican Republic (%)
Place of birth for the foreign-born population - Grenada (%)
Place of birth for the foreign-born population - Haiti (%)
Place of birth for the foreign-born population - Jamaica (%)
Place of birth for the foreign-born population - St. Vincent and the Grenadines (%)
Place of birth for the foreign-born population - Trinidad and Tobago (%)
Place of birth for the foreign-born population - West Indies (%)
Place of birth for the foreign-born population - Other Caribbean (%)
Place of birth for the foreign-born population - Belize (%)
Place of birth for the foreign-born population - Costa Rica (%)
Place of birth for the foreign-born population - El Salvador (%)
Place of birth for the foreign-born population - Guatemala (%)
Place of birth for the foreign-born population - Honduras (%)
Place of birth for the foreign-born population - Mexico (%)
Place of birth for the foreign-born population - Nicaragua (%)
Place of birth for the foreign-born population - Panama (%)
Place of birth for the foreign-born population - Other Central America (%)
Place of birth for the foreign-born population - Argentina (%)
Place of birth for the foreign-born population - Bolivia (%)
Place of birth for the foreign-born population - Brazil (%)
Place of birth for the foreign-born population - Chile (%)
Place of birth for the foreign-born population - Colombia (%)
Place of birth for the foreign-born population - Ecuador (%)
Place of birth for the foreign-born population - Guyana (%)
Place of birth for the foreign-born population - Peru (%)
Place of birth for the foreign-born population - Uruguay (%)
Place of birth for the foreign-born population - Venezuela (%)
Place of birth for the foreign-born population - Other South America (%)
Place of birth for the foreign-born population - Canada (%)
Place of birth for the foreign-born population - Other Northern America (%)
Place of birth for the foreign-born population - Other (%)
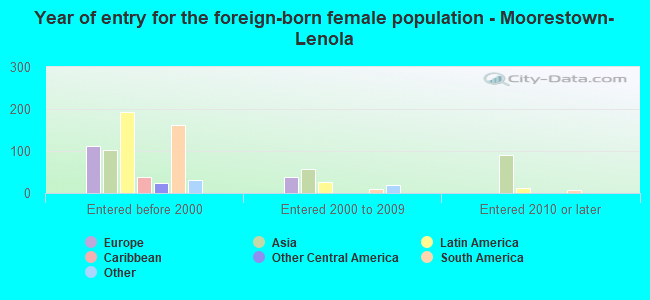
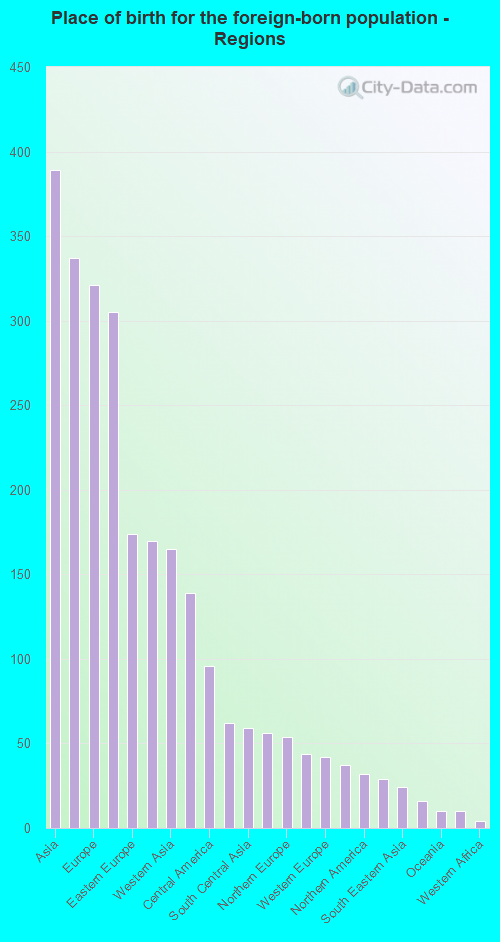
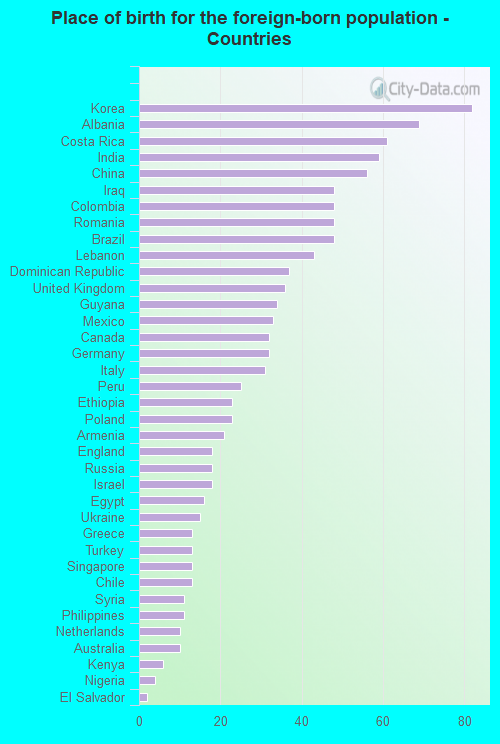
According to 2022 data, the most numerous races in Moorestown-Lenola, NJ are White alone (11,391 residents), Hispanic (1,064 residents), and Black alone (631 residents). 90.0% of Moorestown-Lenola residents speak English at home. 7.7% of Moorestown-Lenola, NJ residents are foreign-born (2.7% born in Asia, 2.2% born in Europe, 2.1% born in Latin America), which is 198.0% less than the foreign-born rate of 23.0% across the entire state of New Jersey.
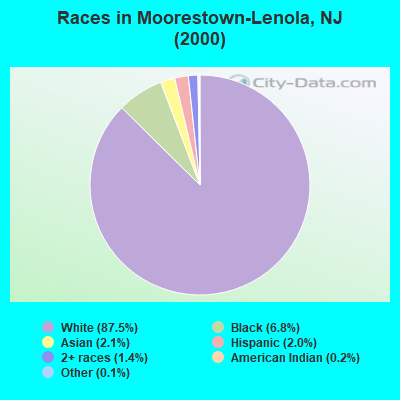
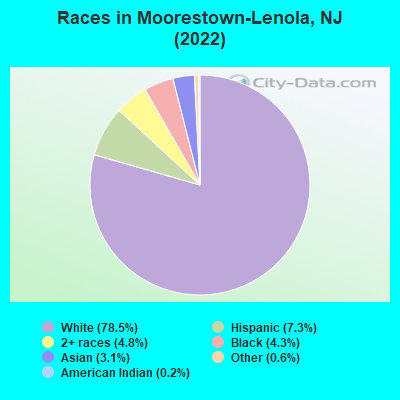
Race distribution in Moorestown-Lenola
2000 2022
5,557,209 66.0% White alone 1,117,191 13.3% Hispanic 1,096,171 13.0% Black alone 477,012 5.7% Asian alone 133,689 1.6% Two or more races 19,565 0.2% Other race alone 11,338 0.1% American Indian alone 2,175 0.03% Native Hawaiian and Other
4,766,476 51.5% White alone 2,028,470 21.9% Hispanic 1,111,632 12.0% Black alone 923,546 10.0% Asian alone 332,237 3.6% Two or more races 89,847 1.0% Other race alone 8,557 0.09% American Indian alone 934 0.01% Native Hawaiian and Other
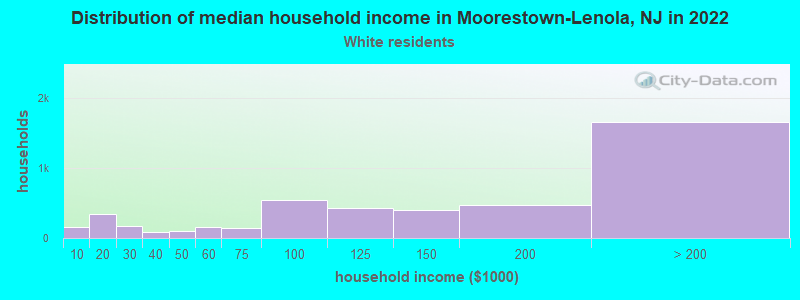
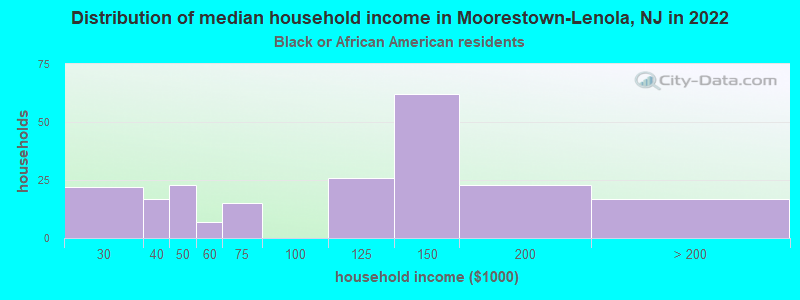
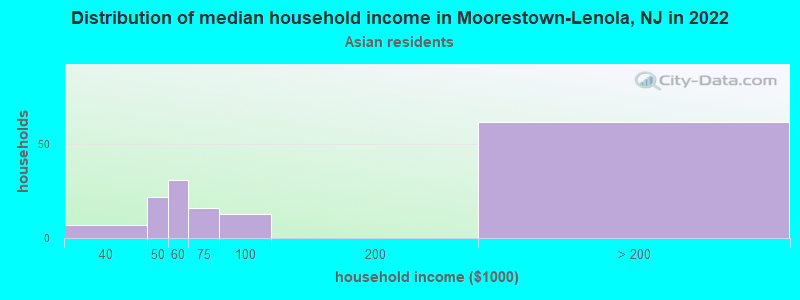
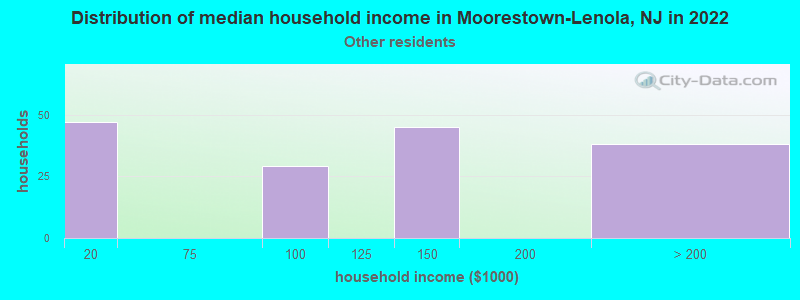
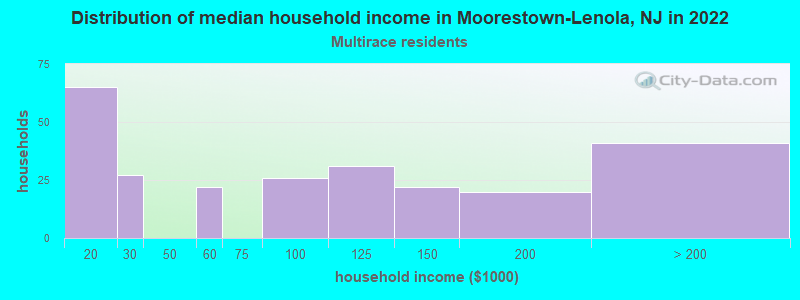
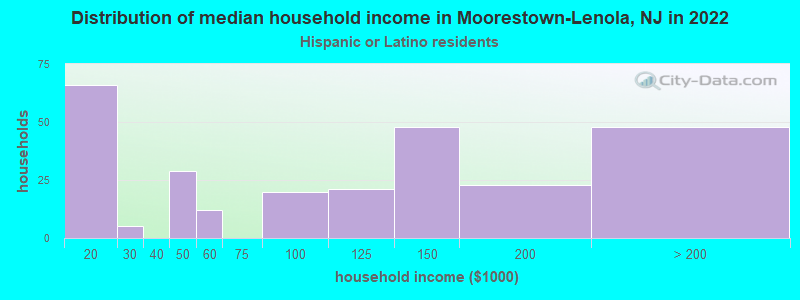
Income and house value in Moorestown-Lenola Median household income in 2022 $135,076 White non-Hispanic householders$129,005 Black householders$193,691 Some other race householders$84,776 Two or more races householders$111,661 Hispanic or Latino race householdersMedian 2022 house value $559,526 White Non-Hispanic householders$383,822 Black or African American householders$510,765 American Indian or Alaska Native householders $393,084 Asian householders$406,160 Some other race householders$334,789 Two or more races householders$388,453 Hispanic or Latino householders
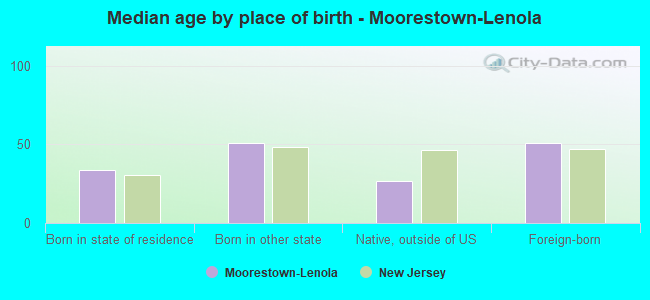
Median age by race in Moorestown-Lenola
47.4 Median age for White residents47.1 47.7 47.3 Median age for Black or African American residents41.4 50.5 28.3 Median age for American Indian / Alaska Native residents-670,465,336.5 -688,298,917.7 41.4 Median age for Asian residents25.9 47.0 -866,479,924.4 Median age for Native Hawaiian / Pacific Islander residents-866,479,924.4 -713,070,378.3 26.4 Median age for Other race residents27.4 26.7 29.5 Median age for Two or more races residents28.7 33.8 47.2 Median age for White alone residents47.2 47.9 28.8 Median age for Hispanic or Latino residents26.7 28.2
Owner/renter occupied households by race in Moorestown-Lenola
House owners and renters - White residents 4,046 86.5% Owner occupied631 13.5% Renter occupiedHouse owners and renters - Black or African American residents 134 75.3% Owner occupied44 24.7% Renter occupiedHouse owners and renters - American Indian / Alaska Native residents 32 100.0% Renter occupiedHouse owners and renters - Asian residents 142 92.5% Owner occupied11 7.5% Renter occupiedHouse owners and renters - Other race residents 43 39.8% Owner occupied65 60.2% Renter occupiedHouse owners and renters - Two or more races residents 208 77.6% Owner occupied60 22.4% Renter occupiedHouse owners and renters - White alone residents 4,002 87.1% Owner occupied590 12.9% Renter occupiedHouse owners and renters - Hispanic or Latino residents 132 50.2% Owner occupied131 49.8% Renter occupied
Language usage in Moorestown-Lenola
English speakers - Total 90.0% of residents of Moorestown-Lenola speak English at home.
3.9% of residents speak Spanish at home 329 60.6% Speak English very well214 39.4% Speak English less than very well6.0% of residents speak other language at home 613 73.4% Speak English very well222 26.6% Speak English less than very well
English speakers - Born in the United States 95.8% of residents of Moorestown-Lenola speak English at home.
3.2% of residents speak Spanish at home 188 100.0% Speak English very well1.1% of residents speak other language at home 57 86.4% Speak English very well9 13.6% Speak English less than very well
English speakers - Native, born elsewhere 97.3% of residents of Moorestown-Lenola speak English at home.
9.4% of residents speak Spanish at home 14 100.0% Speak English very well
English speakers - Foreign-born 27.6% of residents of Moorestown-Lenola speak English at home.
20.8% of residents speak Spanish at home 99 37.9% Speak English very well162 62.1% Speak English less than very well51.6% of residents speak other language at home 466 71.9% Speak English very well182 28.1% Speak English less than very well
White (Caucasian) - Speak only English Native:
98.7% (10,691)Foreign-born:
25.2% (122)
White (Caucasian) - Speak another language Native:
1.7% (179)Foreign-born:
74.9% (363)
Black or African American - Speak another language Native:
0.1% (1)Foreign-born:
100.0% (20)
Asian - Speak only English Native:
94.6% (191)Foreign-born:
27.7% (67)
Asian - Speak another language Native:
16.1% (32)Foreign-born:
74.5% (181)
Other race - Speak only English Native:
55.3% (156)Foreign-born:
21.3% (28)
Other race - Speak another language Native:
44.9% (126)Foreign-born:
78.8% (103)
Two or more races - Speak only English Native:
76.4% (537)Foreign-born:
34.4% (126)
Two or more races - Speak another language Native:
23.8% (167)Foreign-born:
65.4% (239)
White alone - Speak only English Native:
98.7% (10,557)Foreign-born:
29.9% (115)
White alone - Speak another language Native:
1.4% (145)Foreign-born:
70.2% (270)
Hispanic or Latino - Speak only English Native:
64.7% (448)Foreign-born:
22.5% (67)
Hispanic or Latino - Speak another language Native:
35.5% (246)Foreign-born:
77.8% (231)
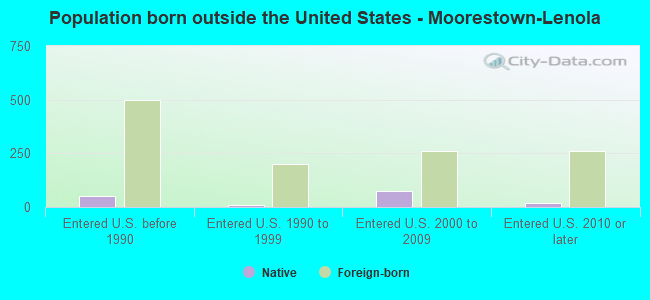
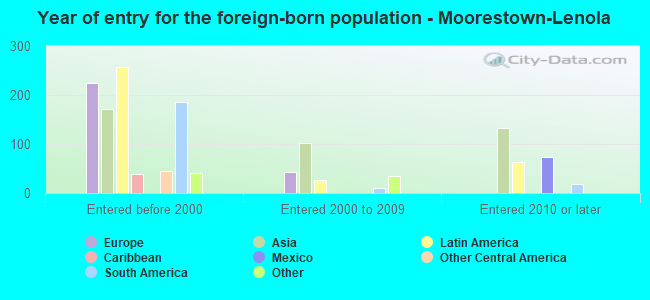
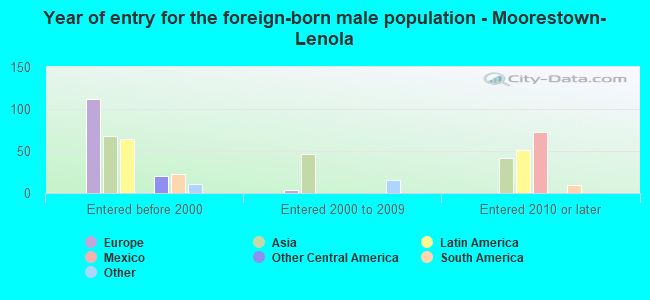
Foreign-born residents in Moorestown-Lenola 1,120 residents are foreign born (2.7% Asia , 2.2% Europe , 2.1% Latin America ).
This city:
7.7%New Jersey:
23.2%
Marital status for residents in Moorestown-Lenola Marital status - White (Caucasian) population 15 years and over
Males 21.9% Never married66.7% Now married0.0% Separated3.1% Widowed8.2% DivorcedFemales 23.1% Never married58.2% Now married0.4% Separated9.3% Widowed9.0% DivorcedWomen who gave birth in the past 12 months Now married:
100.0% (44)Unmarried:
0.0% (0)
Women who did not give birth in the past 12 months Now married:
49.4% (1,101)Unmarried:
50.6% (1,126)
Marital status - Black or African American population 15 years and over
Males 22.1% Never married62.1% Now married0.0% Separated0.0% Widowed15.8% DivorcedFemales 28.6% Never married36.1% Now married0.0% Separated18.4% Widowed16.9% DivorcedWomen who gave birth in the past 12 months Now married:
0.0% (0)Unmarried:
100.0% (4)
Women who did not give birth in the past 12 months Now married:
52.1% (62)Unmarried:
47.9% (57)
Marital status - American Indian / Alaska Native population 15 years and over
Males 0.0% Never married100.0% Now married0.0% Separated0.0% Widowed0.0% DivorcedFemales 100.0% Never married0.0% Now married0.0% Separated0.0% Widowed0.0% DivorcedWomen who gave birth in the past 12 months Now married:
0.0% (0)Unmarried:
100.0% (9)
Marital status - Asian population 15 years and over
Males 37.2% Never married62.8% Now married0.0% Separated0.0% Widowed0.0% DivorcedFemales 5.5% Never married76.2% Now married0.0% Separated13.4% Widowed4.9% DivorcedWomen who gave birth in the past 12 months Now married:
100.0% (1)Unmarried:
0.0% (0)
Women who did not give birth in the past 12 months Now married:
88.8% (76)Unmarried:
11.2% (10)
Marital status - Other race population 15 years and over
Males 87.2% Never married12.8% Now married0.0% Separated0.0% Widowed0.0% DivorcedFemales 46.5% Never married5.1% Now married5.6% Separated0.0% Widowed42.8% DivorcedWomen who gave birth in the past 12 months Now married:
100.0% (14)Unmarried:
0.0% (0)
Women who did not give birth in the past 12 months Now married:
8.5% (15)Unmarried:
91.5% (164)
Marital status - Two or more races population 15 years and over
Males 40.8% Never married42.9% Now married0.0% Separated3.3% Widowed13.1% DivorcedFemales 12.1% Never married56.4% Now married0.0% Separated22.7% Widowed8.7% DivorcedWomen who did not give birth in the past 12 months Now married:
44.0% (44)Unmarried:
56.0% (55)
Marital status - White alone, not Hispanic / Latino population 15 years and over
Males 21.8% Never married66.8% Now married0.0% Separated3.2% Widowed8.3% DivorcedFemales 22.1% Never married58.9% Now married0.1% Separated9.5% Widowed9.4% DivorcedWomen who gave birth in the past 12 months Now married:
100.0% (44)Unmarried:
0.0% (0)
Women who did not give birth in the past 12 months Now married:
50.4% (1,063)Unmarried:
49.6% (1,046)
Marital status - Hispanic or Latino population 15 years and over
Males 56.4% Never married38.0% Now married0.0% Separated3.4% Widowed2.1% DivorcedFemales 40.7% Never married30.8% Now married3.1% Separated9.0% Widowed16.4% DivorcedWomen who gave birth in the past 12 months Now married:
100.0% (12)Unmarried:
0.0% (0)
Women who did not give birth in the past 12 months Now married:
21.1% (71)Unmarried:
78.9% (268)
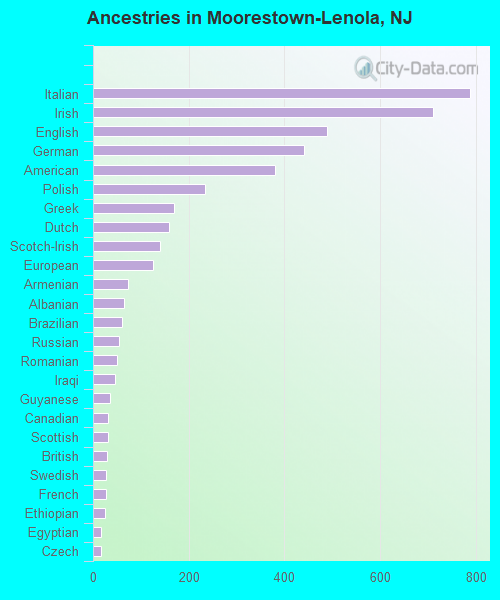
Ancestries in Moorestown-Lenola
788 14.1% Italian711 12.7% Irish488 8.7% English440 7.9% German380 6.8% American234 4.2% Polish170 3.0% Greek159 2.8% Dutch141 2.5% Scotch-Irish126 2.3% European73 1.3% Armenian65 1.2% Albanian61 1.1% Brazilian55 1.0% Russian51 0.9% Romanian46 0.8% Iraqi36 0.6% Guyanese31 0.6% Canadian31 0.6% Scottish30 0.5% British28 0.5% Swedish27 0.5% French26 0.5% Ethiopian16 0.3% Egyptian16 0.3% Czech16 0.3% Ukrainian14 0.3% Turkish13 0.2% Lebanese13 0.2% Hungarian12 0.2% Eastern European11 0.2% Syrian10 0.2% French Canadian10 0.2% Lithuanian9 0.2% Carpatho Rusyn8 0.1% Liberian7 0.1% Portuguese6 0.1% Welsh3 0.05% Estonian3 0.05% Nigerian
Children Nativity (place of birth) in Moorestown-Lenola
Children under 6 years - Living with two parents Both parents native 533 100.0% NativeBoth parents foreign-born 2 26.8% Native6 73.2% Foreign-bornOne native, one foreign-born parent 36 100.0% NativeChildren under 6 years - Living with one parent Native parent 115 100.0% NativeForeign-born parent 18 100.0% NativeChildren 6 to 17 years - Living with two parents Both parents native 1,448 99.9% Native1 0.1% Foreign-bornBoth parents foreign-born 107 84.3% Native20 15.7% Foreign-bornOne native, one foreign-born parent 281 100.0% NativeChildren 6 to 17 years - Living with one parent Native parent 505 100.0% NativeForeign-born parent 47 52.6% Native43 47.4% Foreign-born
Grandparents responsible for own grandchildren in Moorestown-Lenola
Grandparents (30 to 59 years) White / Caucasian 35 85.3% Responsible for grandchildren6 14.7% Not responsible for grandchildrenWhite alone, not Hispanic / Latino 42 86.1% Responsible for grandchildren7 13.9% Not responsible for grandchildrenGrandparents (60 years and over) White / Caucasian 38 41.6% Responsible for grandchildren54 58.4% Not responsible for grandchildrenWhite alone, not Hispanic / Latino 40 45.0% Responsible for grandchildren48 55.0% Not responsible for grandchildren