Races in Morrow, Georgia (GA) Detailed Stats
Data:
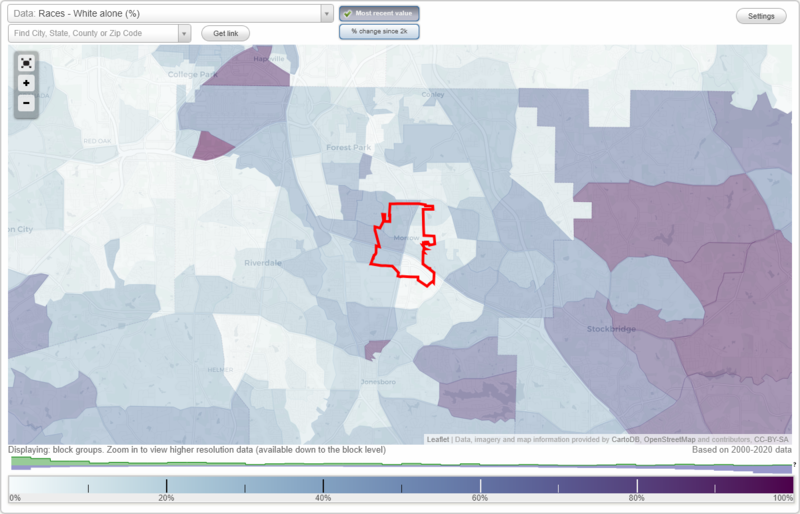
Races - White alone (%)
Races - White alone (% change since 2000)
Races - Black alone (%)
Races - Black alone (% change since 2000)
Races - American Indian alone (%)
Races - American Indian alone (% change since 2000)
Races - Asian alone (%)
Races - Asian alone (% change since 2000)
Races - Hispanic (%)
Races - Hispanic (% change since 2000)
Races - Native Hawaiian and Other Pacific Islander alone (%)
Races - Native Hawaiian and Other Pacific Islander alone (% change since 2000)
Races - Two or more races(%)
Races - Two or more races(% change since 2000)
Races - Other race alone (%)
Races - Other race alone (% change since 2000)
Racial diversity
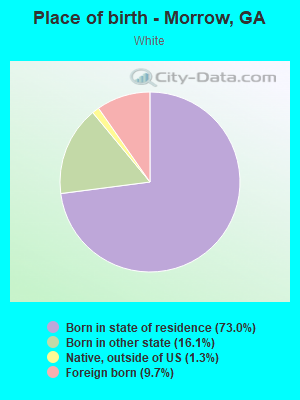
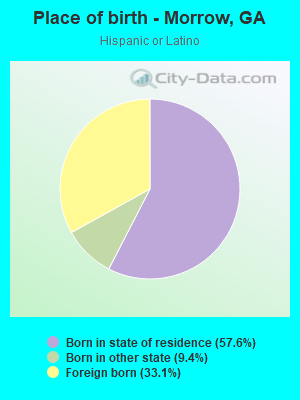
Place of birth - Born in state of residence (%)
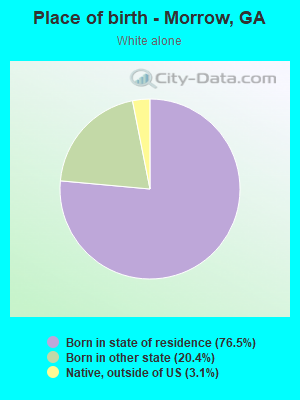
Place of birth - Born in state of residence (%) - White
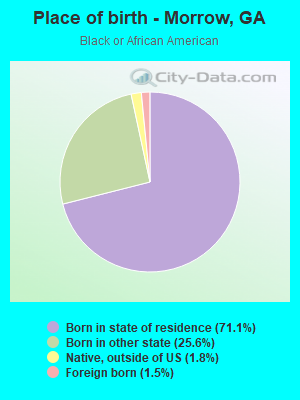
Place of birth - Born in state of residence (%) - Black or African American
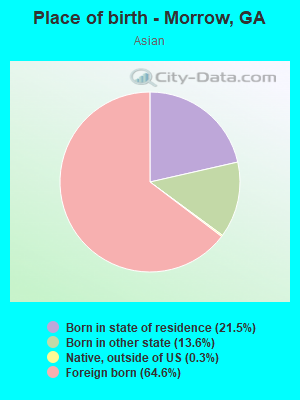
Place of birth - Born in state of residence (%) - Asian
Place of birth - Born in state of residence (%) - Hispanic or Latino
Place of birth - Born in state of residence (%) - American Indian and Alaska Native
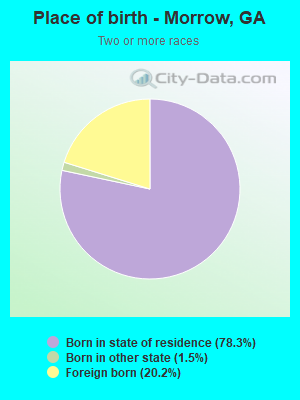
Place of birth - Born in state of residence (%) - Multirace
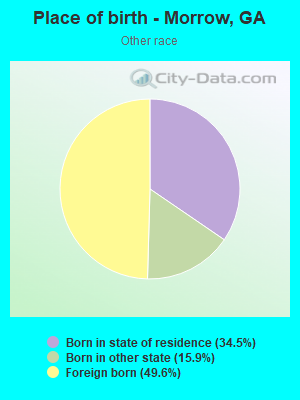
Place of birth - Born in state of residence (%) - Other Race
Place of birth - Born in other state (%)
Place of birth - Born in other state (%) - White
Place of birth - Born in other state (%) - Black or African American
Place of birth - Born in other state (%) - Asian
Place of birth - Born in other state (%) - Hispanic or Latino
Place of birth - Born in other state (%) - American Indian and Alaska Native
Place of birth - Born in other state (%) - Multirace
Place of birth - Born in other state (%) - Other Race
Place of birth - Native, outside of US (%)
Place of birth - Native, outside of US (%) - White
Place of birth - Native, outside of US (%) - Black or African American
Place of birth - Native, outside of US (%) - Asian
Place of birth - Native, outside of US (%) - Hispanic or Latino
Place of birth - Native, outside of US (%) - American Indian and Alaska Native
Place of birth - Native, outside of US (%) - Multirace
Place of birth - Native, outside of US (%) - Other Race
Place of birth - Foreign born (%)
Place of birth - Foreign born (%) - White
Place of birth - Foreign born (%) - Black or African American
Place of birth - Foreign born (%) - Asian
Place of birth - Foreign born (%) - Hispanic or Latino
Place of birth - Foreign born (%) - American Indian and Alaska Native
Place of birth - Foreign born (%) - Multirace
Place of birth - Foreign born (%) - Other Race
Residents speaking English at home (%)
Residents speaking English at home - Born in the United States (%)
Residents speaking English at home - Native, born elsewhere (%)
Residents speaking English at home - Foreign born (%)
Residents speaking Spanish at home (%)
Residents speaking Spanish at home - Born in the United States (%)
Residents speaking Spanish at home - Native, born elsewhere (%)
Residents speaking Spanish at home - Foreign born (%)
Residents speaking other language at home (%)
Residents speaking other language at home - Born in the United States (%)
Residents speaking other language at home - Native, born elsewhere (%)
Residents speaking other language at home - Foreign born (%)
Marital status - Never married (%)
Marital status - Now married (%)
Marital status - Separated (%)
Marital status - Widowed (%)
Marital status - Divorced (%)
Ancestries Reported - Arab (%)
Ancestries Reported - Czech (%)
Ancestries Reported - Danish (%)
Ancestries Reported - Dutch (%)
Ancestries Reported - English (%)
Ancestries Reported - French (%)
Ancestries Reported - French Canadian (%)
Ancestries Reported - German (%)
Ancestries Reported - Greek (%)
Ancestries Reported - Hungarian (%)
Ancestries Reported - Irish (%)
Ancestries Reported - Italian (%)
Ancestries Reported - Lithuanian (%)
Ancestries Reported - Norwegian (%)
Ancestries Reported - Polish (%)
Ancestries Reported - Portuguese (%)
Ancestries Reported - Russian (%)
Ancestries Reported - Scotch-Irish (%)
Ancestries Reported - Scottish (%)
Ancestries Reported - Slovak (%)
Ancestries Reported - Subsaharan African (%)
Ancestries Reported - Swedish (%)
Ancestries Reported - Swiss (%)
Ancestries Reported - Ukrainian (%)
Ancestries Reported - United States (%)
Ancestries Reported - Welsh (%)
Ancestries Reported - West Indian (%)
Ancestries Reported - Other (%)
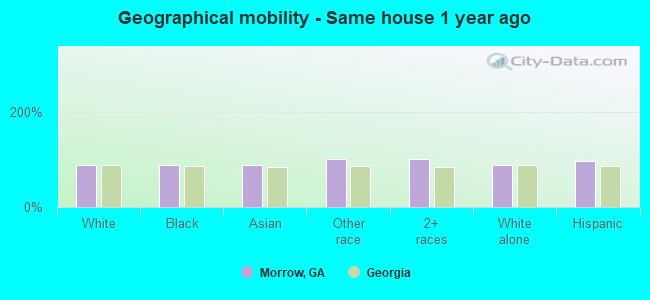
Geographical mobility - Same house 1 year ago (%)
Geographical mobility - Same house 1 year ago (%) - White
Geographical mobility - Same house 1 year ago (%) - Black or African American
Geographical mobility - Same house 1 year ago (%) - Asian
Geographical mobility - Same house 1 year ago (%) - Hispanic or Latino
Geographical mobility - Same house 1 year ago (%) - American Indian and Alaska Native
Geographical mobility - Same house 1 year ago (%) - Multirace
Geographical mobility - Same house 1 year ago (%) - Other Race
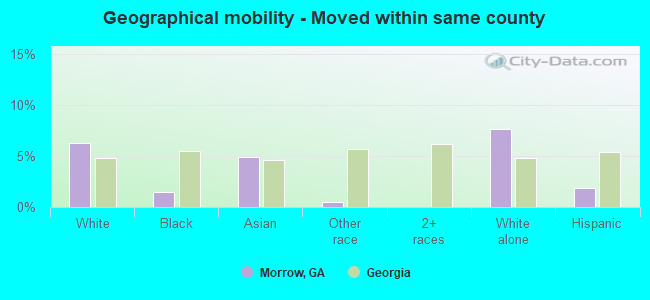
Geographical mobility - Moved within same county (%)
Geographical mobility - Moved within same county (%) - White
Geographical mobility - Moved within same county (%) - Black or African American
Geographical mobility - Moved within same county (%) - Asian
Geographical mobility - Moved within same county (%) - Hispanic or Latino
Geographical mobility - Moved within same county (%) - American Indian and Alaska Native
Geographical mobility - Moved within same county (%) - Multirace
Geographical mobility - Moved within same county (%) - Other Race
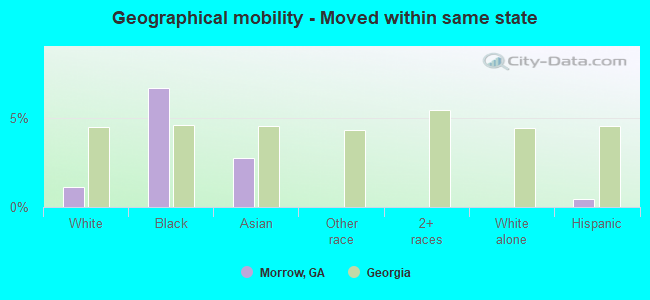
Geographical mobility - Moved from different county within same state (%)
Geographical mobility - Moved from different county within same state (%) - White
Geographical mobility - Moved from different county within same state (%) - Black or African American
Geographical mobility - Moved from different county within same state (%) - Asian
Geographical mobility - Moved from different county within same state (%) - Hispanic or Latino
Geographical mobility - Moved from different county within same state (%) - American Indian and Alaska Native
Geographical mobility - Moved from different county within same state (%) - Multirace
Geographical mobility - Moved from different county within same state (%) - Other Race
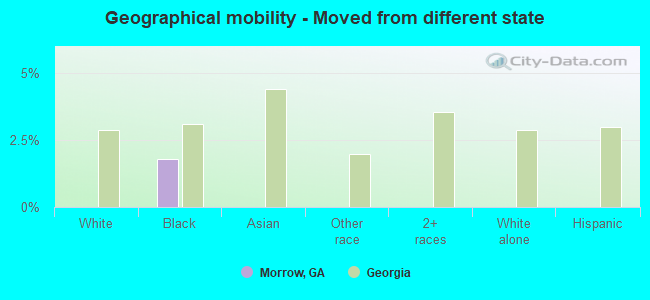
Geographical mobility - Moved from different state (%)
Geographical mobility - Moved from different state (%) - White
Geographical mobility - Moved from different state (%) - Black or African American
Geographical mobility - Moved from different state (%) - Asian
Geographical mobility - Moved from different state (%) - Hispanic or Latino
Geographical mobility - Moved from different state (%) - American Indian and Alaska Native
Geographical mobility - Moved from different state (%) - Multirace
Geographical mobility - Moved from different state (%) - Other Race
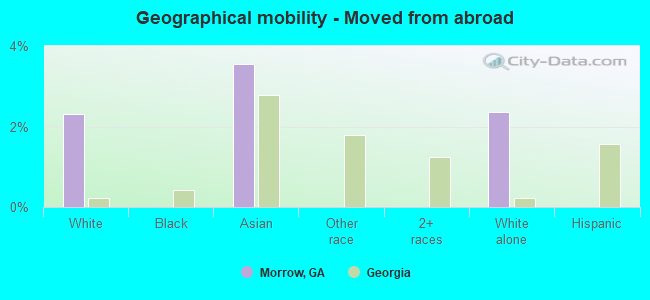
Geographical mobility - Moved from abroad (%)
Geographical mobility - Moved from abroad (%) - White
Geographical mobility - Moved from abroad (%) - Black or African American
Geographical mobility - Moved from abroad (%) - Asian
Geographical mobility - Moved from abroad (%) - Hispanic or Latino
Geographical mobility - Moved from abroad (%) - American Indian and Alaska Native
Geographical mobility - Moved from abroad (%) - Multirace
Geographical mobility - Moved from abroad (%) - Other Race
Place of birth for the foreign-born population - Ireland (%)
Place of birth for the foreign-born population - Denmark (%)
Place of birth for the foreign-born population - Norway (%)
Place of birth for the foreign-born population - Sweden (%)
Place of birth for the foreign-born population - United Kingdom (%)
Place of birth for the foreign-born population - England (%)
Place of birth for the foreign-born population - Scotland (%)
Place of birth for the foreign-born population - Other Northern Europe (%)
Place of birth for the foreign-born population - Austria (%)
Place of birth for the foreign-born population - Belgium (%)
Place of birth for the foreign-born population - France (%)
Place of birth for the foreign-born population - Germany (%)
Place of birth for the foreign-born population - Netherlands (%)
Place of birth for the foreign-born population - Switzerland (%)
Place of birth for the foreign-born population - Other Western Europe (%)
Place of birth for the foreign-born population - Greece (%)
Place of birth for the foreign-born population - Italy (%)
Place of birth for the foreign-born population - Portugal (%)
Place of birth for the foreign-born population - Spain (%)
Place of birth for the foreign-born population - Other Southern Europe (%)
Place of birth for the foreign-born population - Albania (%)
Place of birth for the foreign-born population - Belarus (%)
Place of birth for the foreign-born population - Bosnia and Herzegovina (%)
Place of birth for the foreign-born population - Bulgaria (%)
Place of birth for the foreign-born population - Croatia (%)
Place of birth for the foreign-born population - Czechoslovakia (%)
Place of birth for the foreign-born population - Hungary (%)
Place of birth for the foreign-born population - Latvia (%)
Place of birth for the foreign-born population - Lithuania (%)
Place of birth for the foreign-born population - North Macedonia (Macedonia) (%)
Place of birth for the foreign-born population - Moldova (%)
Place of birth for the foreign-born population - Poland (%)
Place of birth for the foreign-born population - Romania (%)
Place of birth for the foreign-born population - Russia (%)
Place of birth for the foreign-born population - Serbia (%)
Place of birth for the foreign-born population - Ukraine (%)
Place of birth for the foreign-born population - Other Eastern Europe (%)
Place of birth for the foreign-born population - China (%)
Place of birth for the foreign-born population - Hong Kong (%)
Place of birth for the foreign-born population - Taiwan (%)
Place of birth for the foreign-born population - Japan (%)
Place of birth for the foreign-born population - Korea (%)
Place of birth for the foreign-born population - Other Eastern Asia (%)
Place of birth for the foreign-born population - Afghanistan (%)
Place of birth for the foreign-born population - Bangladesh (%)
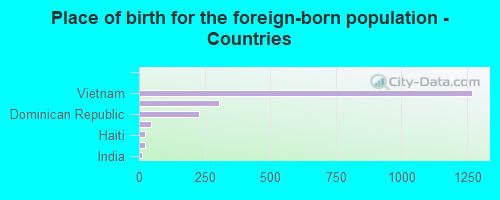
Place of birth for the foreign-born population - India (%)
Place of birth for the foreign-born population - Iran (%)
Place of birth for the foreign-born population - Kazakhstan (%)
Place of birth for the foreign-born population - Nepal (%)
Place of birth for the foreign-born population - Pakistan (%)
Place of birth for the foreign-born population - Sri Lanka (%)
Place of birth for the foreign-born population - Uzbekistan (%)
Place of birth for the foreign-born population - Other South Central Asia (%)
Place of birth for the foreign-born population - Burma (%)
Place of birth for the foreign-born population - Cambodia (%)
Place of birth for the foreign-born population - Indonesia (%)
Place of birth for the foreign-born population - Laos (%)
Place of birth for the foreign-born population - Malaysia (%)
Place of birth for the foreign-born population - Philippines (%)
Place of birth for the foreign-born population - Singapore (%)
Place of birth for the foreign-born population - Thailand (%)
Place of birth for the foreign-born population - Vietnam (%)
Place of birth for the foreign-born population - Other South Eastern Asia (%)
Place of birth for the foreign-born population - Armenia (%)
Place of birth for the foreign-born population - Iraq (%)
Place of birth for the foreign-born population - Israel (%)
Place of birth for the foreign-born population - Jordan (%)
Place of birth for the foreign-born population - Kuwait (%)
Place of birth for the foreign-born population - Lebanon (%)
Place of birth for the foreign-born population - Saudi Arabia (%)
Place of birth for the foreign-born population - Syria (%)
Place of birth for the foreign-born population - Turkey (%)
Place of birth for the foreign-born population - Yemen (%)
Place of birth for the foreign-born population - Other Western Asia (%)
Place of birth for the foreign-born population - Eritrea (%)
Place of birth for the foreign-born population - Ethiopia (%)
Place of birth for the foreign-born population - Kenya (%)
Place of birth for the foreign-born population - Somalia (%)
Place of birth for the foreign-born population - Uganda (%)
Place of birth for the foreign-born population - Zimbabwe (%)
Place of birth for the foreign-born population - Other Eastern Africa (%)
Place of birth for the foreign-born population - Cameroon (%)
Place of birth for the foreign-born population - Congo (%)
Place of birth for the foreign-born population - Democratic Republic of Congo (Zaire) (%)
Place of birth for the foreign-born population - Other Middle Africa (%)
Place of birth for the foreign-born population - Egypt (%)
Place of birth for the foreign-born population - Morocco (%)
Place of birth for the foreign-born population - Sudan (%)
Place of birth for the foreign-born population - Other Northern Africa (%)
Place of birth for the foreign-born population - South Africa (%)
Place of birth for the foreign-born population - Other Southern Africa (%)
Place of birth for the foreign-born population - Cabo Verde (%)
Place of birth for the foreign-born population - Ghana (%)
Place of birth for the foreign-born population - Liberia (%)
Place of birth for the foreign-born population - Nigeria (%)
Place of birth for the foreign-born population - Senegal (%)
Place of birth for the foreign-born population - Sierra Leone (%)
Place of birth for the foreign-born population - Other Western Africa (%)
Place of birth for the foreign-born population - Australia (%)
Place of birth for the foreign-born population - New Zealand (%)
Place of birth for the foreign-born population - Fiji (%)
Place of birth for the foreign-born population - Micronesia (%)
Place of birth for the foreign-born population - Bahamas (%)
Place of birth for the foreign-born population - Barbados (%)
Place of birth for the foreign-born population - Cuba (%)
Place of birth for the foreign-born population - Dominica (%)
Place of birth for the foreign-born population - Dominican Republic (%)
Place of birth for the foreign-born population - Grenada (%)
Place of birth for the foreign-born population - Haiti (%)
Place of birth for the foreign-born population - Jamaica (%)
Place of birth for the foreign-born population - St. Vincent and the Grenadines (%)
Place of birth for the foreign-born population - Trinidad and Tobago (%)
Place of birth for the foreign-born population - West Indies (%)
Place of birth for the foreign-born population - Other Caribbean (%)
Place of birth for the foreign-born population - Belize (%)
Place of birth for the foreign-born population - Costa Rica (%)
Place of birth for the foreign-born population - El Salvador (%)
Place of birth for the foreign-born population - Guatemala (%)
Place of birth for the foreign-born population - Honduras (%)
Place of birth for the foreign-born population - Mexico (%)
Place of birth for the foreign-born population - Nicaragua (%)
Place of birth for the foreign-born population - Panama (%)
Place of birth for the foreign-born population - Other Central America (%)
Place of birth for the foreign-born population - Argentina (%)
Place of birth for the foreign-born population - Bolivia (%)
Place of birth for the foreign-born population - Brazil (%)
Place of birth for the foreign-born population - Chile (%)
Place of birth for the foreign-born population - Colombia (%)
Place of birth for the foreign-born population - Ecuador (%)
Place of birth for the foreign-born population - Guyana (%)
Place of birth for the foreign-born population - Peru (%)
Place of birth for the foreign-born population - Uruguay (%)
Place of birth for the foreign-born population - Venezuela (%)
Place of birth for the foreign-born population - Other South America (%)
Place of birth for the foreign-born population - Canada (%)
Place of birth for the foreign-born population - Other Northern America (%)
Place of birth for the foreign-born population - Other (%)
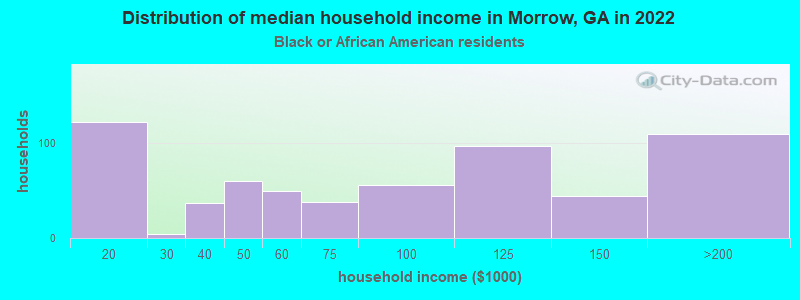
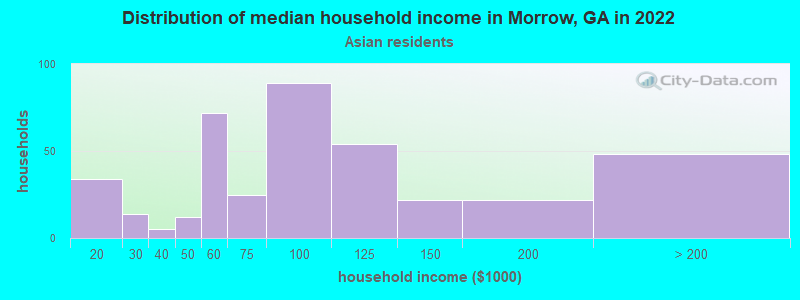
According to 2022 data, the most numerous races in Morrow, GA are White alone (423 residents), Black alone (2,283 residents), and Hispanic (1,814 residents). 45.6% of Morrow residents speak English at home. 29.2% of Morrow, GA residents are foreign-born (18.7% born in Asia, 9.3% born in Latin America), which is 65.8% greater than the foreign-born rate of 10.0% across the entire state of Georgia.
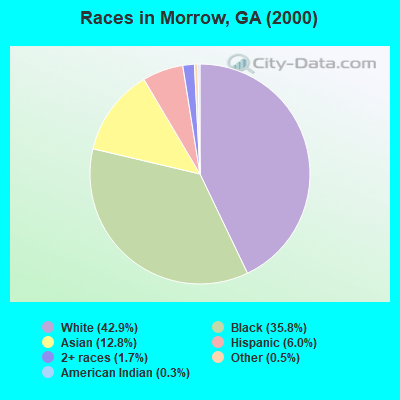
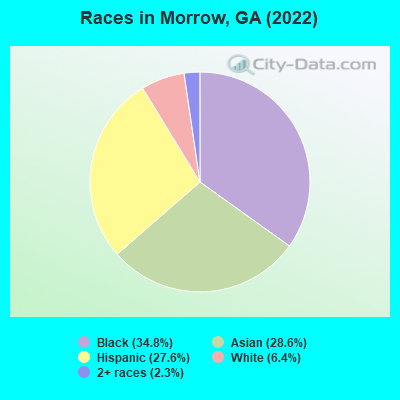
Race distribution in Morrow
2000 2022
5,128,661 62.6% White alone 2,331,465 28.5% Black alone 435,227 5.3% Hispanic 171,513 2.1% Asian alone 87,364 1.1% Two or more races 17,670 0.2% American Indian alone 11,275 0.1% Other race alone 3,278 0.04% Native Hawaiian and Other
5,415,657 49.6% White alone 3,349,240 30.7% Black alone 1,132,604 10.4% Hispanic 479,156 4.4% Asian alone 462,923 4.2% Two or more races 54,416 0.5% Other race alone 11,923 0.1% American Indian alone 6,957 0.06% Native Hawaiian and Other
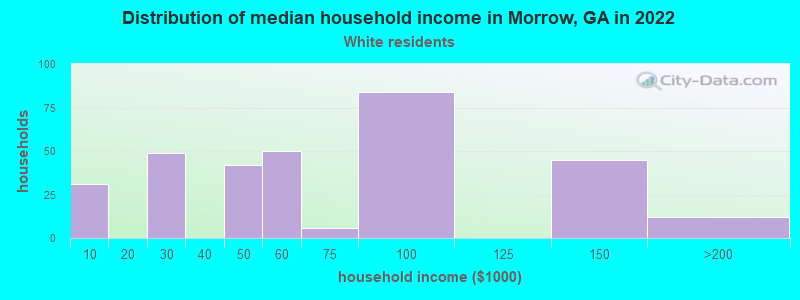
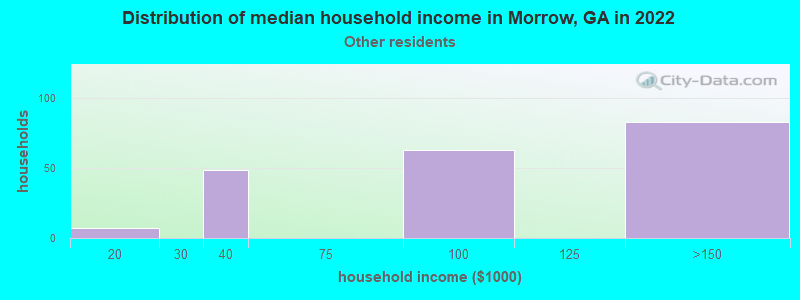
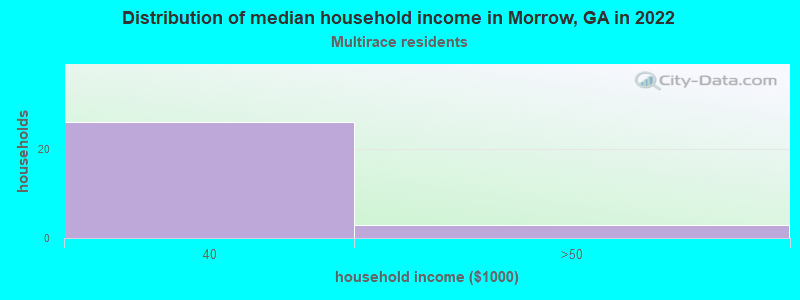
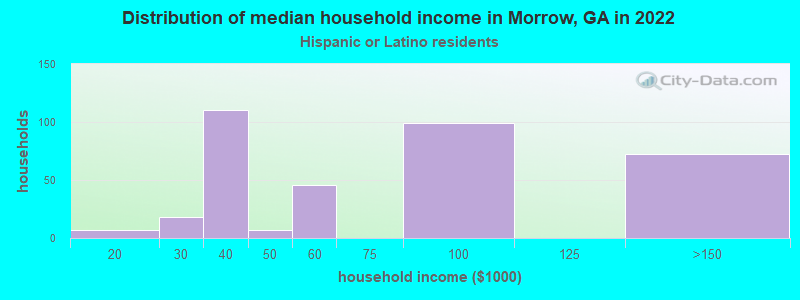
Income and house value in Morrow Median household income in 2022 $43,295 White non-Hispanic householders$67,952 Black householders$82,290 Asian householders$69,813 Hispanic or Latino race householdersMedian 2022 house value $194,631 White Non-Hispanic householders$196,518 Black or African American householders $173,658 Asian householders$235,948 Some other race householders$262,165 Two or more races householders$242,450 Hispanic or Latino householders
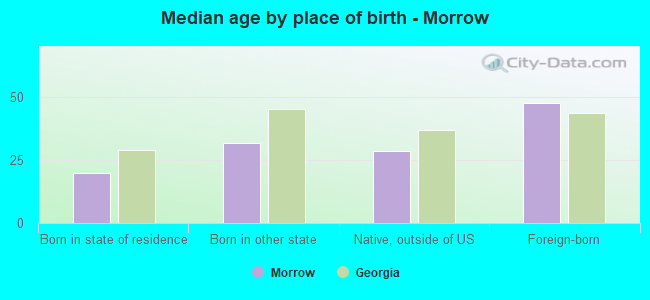
Median age by race in Morrow
39.2 Median age for White residents30.9 49.3 28.5 Median age for Black or African American residents41.5 24.3 -566,666,666.1 Median age for American Indian / Alaska Native residents-560,327,197.8 -508,361,203.5 41.0 Median age for Asian residents42.0 44.9 -657,243,815.6 Median age for Native Hawaiian / Pacific Islander residents-693,227,090.9 -776,776,776.0 27.7 Median age for Other race residents32.7 27.7 7.0 Median age for Two or more races residents9.8 3.8 57.4 Median age for White alone residents55.5 63.2 21.4 Median age for Hispanic or Latino residents22.4 9.8
Owner/renter occupied households by race in Morrow
House owners and renters - White residents 203 65.5% Owner occupied107 34.5% Renter occupiedHouse owners and renters - Black or African American residents 127 20.7% Owner occupied487 79.3% Renter occupiedHouse owners and renters - Asian residents 456 95.4% Owner occupied22 4.6% Renter occupiedHouse owners and renters - Other race residents 172 100.0% Owner occupiedHouse owners and renters - Two or more races residents 44 100.0% Renter occupiedHouse owners and renters - White alone residents 163 78.7% Owner occupied44 21.3% Renter occupiedHouse owners and renters - Hispanic or Latino residents 254 64.9% Owner occupied137 35.1% Renter occupied
Language usage in Morrow
English speakers - Total 45.6% of residents of Morrow speak English at home.
26.5% of residents speak Spanish at home 627 38.4% Speak English very well1,007 61.6% Speak English less than very well34.2% of residents speak other language at home 862 41.0% Speak English very well1,240 59.0% Speak English less than very well
English speakers - Born in the United States 79.3% of residents of Morrow speak English at home.
20.7% of residents speak Spanish at home 224 100.0% Speak English very well5.6% of residents speak other language at home 60 100.0% Speak English very well
English speakers - Native, born elsewhere 94.4% of residents of Morrow speak English at home.
7.4% of residents speak other language at home 4 100.0% Speak English less than very well
English speakers - Foreign-born 0.0% of residents of Morrow speak English at home.
28.1% of residents speak Spanish at home 127 22.2% Speak English very well445 77.8% Speak English less than very well73.2% of residents speak other language at home 249 16.7% Speak English very well1,240 83.3% Speak English less than very well
White (Caucasian) - Speak another language Native:
26.7% (211)Foreign-born:
89.1% (73)
Black or African American - Speak another language Native:
16.5% (356)Foreign-born:
100.0% (36)
Asian - Speak another language Native:
55.8% (259)Foreign-born:
96.2% (1,181)
Other race - Speak another language Native:
84.6% (398)Foreign-born:
93.5% (469)
Two or more races - Speak another language Native:
49.4% (139)Foreign-born:
94.7% (127)
Hispanic or Latino - Speak another language Native:
97.7% (1,007)Foreign-born:
98.9% (592)
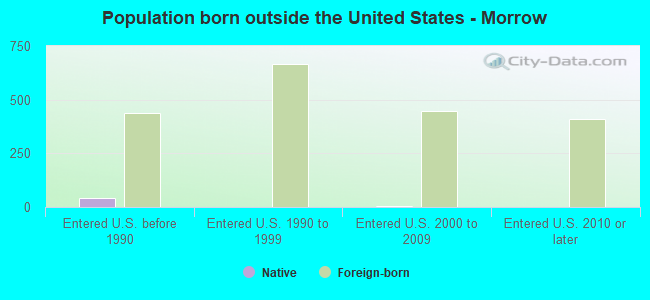
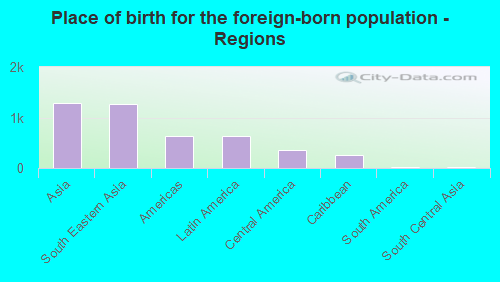
Foreign-born residents in Morrow 1,921 residents are foreign born (18.7% Asia , 9.3% Latin America ).
This city:
29.2%Georgia:
10.4%
Marital status for residents in Morrow Marital status - White (Caucasian) population 15 years and over
Males 62.1% Never married34.5% Now married0.0% Separated0.0% Widowed3.4% DivorcedFemales 20.1% Never married68.2% Now married0.0% Separated2.5% Widowed9.2% DivorcedWomen who did not give birth in the past 12 months Now married:
65.6% (75)Unmarried:
34.4% (39)
Marital status - Black or African American population 15 years and over
Males 46.8% Never married35.9% Now married0.0% Separated0.0% Widowed17.4% DivorcedFemales 74.9% Never married17.3% Now married0.0% Separated3.7% Widowed4.1% DivorcedWomen who did not give birth in the past 12 months Now married:
10.8% (97)Unmarried:
89.2% (804)
Marital status - Asian population 15 years and over
Males 29.9% Never married55.9% Now married0.0% Separated2.8% Widowed11.5% DivorcedFemales 15.3% Never married70.0% Now married8.6% Separated2.7% Widowed3.5% DivorcedWomen who gave birth in the past 12 months Now married:
100.0% (56)Unmarried:
0.0% (0)
Women who did not give birth in the past 12 months Now married:
84.5% (230)Unmarried:
15.5% (42)
Marital status - Other race population 15 years and over
Males 1.9% Never married98.1% Now married0.0% Separated0.0% Widowed0.0% DivorcedFemales 0.0% Never married61.8% Now married0.0% Separated0.0% Widowed38.2% DivorcedWomen who did not give birth in the past 12 months Now married:
100.0% (248)Unmarried:
0.0% (0)
Marital status - Two or more races population 15 years and over
Males 15.6% Never married84.4% Now married0.0% Separated0.0% Widowed0.0% DivorcedFemales 41.5% Never married58.5% Now married0.0% Separated0.0% Widowed0.0% DivorcedWomen who did not give birth in the past 12 months Now married:
58.5% (47)Unmarried:
41.5% (34)
Marital status - White alone, not Hispanic / Latino population 15 years and over
Males 40.9% Never married48.9% Now married0.0% Separated0.0% Widowed10.1% DivorcedFemales 28.1% Never married52.9% Now married0.0% Separated4.1% Widowed14.9% DivorcedWomen who did not give birth in the past 12 months Now married:
41.6% (32)Unmarried:
58.4% (45)
Marital status - Hispanic or Latino population 15 years and over
Males 49.0% Never married51.0% Now married0.0% Separated0.0% Widowed0.0% DivorcedFemales 2.4% Never married74.8% Now married0.0% Separated0.0% Widowed22.8% DivorcedWomen who did not give birth in the past 12 months Now married:
96.3% (283)Unmarried:
3.7% (11)
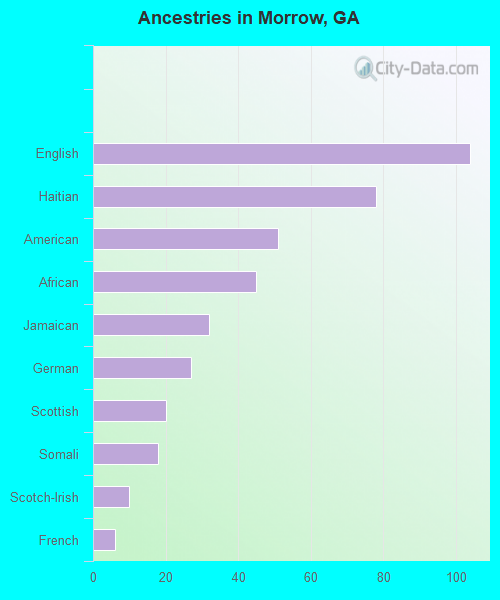
Ancestries in Morrow
104 2.4% English78 1.8% Haitian51 1.2% American45 1.0% African32 0.7% Jamaican27 0.6% German20 0.5% Scottish18 0.4% Somali10 0.2% Scotch-Irish6 0.1% French
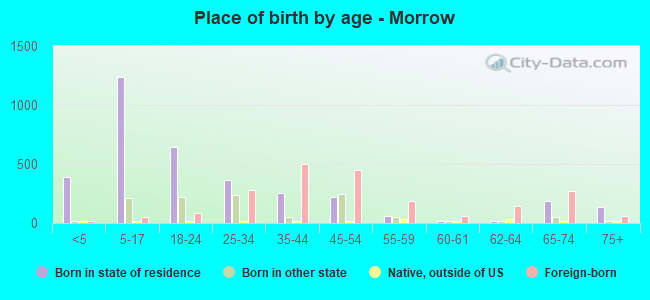
Children Nativity (place of birth) in Morrow
Children under 6 years - Living with two parents Both parents native 130 97.8% Native3 2.2% Foreign-bornBoth parents foreign-born 173 97.3% Native5 2.7% Foreign-bornOne native, one foreign-born parent 14 100.0% NativeChildren under 6 years - Living with one parent Native parent 145 100.0% NativeChildren 6 to 17 years - Living with two parents Both parents native 31 56.2% Native24 43.8% Foreign-bornBoth parents foreign-born 617 95.7% Native28 4.3% Foreign-bornOne native, one foreign-born parent 343 100.0% NativeChildren 6 to 17 years - Living with one parent Native parent 329 100.0% Native
Grandparents responsible for own grandchildren in Morrow
Grandparents (30 to 59 years) Black or African American 58 100.0% Not responsible for grandchildrenAsian 10 100.0% Not responsible for grandchildren
Grandparents (60 years and over) Black or African American 9 100.0% Responsible for grandchildrenAsian 32 100.0% Not responsible for grandchildren