Races in Needles, California (CA) Detailed Stats
Data:
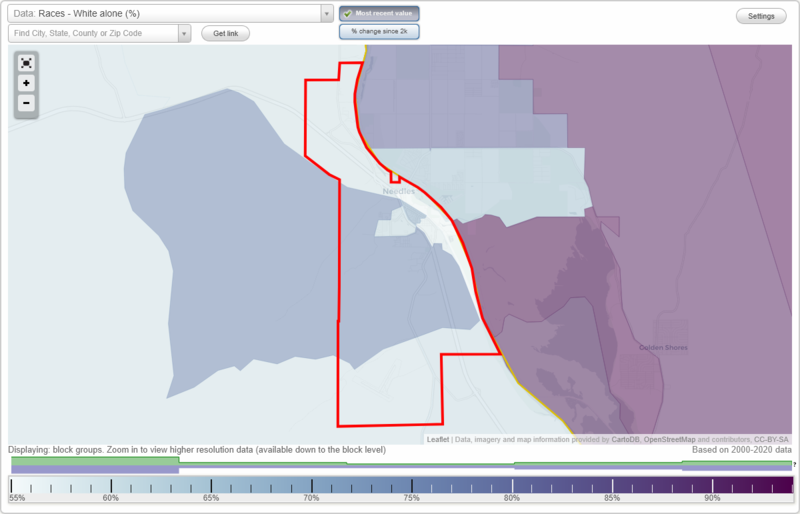
Races - White alone (%)
Races - White alone (% change since 2000)
Races - Black alone (%)
Races - Black alone (% change since 2000)
Races - American Indian alone (%)
Races - American Indian alone (% change since 2000)
Races - Asian alone (%)
Races - Asian alone (% change since 2000)
Races - Hispanic (%)
Races - Hispanic (% change since 2000)
Races - Native Hawaiian and Other Pacific Islander alone (%)
Races - Native Hawaiian and Other Pacific Islander alone (% change since 2000)
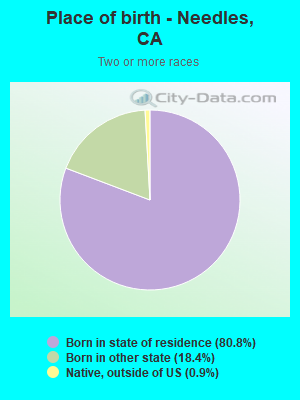
Races - Two or more races(%)
Races - Two or more races(% change since 2000)
Races - Other race alone (%)
Races - Other race alone (% change since 2000)
Racial diversity
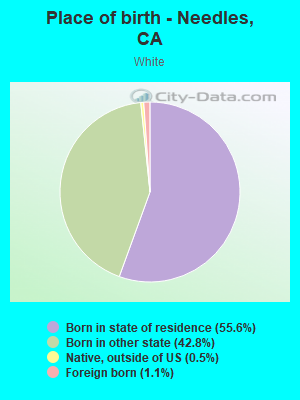
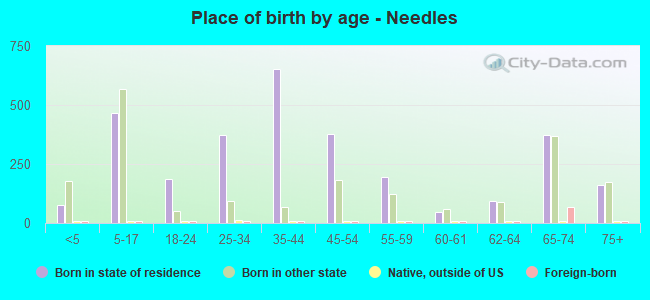
Place of birth - Born in state of residence (%)
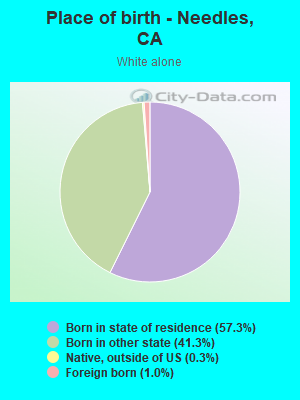
Place of birth - Born in state of residence (%) - White
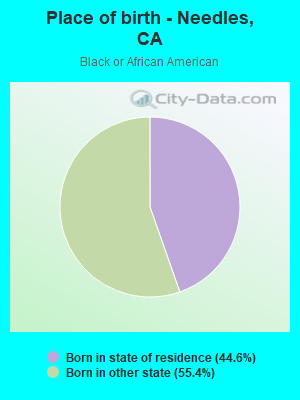
Place of birth - Born in state of residence (%) - Black or African American
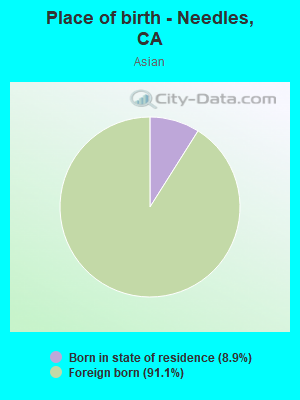
Place of birth - Born in state of residence (%) - Asian
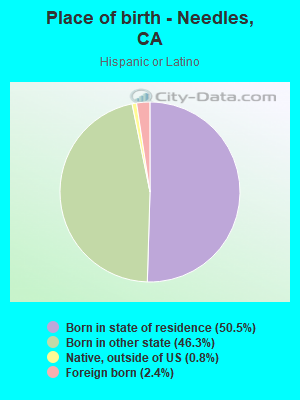
Place of birth - Born in state of residence (%) - Hispanic or Latino
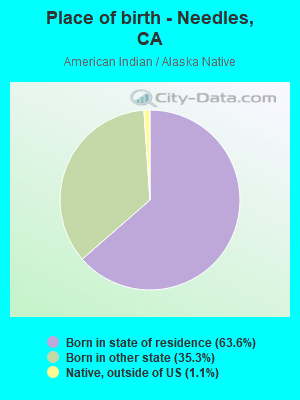
Place of birth - Born in state of residence (%) - American Indian and Alaska Native
Place of birth - Born in state of residence (%) - Multirace
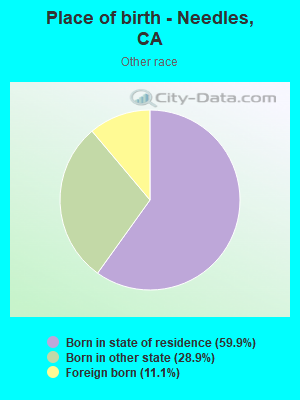
Place of birth - Born in state of residence (%) - Other Race
Place of birth - Born in other state (%)
Place of birth - Born in other state (%) - White
Place of birth - Born in other state (%) - Black or African American
Place of birth - Born in other state (%) - Asian
Place of birth - Born in other state (%) - Hispanic or Latino
Place of birth - Born in other state (%) - American Indian and Alaska Native
Place of birth - Born in other state (%) - Multirace
Place of birth - Born in other state (%) - Other Race
Place of birth - Native, outside of US (%)
Place of birth - Native, outside of US (%) - White
Place of birth - Native, outside of US (%) - Black or African American
Place of birth - Native, outside of US (%) - Asian
Place of birth - Native, outside of US (%) - Hispanic or Latino
Place of birth - Native, outside of US (%) - American Indian and Alaska Native
Place of birth - Native, outside of US (%) - Multirace
Place of birth - Native, outside of US (%) - Other Race
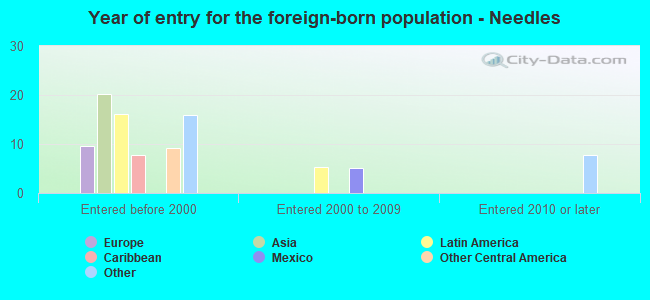
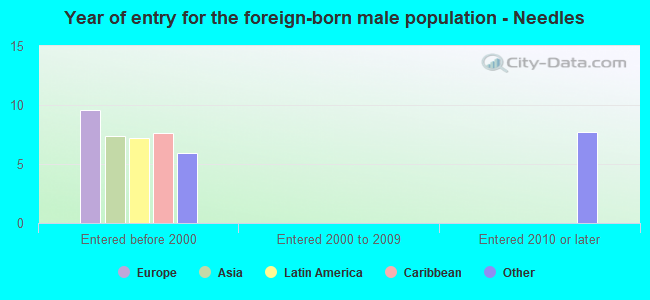
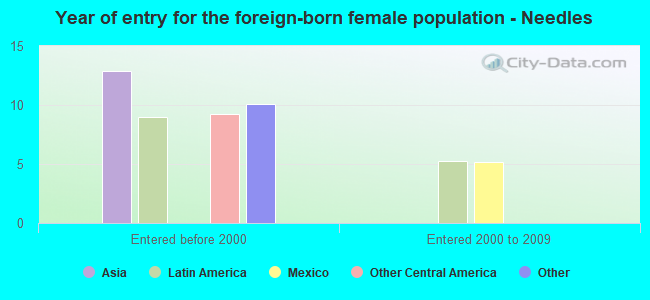
Place of birth - Foreign born (%)
Place of birth - Foreign born (%) - White
Place of birth - Foreign born (%) - Black or African American
Place of birth - Foreign born (%) - Asian
Place of birth - Foreign born (%) - Hispanic or Latino
Place of birth - Foreign born (%) - American Indian and Alaska Native
Place of birth - Foreign born (%) - Multirace
Place of birth - Foreign born (%) - Other Race
Residents speaking English at home (%)
Residents speaking English at home - Born in the United States (%)
Residents speaking English at home - Native, born elsewhere (%)
Residents speaking English at home - Foreign born (%)
Residents speaking Spanish at home (%)
Residents speaking Spanish at home - Born in the United States (%)
Residents speaking Spanish at home - Native, born elsewhere (%)
Residents speaking Spanish at home - Foreign born (%)
Residents speaking other language at home (%)
Residents speaking other language at home - Born in the United States (%)
Residents speaking other language at home - Native, born elsewhere (%)
Residents speaking other language at home - Foreign born (%)
Marital status - Never married (%)
Marital status - Now married (%)
Marital status - Separated (%)
Marital status - Widowed (%)
Marital status - Divorced (%)
Ancestries Reported - Arab (%)
Ancestries Reported - Czech (%)
Ancestries Reported - Danish (%)
Ancestries Reported - Dutch (%)
Ancestries Reported - English (%)
Ancestries Reported - French (%)
Ancestries Reported - French Canadian (%)
Ancestries Reported - German (%)
Ancestries Reported - Greek (%)
Ancestries Reported - Hungarian (%)
Ancestries Reported - Irish (%)
Ancestries Reported - Italian (%)
Ancestries Reported - Lithuanian (%)
Ancestries Reported - Norwegian (%)
Ancestries Reported - Polish (%)
Ancestries Reported - Portuguese (%)
Ancestries Reported - Russian (%)
Ancestries Reported - Scotch-Irish (%)
Ancestries Reported - Scottish (%)
Ancestries Reported - Slovak (%)
Ancestries Reported - Subsaharan African (%)
Ancestries Reported - Swedish (%)
Ancestries Reported - Swiss (%)
Ancestries Reported - Ukrainian (%)
Ancestries Reported - United States (%)
Ancestries Reported - Welsh (%)
Ancestries Reported - West Indian (%)
Ancestries Reported - Other (%)
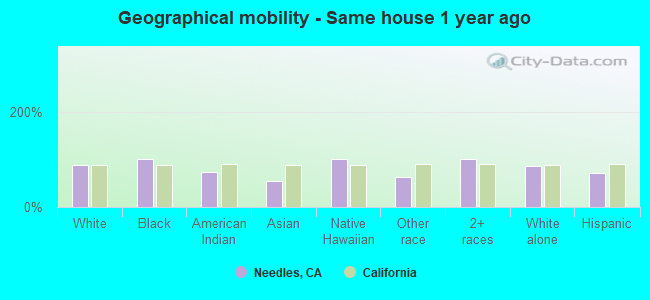
Geographical mobility - Same house 1 year ago (%)
Geographical mobility - Same house 1 year ago (%) - White
Geographical mobility - Same house 1 year ago (%) - Black or African American
Geographical mobility - Same house 1 year ago (%) - Asian
Geographical mobility - Same house 1 year ago (%) - Hispanic or Latino
Geographical mobility - Same house 1 year ago (%) - American Indian and Alaska Native
Geographical mobility - Same house 1 year ago (%) - Multirace
Geographical mobility - Same house 1 year ago (%) - Other Race
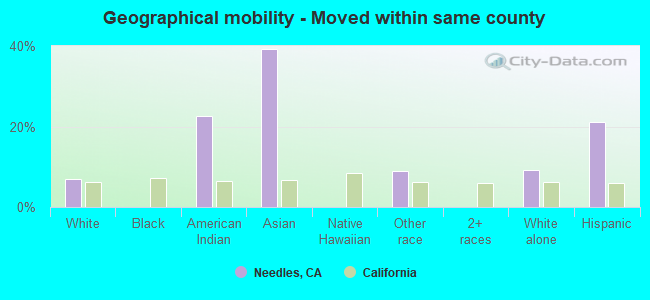
Geographical mobility - Moved within same county (%)
Geographical mobility - Moved within same county (%) - White
Geographical mobility - Moved within same county (%) - Black or African American
Geographical mobility - Moved within same county (%) - Asian
Geographical mobility - Moved within same county (%) - Hispanic or Latino
Geographical mobility - Moved within same county (%) - American Indian and Alaska Native
Geographical mobility - Moved within same county (%) - Multirace
Geographical mobility - Moved within same county (%) - Other Race
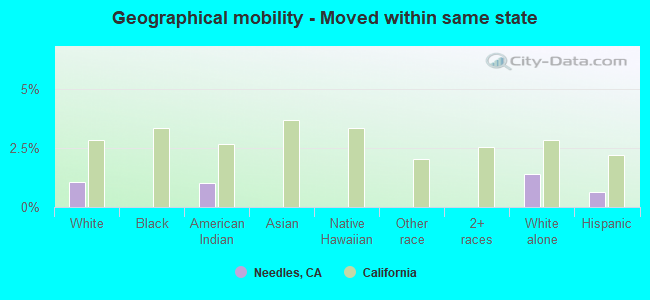
Geographical mobility - Moved from different county within same state (%)
Geographical mobility - Moved from different county within same state (%) - White
Geographical mobility - Moved from different county within same state (%) - Black or African American
Geographical mobility - Moved from different county within same state (%) - Asian
Geographical mobility - Moved from different county within same state (%) - Hispanic or Latino
Geographical mobility - Moved from different county within same state (%) - American Indian and Alaska Native
Geographical mobility - Moved from different county within same state (%) - Multirace
Geographical mobility - Moved from different county within same state (%) - Other Race
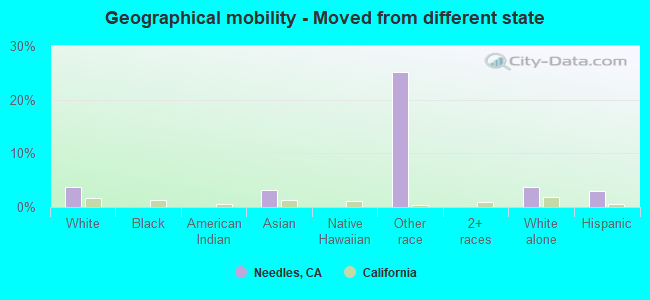
Geographical mobility - Moved from different state (%)
Geographical mobility - Moved from different state (%) - White
Geographical mobility - Moved from different state (%) - Black or African American
Geographical mobility - Moved from different state (%) - Asian
Geographical mobility - Moved from different state (%) - Hispanic or Latino
Geographical mobility - Moved from different state (%) - American Indian and Alaska Native
Geographical mobility - Moved from different state (%) - Multirace
Geographical mobility - Moved from different state (%) - Other Race
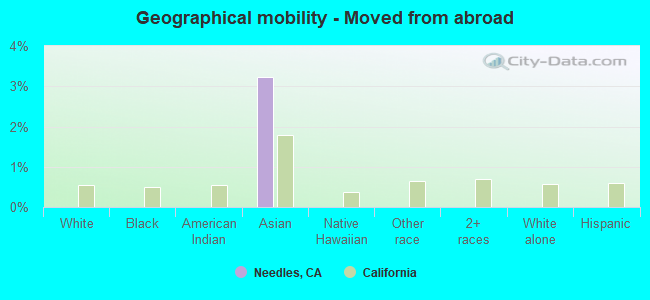
Geographical mobility - Moved from abroad (%)
Geographical mobility - Moved from abroad (%) - White
Geographical mobility - Moved from abroad (%) - Black or African American
Geographical mobility - Moved from abroad (%) - Asian
Geographical mobility - Moved from abroad (%) - Hispanic or Latino
Geographical mobility - Moved from abroad (%) - American Indian and Alaska Native
Geographical mobility - Moved from abroad (%) - Multirace
Geographical mobility - Moved from abroad (%) - Other Race
Place of birth for the foreign-born population - Ireland (%)
Place of birth for the foreign-born population - Denmark (%)
Place of birth for the foreign-born population - Norway (%)
Place of birth for the foreign-born population - Sweden (%)
Place of birth for the foreign-born population - United Kingdom (%)
Place of birth for the foreign-born population - England (%)
Place of birth for the foreign-born population - Scotland (%)
Place of birth for the foreign-born population - Other Northern Europe (%)
Place of birth for the foreign-born population - Austria (%)
Place of birth for the foreign-born population - Belgium (%)
Place of birth for the foreign-born population - France (%)
Place of birth for the foreign-born population - Germany (%)
Place of birth for the foreign-born population - Netherlands (%)
Place of birth for the foreign-born population - Switzerland (%)
Place of birth for the foreign-born population - Other Western Europe (%)
Place of birth for the foreign-born population - Greece (%)
Place of birth for the foreign-born population - Italy (%)
Place of birth for the foreign-born population - Portugal (%)
Place of birth for the foreign-born population - Spain (%)
Place of birth for the foreign-born population - Other Southern Europe (%)
Place of birth for the foreign-born population - Albania (%)
Place of birth for the foreign-born population - Belarus (%)
Place of birth for the foreign-born population - Bosnia and Herzegovina (%)
Place of birth for the foreign-born population - Bulgaria (%)
Place of birth for the foreign-born population - Croatia (%)
Place of birth for the foreign-born population - Czechoslovakia (%)
Place of birth for the foreign-born population - Hungary (%)
Place of birth for the foreign-born population - Latvia (%)
Place of birth for the foreign-born population - Lithuania (%)
Place of birth for the foreign-born population - North Macedonia (Macedonia) (%)
Place of birth for the foreign-born population - Moldova (%)
Place of birth for the foreign-born population - Poland (%)
Place of birth for the foreign-born population - Romania (%)
Place of birth for the foreign-born population - Russia (%)
Place of birth for the foreign-born population - Serbia (%)
Place of birth for the foreign-born population - Ukraine (%)
Place of birth for the foreign-born population - Other Eastern Europe (%)
Place of birth for the foreign-born population - China (%)
Place of birth for the foreign-born population - Hong Kong (%)
Place of birth for the foreign-born population - Taiwan (%)
Place of birth for the foreign-born population - Japan (%)
Place of birth for the foreign-born population - Korea (%)
Place of birth for the foreign-born population - Other Eastern Asia (%)
Place of birth for the foreign-born population - Afghanistan (%)
Place of birth for the foreign-born population - Bangladesh (%)
Place of birth for the foreign-born population - India (%)
Place of birth for the foreign-born population - Iran (%)
Place of birth for the foreign-born population - Kazakhstan (%)
Place of birth for the foreign-born population - Nepal (%)
Place of birth for the foreign-born population - Pakistan (%)
Place of birth for the foreign-born population - Sri Lanka (%)
Place of birth for the foreign-born population - Uzbekistan (%)
Place of birth for the foreign-born population - Other South Central Asia (%)
Place of birth for the foreign-born population - Burma (%)
Place of birth for the foreign-born population - Cambodia (%)
Place of birth for the foreign-born population - Indonesia (%)
Place of birth for the foreign-born population - Laos (%)
Place of birth for the foreign-born population - Malaysia (%)
Place of birth for the foreign-born population - Philippines (%)
Place of birth for the foreign-born population - Singapore (%)
Place of birth for the foreign-born population - Thailand (%)
Place of birth for the foreign-born population - Vietnam (%)
Place of birth for the foreign-born population - Other South Eastern Asia (%)
Place of birth for the foreign-born population - Armenia (%)
Place of birth for the foreign-born population - Iraq (%)
Place of birth for the foreign-born population - Israel (%)
Place of birth for the foreign-born population - Jordan (%)
Place of birth for the foreign-born population - Kuwait (%)
Place of birth for the foreign-born population - Lebanon (%)
Place of birth for the foreign-born population - Saudi Arabia (%)
Place of birth for the foreign-born population - Syria (%)
Place of birth for the foreign-born population - Turkey (%)
Place of birth for the foreign-born population - Yemen (%)
Place of birth for the foreign-born population - Other Western Asia (%)
Place of birth for the foreign-born population - Eritrea (%)
Place of birth for the foreign-born population - Ethiopia (%)
Place of birth for the foreign-born population - Kenya (%)
Place of birth for the foreign-born population - Somalia (%)
Place of birth for the foreign-born population - Uganda (%)
Place of birth for the foreign-born population - Zimbabwe (%)
Place of birth for the foreign-born population - Other Eastern Africa (%)
Place of birth for the foreign-born population - Cameroon (%)
Place of birth for the foreign-born population - Congo (%)
Place of birth for the foreign-born population - Democratic Republic of Congo (Zaire) (%)
Place of birth for the foreign-born population - Other Middle Africa (%)
Place of birth for the foreign-born population - Egypt (%)
Place of birth for the foreign-born population - Morocco (%)
Place of birth for the foreign-born population - Sudan (%)
Place of birth for the foreign-born population - Other Northern Africa (%)
Place of birth for the foreign-born population - South Africa (%)
Place of birth for the foreign-born population - Other Southern Africa (%)
Place of birth for the foreign-born population - Cabo Verde (%)
Place of birth for the foreign-born population - Ghana (%)
Place of birth for the foreign-born population - Liberia (%)
Place of birth for the foreign-born population - Nigeria (%)
Place of birth for the foreign-born population - Senegal (%)
Place of birth for the foreign-born population - Sierra Leone (%)
Place of birth for the foreign-born population - Other Western Africa (%)
Place of birth for the foreign-born population - Australia (%)
Place of birth for the foreign-born population - New Zealand (%)
Place of birth for the foreign-born population - Fiji (%)
Place of birth for the foreign-born population - Micronesia (%)
Place of birth for the foreign-born population - Bahamas (%)
Place of birth for the foreign-born population - Barbados (%)
Place of birth for the foreign-born population - Cuba (%)
Place of birth for the foreign-born population - Dominica (%)
Place of birth for the foreign-born population - Dominican Republic (%)
Place of birth for the foreign-born population - Grenada (%)
Place of birth for the foreign-born population - Haiti (%)
Place of birth for the foreign-born population - Jamaica (%)
Place of birth for the foreign-born population - St. Vincent and the Grenadines (%)
Place of birth for the foreign-born population - Trinidad and Tobago (%)
Place of birth for the foreign-born population - West Indies (%)
Place of birth for the foreign-born population - Other Caribbean (%)
Place of birth for the foreign-born population - Belize (%)
Place of birth for the foreign-born population - Costa Rica (%)
Place of birth for the foreign-born population - El Salvador (%)
Place of birth for the foreign-born population - Guatemala (%)
Place of birth for the foreign-born population - Honduras (%)
Place of birth for the foreign-born population - Mexico (%)
Place of birth for the foreign-born population - Nicaragua (%)
Place of birth for the foreign-born population - Panama (%)
Place of birth for the foreign-born population - Other Central America (%)
Place of birth for the foreign-born population - Argentina (%)
Place of birth for the foreign-born population - Bolivia (%)
Place of birth for the foreign-born population - Brazil (%)
Place of birth for the foreign-born population - Chile (%)
Place of birth for the foreign-born population - Colombia (%)
Place of birth for the foreign-born population - Ecuador (%)
Place of birth for the foreign-born population - Guyana (%)
Place of birth for the foreign-born population - Peru (%)
Place of birth for the foreign-born population - Uruguay (%)
Place of birth for the foreign-born population - Venezuela (%)
Place of birth for the foreign-born population - Other South America (%)
Place of birth for the foreign-born population - Canada (%)
Place of birth for the foreign-born population - Other Northern America (%)
Place of birth for the foreign-born population - Other (%)
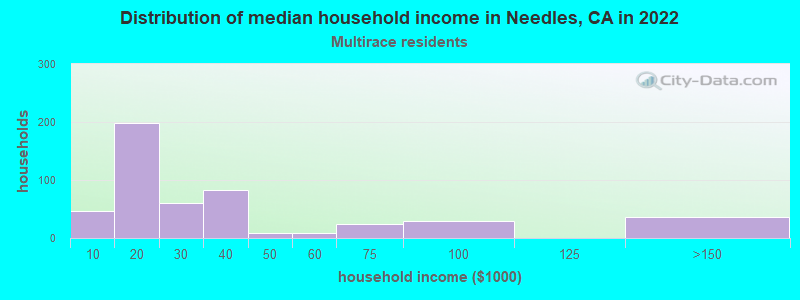
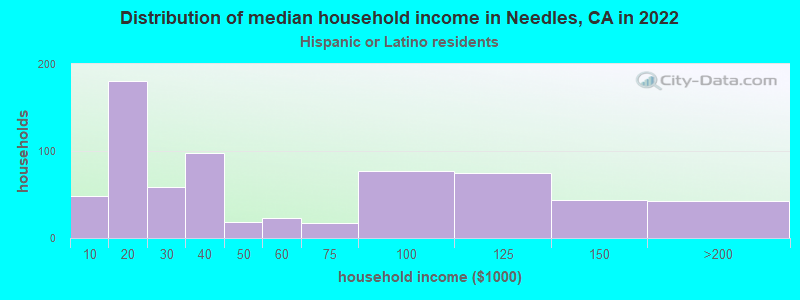
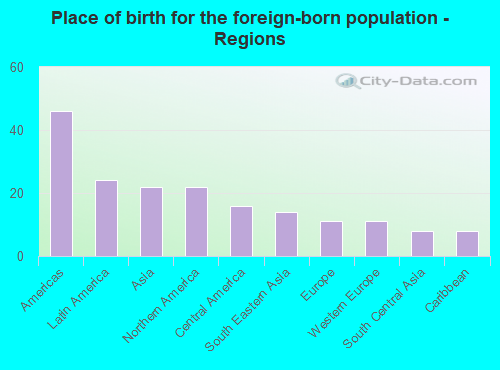
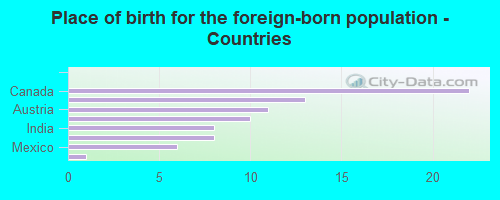
According to 2022 data, the most numerous races in Needles, CA are Hispanic (999 residents), White alone (3,026 residents), and Asian alone (26 residents). 95.9% of Needles residents speak English at home. 1.6% of Needles, CA residents are foreign-born , which is 1540.0% less than the foreign-born rate of 26.0% across the entire state of California.
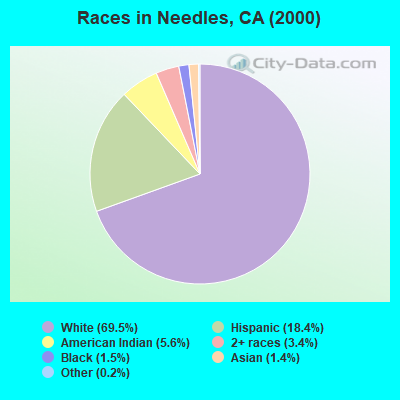
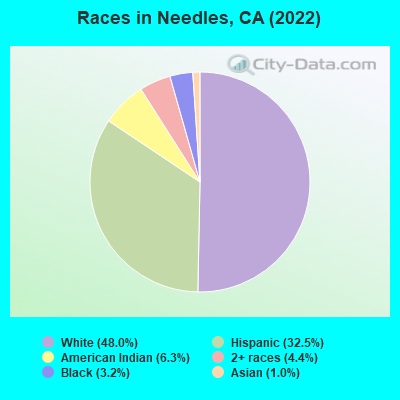
Race distribution in Needles
2000 2022
15,816,790 46.7% White alone 10,966,556 32.4% Hispanic 3,648,860 10.8% Asian alone 2,181,926 6.4% Black alone 903,115 2.7% Two or more races 178,984 0.5% American Indian alone 103,736 0.3% Native Hawaiian and Other 71,681 0.2% Other race alone
15,732,184 40.3% Hispanic 13,160,426 33.7% White alone 5,957,867 15.3% Asian alone 2,025,218 5.2% Black alone 1,663,222 4.3% Two or more races 251,618 0.6% Other race alone 135,777 0.3% Native Hawaiian and Other 103,030 0.3% American Indian alone
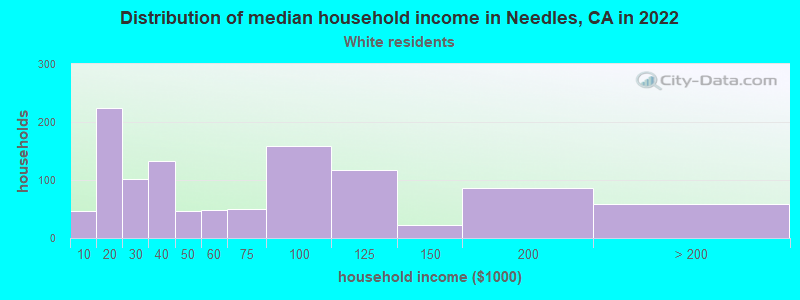
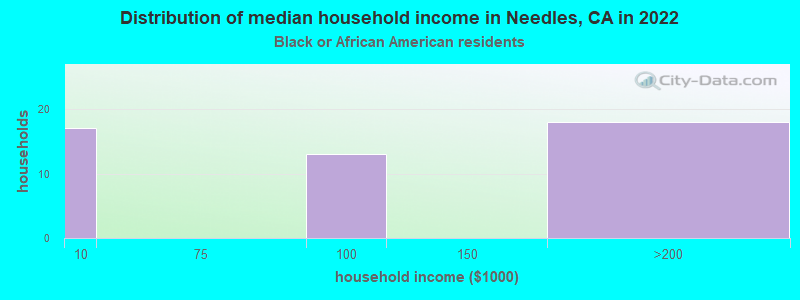
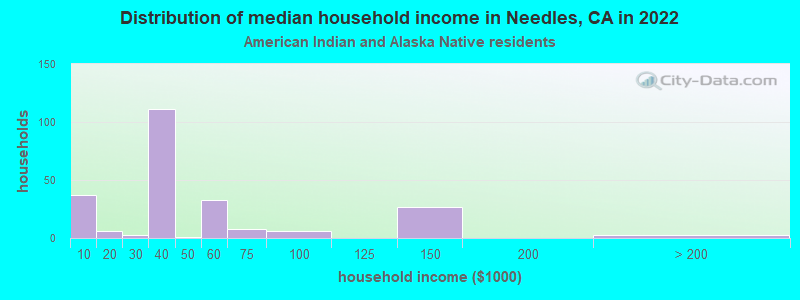
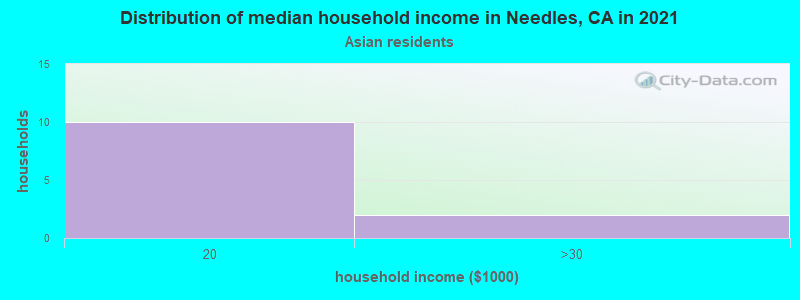
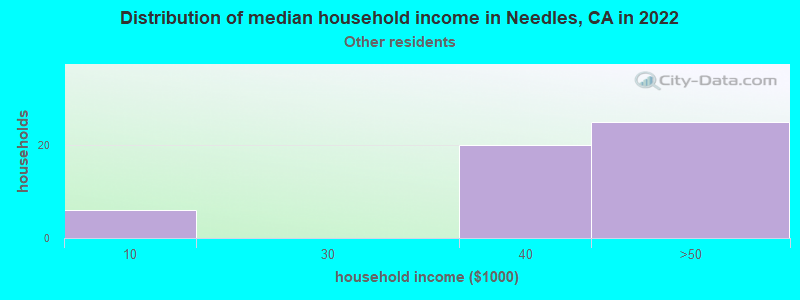
Income and house value in Needles Median household income in 2022 $43,900 White non-Hispanic householders$3,804 Black householders$56,868 American Indian and Alaska Native householders$53,371 Asian householders$141,656 Native Hawaiian and other Pacific Islander householders$21,262 Some other race householders$72,952 Two or more races householders$44,499 Hispanic or Latino race householdersMedian 2022 house value $288,303 White Non-Hispanic householders$206,239 American Indian or Alaska Native householders$584,885 Native Hawaiian and other Pacific Islander householders$293,342 Some other race householders$179,964 Two or more races householders$218,837 Hispanic or Latino householders
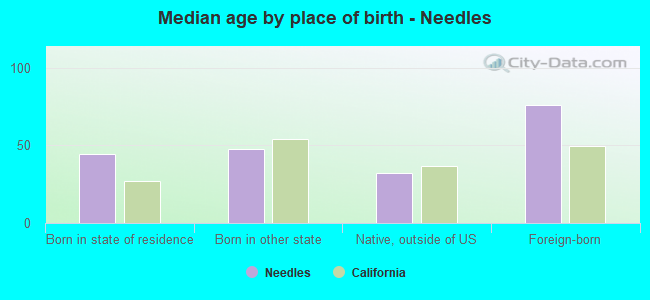
Median age by race in Needles
47.9 Median age for White residents48.2 47.9 45.8 Median age for Black or African American residents24.1 Median age for American Indian / Alaska Native residents17.1 35.0 75.4 Median age for Asian residents63.0 Median age for Native Hawaiian / Pacific Islander residents31.9 Median age for Other race residents24.0 Median age for Two or more races residents21.8 49.6 48.1 Median age for White alone residents47.9 48.5 27.4 Median age for Hispanic or Latino residents18.2 32.0
Owner/renter occupied households by race in Needles
House owners and renters - White residents 890 59.3% Owner occupied610 40.7% Renter occupiedHouse owners and renters - Black or African American residents 13 16.5% Owner occupied65 83.5% Renter occupiedHouse owners and renters - American Indian / Alaska Native residents 102 53.7% Owner occupied88 46.3% Renter occupiedHouse owners and renters - Asian residents 1 12.2% Owner occupied9 87.8% Renter occupiedHouse owners and renters - Native Hawaiian / Pacific Islander residents 8 100.0% Renter occupiedHouse owners and renters - Other race residents 38 100.0% Renter occupiedHouse owners and renters - Two or more races residents 56 28.5% Owner occupied140 71.5% Renter occupiedHouse owners and renters - White alone residents 776 56.3% Owner occupied602 43.7% Renter occupiedHouse owners and renters - Hispanic or Latino residents 210 60.7% Owner occupied136 39.3% Renter occupied
Language usage in Needles
English speakers - Total 95.9% of residents of Needles speak English at home.
2.3% of residents speak Spanish at home 93 86.1% Speak English very well15 13.9% Speak English less than very well2.4% of residents speak other language at home 104 91.2% Speak English very well10 8.8% Speak English less than very well
English speakers - Born in the United States 95.3% of residents of Needles speak English at home.
1.0% of residents speak Spanish at home 13 72.2% Speak English very well5 27.8% Speak English less than very well3.5% of residents speak other language at home 65 100.0% Speak English very well
English speakers - Native, born elsewhere 74.1% of residents of Needles speak English at home.
25.9% of residents speak Spanish at home 7 100.0% Speak English very well
English speakers - Foreign-born 30.8% of residents of Needles speak English at home.
28.2% of residents speak Spanish at home 13 59.1% Speak English very well9 40.9% Speak English less than very well41.0% of residents speak other language at home 25 78.1% Speak English very well7 21.9% Speak English less than very well
White (Caucasian) - Speak only English Native:
100.0% (3,173)Foreign-born:
54.7% (20)
White (Caucasian) - Speak another language Native:
1.3% (41)Foreign-born:
54.1% (20)
Asian - Speak another language Native:
87.4% (2)Foreign-born:
98.7% (23)
Other race - Speak another language Native:
29.3% (15)Foreign-born:
96.8% (6)
White alone - Speak only English Native:
97.8% (2,801)Foreign-born:
56.9% (19)
White alone - Speak another language Native:
1.2% (34)Foreign-born:
36.4% (12)
Hispanic or Latino - Speak another language Native:
5.2% (48)Foreign-born:
97.7% (24)
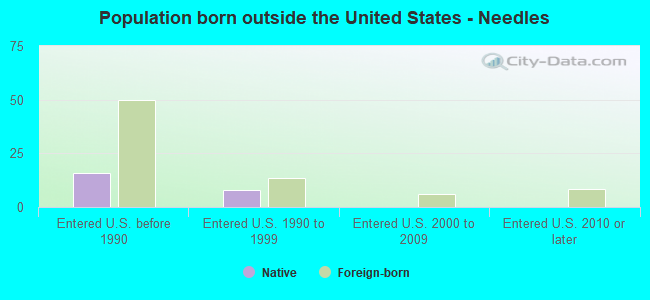
Foreign-born residents in Needles 80 residents are foreign born
This city:
1.6%California:
100.0%
Marital status for residents in Needles Marital status - White (Caucasian) population 15 years and over
Males 28.3% Never married50.7% Now married2.6% Separated4.8% Widowed13.6% DivorcedFemales 20.2% Never married43.0% Now married1.7% Separated18.6% Widowed16.6% DivorcedWomen who gave birth in the past 12 months Now married:
0.0% (0)Unmarried:
100.0% (52)
Women who did not give birth in the past 12 months Now married:
44.8% (281)Unmarried:
55.2% (346)
Marital status - Black or African American population 15 years and over
Males 32.6% Never married59.1% Now married0.0% Separated0.0% Widowed8.3% DivorcedFemales 0.0% Never married100.0% Now married0.0% Separated0.0% Widowed0.0% DivorcedMarital status - American Indian / Alaska Native population 15 years and over
Males 55.3% Never married36.7% Now married0.0% Separated0.0% Widowed8.0% DivorcedFemales 49.1% Never married21.0% Now married0.0% Separated18.2% Widowed11.7% DivorcedWomen who did not give birth in the past 12 months Now married:
34.7% (48)Unmarried:
65.3% (90)
Marital status - Asian population 15 years and over
Males 20.0% Never married0.0% Now married0.0% Separated0.0% Widowed80.0% DivorcedFemales 7.1% Never married92.9% Now married0.0% Separated0.0% Widowed0.0% DivorcedMarital status - Other race population 15 years and over
Males 48.3% Never married51.7% Now married0.0% Separated0.0% Widowed0.0% DivorcedFemales 0.0% Never married59.1% Now married0.0% Separated0.0% Widowed40.9% DivorcedWomen who gave birth in the past 12 months Now married:
100.0% (7)Unmarried:
0.0% (0)
Women who did not give birth in the past 12 months Now married:
100.0% (8)Unmarried:
0.0% (0)
Marital status - Two or more races population 15 years and over
Males 90.3% Never married0.0% Now married0.0% Separated9.7% Widowed0.0% DivorcedFemales 39.6% Never married52.8% Now married7.5% Separated0.0% Widowed0.0% DivorcedWomen who did not give birth in the past 12 months Now married:
51.2% (69)Unmarried:
48.8% (66)
Marital status - White alone, not Hispanic / Latino population 15 years and over
Males 27.5% Never married50.1% Now married1.8% Separated5.4% Widowed15.2% DivorcedFemales 18.5% Never married43.7% Now married1.9% Separated17.6% Widowed18.3% DivorcedWomen who gave birth in the past 12 months Now married:
0.0% (0)Unmarried:
100.0% (46)
Women who did not give birth in the past 12 months Now married:
43.0% (256)Unmarried:
57.0% (339)
Marital status - Hispanic or Latino population 15 years and over
Males 39.5% Never married52.6% Now married5.5% Separated0.0% Widowed2.4% DivorcedFemales 29.9% Never married44.2% Now married0.0% Separated18.4% Widowed7.5% DivorcedWomen who gave birth in the past 12 months Now married:
33.3% (6)Unmarried:
66.7% (12)
Women who did not give birth in the past 12 months Now married:
63.4% (108)Unmarried:
36.6% (62)
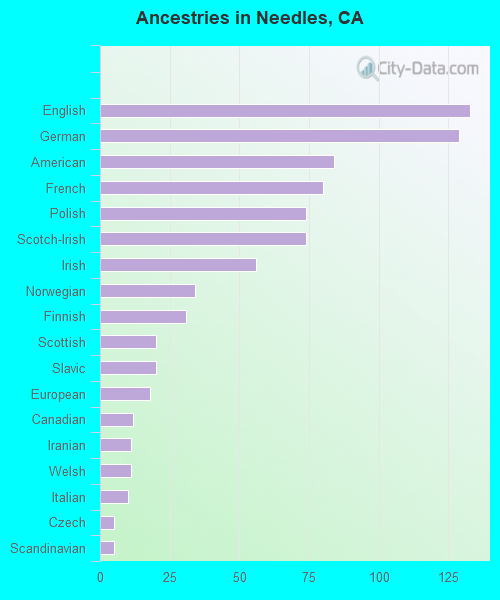
Ancestries in Needles
157 7.0% American152 6.8% English143 6.4% Irish78 3.5% German36 1.6% European33 1.5% Scotch-Irish28 1.2% Norwegian24 1.1% Scottish14 0.6% Polish13 0.6% Italian10 0.4% Swedish10 0.4% Welsh9 0.4% French9 0.4% Hungarian7 0.3% British4 0.2% Canadian
Children Nativity (place of birth) in Needles
Children under 6 years - Living with two parents Both parents native 43 100.0% NativeOne native, one foreign-born parent 7 100.0% NativeChildren under 6 years - Living with one parent Native parent 227 100.0% Native
Children 6 to 17 years - Living with two parents Both parents native 344 100.0% NativeOne native, one foreign-born parent 8 100.0% NativeChildren 6 to 17 years - Living with one parent Native parent 578 100.0% Native
Grandparents responsible for own grandchildren in Needles
Grandparents (30 to 59 years) White / Caucasian 23 71.8% Responsible for grandchildren9 28.2% Not responsible for grandchildrenAmerican Indian / Alaska Native 4 100.0% Not responsible for grandchildrenWhite alone, not Hispanic / Latino 16 62.5% Responsible for grandchildren10 37.5% Not responsible for grandchildrenHispanic or Latino 3 100.0% Not responsible for grandchildrenGrandparents (60 years and over) White / Caucasian 13 52.2% Responsible for grandchildren12 47.8% Not responsible for grandchildrenAmerican Indian / Alaska Native 11 75.2% Responsible for grandchildren4 24.8% Not responsible for grandchildrenWhite alone, not Hispanic / Latino 14 45.0% Responsible for grandchildren17 55.0% Not responsible for grandchildren