Races in Neenah, Wisconsin (WI) Detailed Stats
Data:
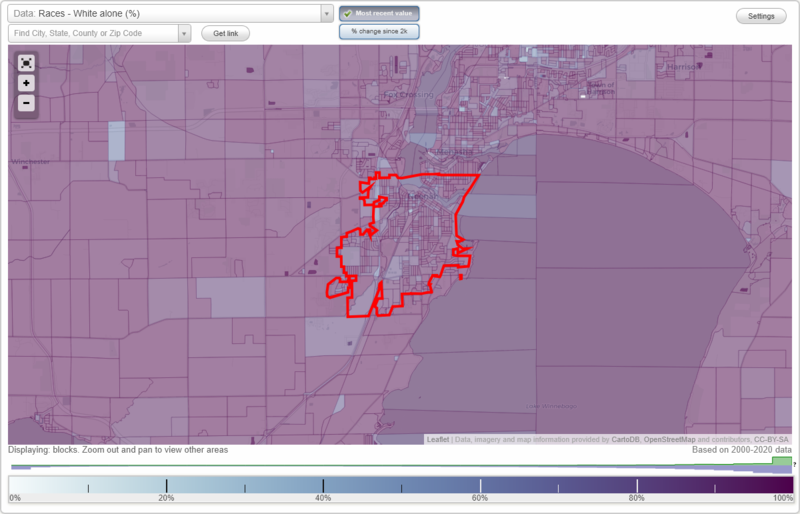
Races - White alone (%)
Races - White alone (% change since 2000)
Races - Black alone (%)
Races - Black alone (% change since 2000)
Races - American Indian alone (%)
Races - American Indian alone (% change since 2000)
Races - Asian alone (%)
Races - Asian alone (% change since 2000)
Races - Hispanic (%)
Races - Hispanic (% change since 2000)
Races - Native Hawaiian and Other Pacific Islander alone (%)
Races - Native Hawaiian and Other Pacific Islander alone (% change since 2000)
Races - Two or more races(%)
Races - Two or more races(% change since 2000)
Races - Other race alone (%)
Races - Other race alone (% change since 2000)
Racial diversity
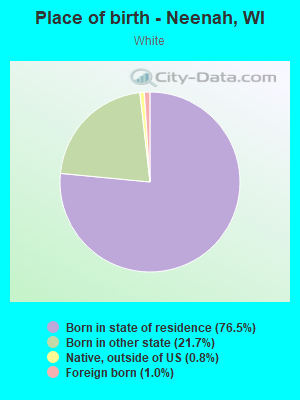
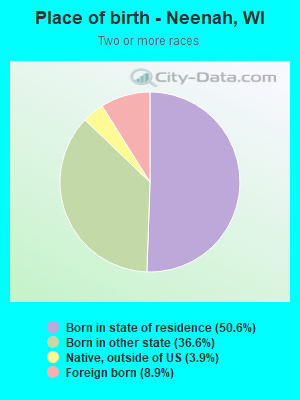
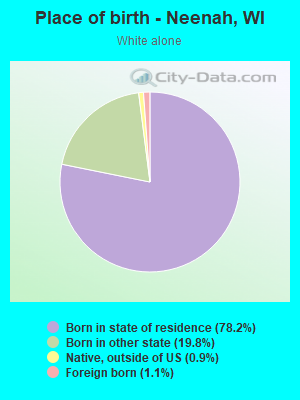
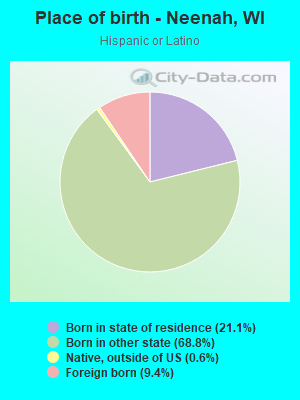
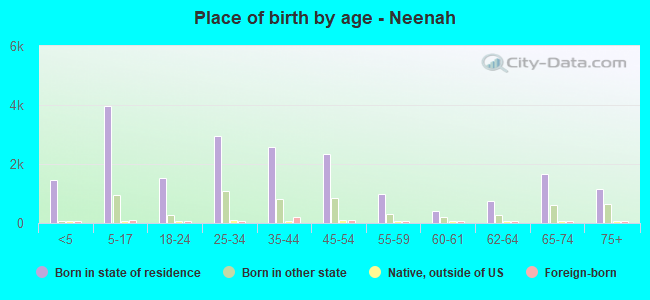
Place of birth - Born in state of residence (%)
Place of birth - Born in state of residence (%) - White
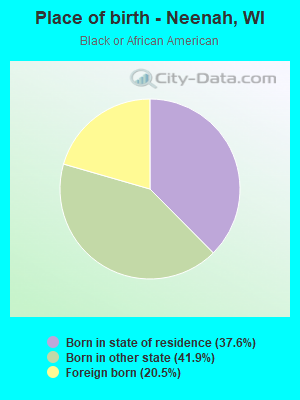
Place of birth - Born in state of residence (%) - Black or African American
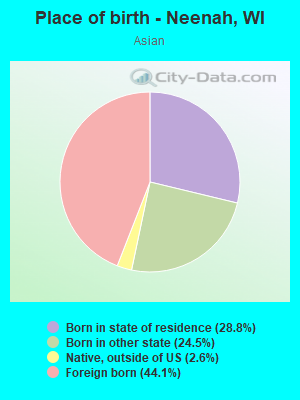
Place of birth - Born in state of residence (%) - Asian
Place of birth - Born in state of residence (%) - Hispanic or Latino
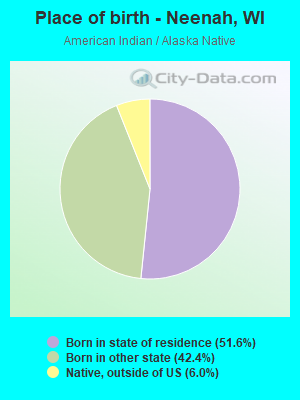
Place of birth - Born in state of residence (%) - American Indian and Alaska Native
Place of birth - Born in state of residence (%) - Multirace
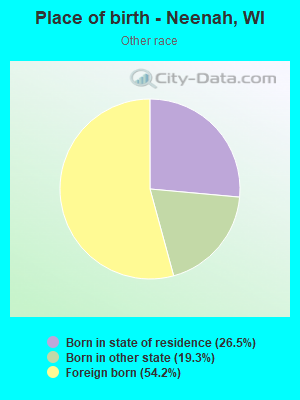
Place of birth - Born in state of residence (%) - Other Race
Place of birth - Born in other state (%)
Place of birth - Born in other state (%) - White
Place of birth - Born in other state (%) - Black or African American
Place of birth - Born in other state (%) - Asian
Place of birth - Born in other state (%) - Hispanic or Latino
Place of birth - Born in other state (%) - American Indian and Alaska Native
Place of birth - Born in other state (%) - Multirace
Place of birth - Born in other state (%) - Other Race
Place of birth - Native, outside of US (%)
Place of birth - Native, outside of US (%) - White
Place of birth - Native, outside of US (%) - Black or African American
Place of birth - Native, outside of US (%) - Asian
Place of birth - Native, outside of US (%) - Hispanic or Latino
Place of birth - Native, outside of US (%) - American Indian and Alaska Native
Place of birth - Native, outside of US (%) - Multirace
Place of birth - Native, outside of US (%) - Other Race
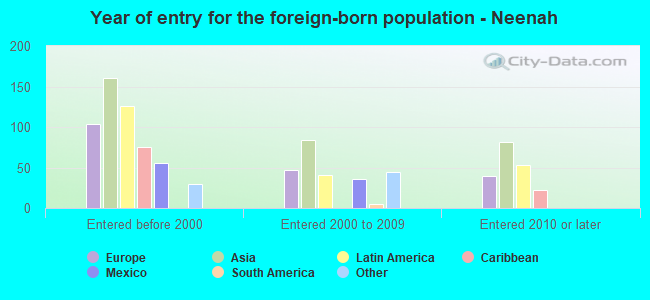
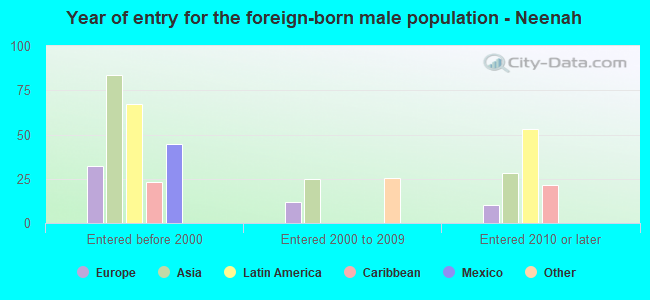
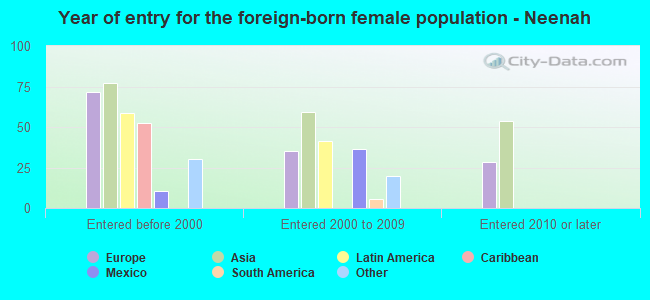
Place of birth - Foreign born (%)
Place of birth - Foreign born (%) - White
Place of birth - Foreign born (%) - Black or African American
Place of birth - Foreign born (%) - Asian
Place of birth - Foreign born (%) - Hispanic or Latino
Place of birth - Foreign born (%) - American Indian and Alaska Native
Place of birth - Foreign born (%) - Multirace
Place of birth - Foreign born (%) - Other Race
Residents speaking English at home (%)
Residents speaking English at home - Born in the United States (%)
Residents speaking English at home - Native, born elsewhere (%)
Residents speaking English at home - Foreign born (%)
Residents speaking Spanish at home (%)
Residents speaking Spanish at home - Born in the United States (%)
Residents speaking Spanish at home - Native, born elsewhere (%)
Residents speaking Spanish at home - Foreign born (%)
Residents speaking other language at home (%)
Residents speaking other language at home - Born in the United States (%)
Residents speaking other language at home - Native, born elsewhere (%)
Residents speaking other language at home - Foreign born (%)
Marital status - Never married (%)
Marital status - Now married (%)
Marital status - Separated (%)
Marital status - Widowed (%)
Marital status - Divorced (%)
Ancestries Reported - Arab (%)
Ancestries Reported - Czech (%)
Ancestries Reported - Danish (%)
Ancestries Reported - Dutch (%)
Ancestries Reported - English (%)
Ancestries Reported - French (%)
Ancestries Reported - French Canadian (%)
Ancestries Reported - German (%)
Ancestries Reported - Greek (%)
Ancestries Reported - Hungarian (%)
Ancestries Reported - Irish (%)
Ancestries Reported - Italian (%)
Ancestries Reported - Lithuanian (%)
Ancestries Reported - Norwegian (%)
Ancestries Reported - Polish (%)
Ancestries Reported - Portuguese (%)
Ancestries Reported - Russian (%)
Ancestries Reported - Scotch-Irish (%)
Ancestries Reported - Scottish (%)
Ancestries Reported - Slovak (%)
Ancestries Reported - Subsaharan African (%)
Ancestries Reported - Swedish (%)
Ancestries Reported - Swiss (%)
Ancestries Reported - Ukrainian (%)
Ancestries Reported - United States (%)
Ancestries Reported - Welsh (%)
Ancestries Reported - West Indian (%)
Ancestries Reported - Other (%)
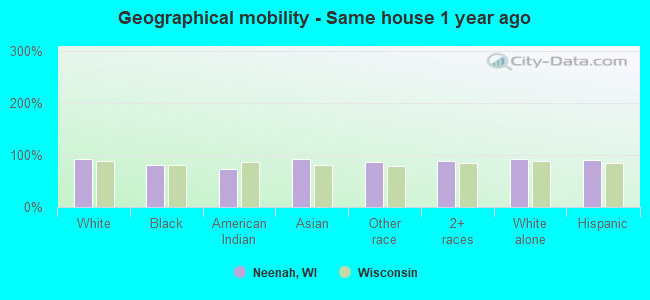
Geographical mobility - Same house 1 year ago (%)
Geographical mobility - Same house 1 year ago (%) - White
Geographical mobility - Same house 1 year ago (%) - Black or African American
Geographical mobility - Same house 1 year ago (%) - Asian
Geographical mobility - Same house 1 year ago (%) - Hispanic or Latino
Geographical mobility - Same house 1 year ago (%) - American Indian and Alaska Native
Geographical mobility - Same house 1 year ago (%) - Multirace
Geographical mobility - Same house 1 year ago (%) - Other Race
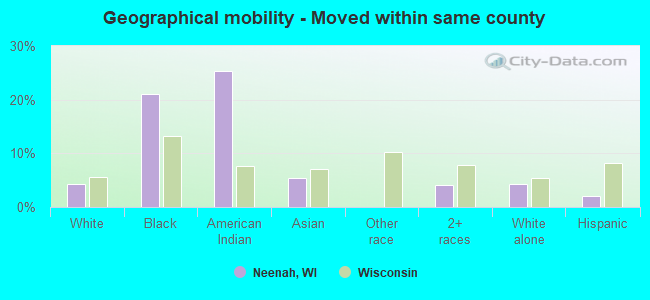
Geographical mobility - Moved within same county (%)
Geographical mobility - Moved within same county (%) - White
Geographical mobility - Moved within same county (%) - Black or African American
Geographical mobility - Moved within same county (%) - Asian
Geographical mobility - Moved within same county (%) - Hispanic or Latino
Geographical mobility - Moved within same county (%) - American Indian and Alaska Native
Geographical mobility - Moved within same county (%) - Multirace
Geographical mobility - Moved within same county (%) - Other Race
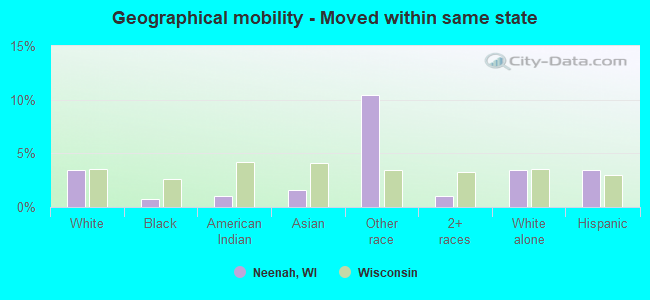
Geographical mobility - Moved from different county within same state (%)
Geographical mobility - Moved from different county within same state (%) - White
Geographical mobility - Moved from different county within same state (%) - Black or African American
Geographical mobility - Moved from different county within same state (%) - Asian
Geographical mobility - Moved from different county within same state (%) - Hispanic or Latino
Geographical mobility - Moved from different county within same state (%) - American Indian and Alaska Native
Geographical mobility - Moved from different county within same state (%) - Multirace
Geographical mobility - Moved from different county within same state (%) - Other Race
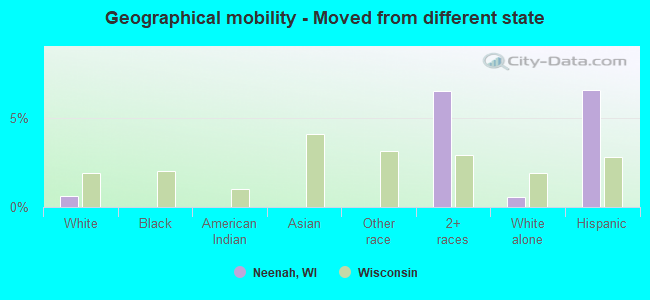
Geographical mobility - Moved from different state (%)
Geographical mobility - Moved from different state (%) - White
Geographical mobility - Moved from different state (%) - Black or African American
Geographical mobility - Moved from different state (%) - Asian
Geographical mobility - Moved from different state (%) - Hispanic or Latino
Geographical mobility - Moved from different state (%) - American Indian and Alaska Native
Geographical mobility - Moved from different state (%) - Multirace
Geographical mobility - Moved from different state (%) - Other Race
Geographical mobility - Moved from abroad (%)
Geographical mobility - Moved from abroad (%) - White
Geographical mobility - Moved from abroad (%) - Black or African American
Geographical mobility - Moved from abroad (%) - Asian
Geographical mobility - Moved from abroad (%) - Hispanic or Latino
Geographical mobility - Moved from abroad (%) - American Indian and Alaska Native
Geographical mobility - Moved from abroad (%) - Multirace
Geographical mobility - Moved from abroad (%) - Other Race
Place of birth for the foreign-born population - Ireland (%)
Place of birth for the foreign-born population - Denmark (%)
Place of birth for the foreign-born population - Norway (%)
Place of birth for the foreign-born population - Sweden (%)
Place of birth for the foreign-born population - United Kingdom (%)
Place of birth for the foreign-born population - England (%)
Place of birth for the foreign-born population - Scotland (%)
Place of birth for the foreign-born population - Other Northern Europe (%)
Place of birth for the foreign-born population - Austria (%)
Place of birth for the foreign-born population - Belgium (%)
Place of birth for the foreign-born population - France (%)
Place of birth for the foreign-born population - Germany (%)
Place of birth for the foreign-born population - Netherlands (%)
Place of birth for the foreign-born population - Switzerland (%)
Place of birth for the foreign-born population - Other Western Europe (%)
Place of birth for the foreign-born population - Greece (%)
Place of birth for the foreign-born population - Italy (%)
Place of birth for the foreign-born population - Portugal (%)
Place of birth for the foreign-born population - Spain (%)
Place of birth for the foreign-born population - Other Southern Europe (%)
Place of birth for the foreign-born population - Albania (%)
Place of birth for the foreign-born population - Belarus (%)
Place of birth for the foreign-born population - Bosnia and Herzegovina (%)
Place of birth for the foreign-born population - Bulgaria (%)
Place of birth for the foreign-born population - Croatia (%)
Place of birth for the foreign-born population - Czechoslovakia (%)
Place of birth for the foreign-born population - Hungary (%)
Place of birth for the foreign-born population - Latvia (%)
Place of birth for the foreign-born population - Lithuania (%)
Place of birth for the foreign-born population - North Macedonia (Macedonia) (%)
Place of birth for the foreign-born population - Moldova (%)
Place of birth for the foreign-born population - Poland (%)
Place of birth for the foreign-born population - Romania (%)
Place of birth for the foreign-born population - Russia (%)
Place of birth for the foreign-born population - Serbia (%)
Place of birth for the foreign-born population - Ukraine (%)
Place of birth for the foreign-born population - Other Eastern Europe (%)
Place of birth for the foreign-born population - China (%)
Place of birth for the foreign-born population - Hong Kong (%)
Place of birth for the foreign-born population - Taiwan (%)
Place of birth for the foreign-born population - Japan (%)
Place of birth for the foreign-born population - Korea (%)
Place of birth for the foreign-born population - Other Eastern Asia (%)
Place of birth for the foreign-born population - Afghanistan (%)
Place of birth for the foreign-born population - Bangladesh (%)
Place of birth for the foreign-born population - India (%)
Place of birth for the foreign-born population - Iran (%)
Place of birth for the foreign-born population - Kazakhstan (%)
Place of birth for the foreign-born population - Nepal (%)
Place of birth for the foreign-born population - Pakistan (%)
Place of birth for the foreign-born population - Sri Lanka (%)
Place of birth for the foreign-born population - Uzbekistan (%)
Place of birth for the foreign-born population - Other South Central Asia (%)
Place of birth for the foreign-born population - Burma (%)
Place of birth for the foreign-born population - Cambodia (%)
Place of birth for the foreign-born population - Indonesia (%)
Place of birth for the foreign-born population - Laos (%)
Place of birth for the foreign-born population - Malaysia (%)
Place of birth for the foreign-born population - Philippines (%)
Place of birth for the foreign-born population - Singapore (%)
Place of birth for the foreign-born population - Thailand (%)
Place of birth for the foreign-born population - Vietnam (%)
Place of birth for the foreign-born population - Other South Eastern Asia (%)
Place of birth for the foreign-born population - Armenia (%)
Place of birth for the foreign-born population - Iraq (%)
Place of birth for the foreign-born population - Israel (%)
Place of birth for the foreign-born population - Jordan (%)
Place of birth for the foreign-born population - Kuwait (%)
Place of birth for the foreign-born population - Lebanon (%)
Place of birth for the foreign-born population - Saudi Arabia (%)
Place of birth for the foreign-born population - Syria (%)
Place of birth for the foreign-born population - Turkey (%)
Place of birth for the foreign-born population - Yemen (%)
Place of birth for the foreign-born population - Other Western Asia (%)
Place of birth for the foreign-born population - Eritrea (%)
Place of birth for the foreign-born population - Ethiopia (%)
Place of birth for the foreign-born population - Kenya (%)
Place of birth for the foreign-born population - Somalia (%)
Place of birth for the foreign-born population - Uganda (%)
Place of birth for the foreign-born population - Zimbabwe (%)
Place of birth for the foreign-born population - Other Eastern Africa (%)
Place of birth for the foreign-born population - Cameroon (%)
Place of birth for the foreign-born population - Congo (%)
Place of birth for the foreign-born population - Democratic Republic of Congo (Zaire) (%)
Place of birth for the foreign-born population - Other Middle Africa (%)
Place of birth for the foreign-born population - Egypt (%)
Place of birth for the foreign-born population - Morocco (%)
Place of birth for the foreign-born population - Sudan (%)
Place of birth for the foreign-born population - Other Northern Africa (%)
Place of birth for the foreign-born population - South Africa (%)
Place of birth for the foreign-born population - Other Southern Africa (%)
Place of birth for the foreign-born population - Cabo Verde (%)
Place of birth for the foreign-born population - Ghana (%)
Place of birth for the foreign-born population - Liberia (%)
Place of birth for the foreign-born population - Nigeria (%)
Place of birth for the foreign-born population - Senegal (%)
Place of birth for the foreign-born population - Sierra Leone (%)
Place of birth for the foreign-born population - Other Western Africa (%)
Place of birth for the foreign-born population - Australia (%)
Place of birth for the foreign-born population - New Zealand (%)
Place of birth for the foreign-born population - Fiji (%)
Place of birth for the foreign-born population - Micronesia (%)
Place of birth for the foreign-born population - Bahamas (%)
Place of birth for the foreign-born population - Barbados (%)
Place of birth for the foreign-born population - Cuba (%)
Place of birth for the foreign-born population - Dominica (%)
Place of birth for the foreign-born population - Dominican Republic (%)
Place of birth for the foreign-born population - Grenada (%)
Place of birth for the foreign-born population - Haiti (%)
Place of birth for the foreign-born population - Jamaica (%)
Place of birth for the foreign-born population - St. Vincent and the Grenadines (%)
Place of birth for the foreign-born population - Trinidad and Tobago (%)
Place of birth for the foreign-born population - West Indies (%)
Place of birth for the foreign-born population - Other Caribbean (%)
Place of birth for the foreign-born population - Belize (%)
Place of birth for the foreign-born population - Costa Rica (%)
Place of birth for the foreign-born population - El Salvador (%)
Place of birth for the foreign-born population - Guatemala (%)
Place of birth for the foreign-born population - Honduras (%)
Place of birth for the foreign-born population - Mexico (%)
Place of birth for the foreign-born population - Nicaragua (%)
Place of birth for the foreign-born population - Panama (%)
Place of birth for the foreign-born population - Other Central America (%)
Place of birth for the foreign-born population - Argentina (%)
Place of birth for the foreign-born population - Bolivia (%)
Place of birth for the foreign-born population - Brazil (%)
Place of birth for the foreign-born population - Chile (%)
Place of birth for the foreign-born population - Colombia (%)
Place of birth for the foreign-born population - Ecuador (%)
Place of birth for the foreign-born population - Guyana (%)
Place of birth for the foreign-born population - Peru (%)
Place of birth for the foreign-born population - Uruguay (%)
Place of birth for the foreign-born population - Venezuela (%)
Place of birth for the foreign-born population - Other South America (%)
Place of birth for the foreign-born population - Canada (%)
Place of birth for the foreign-born population - Other Northern America (%)
Place of birth for the foreign-born population - Other (%)
Latest news about races in Neenah, WI collected exclusively by city-data.com from local newspapers, TV, and radio stations
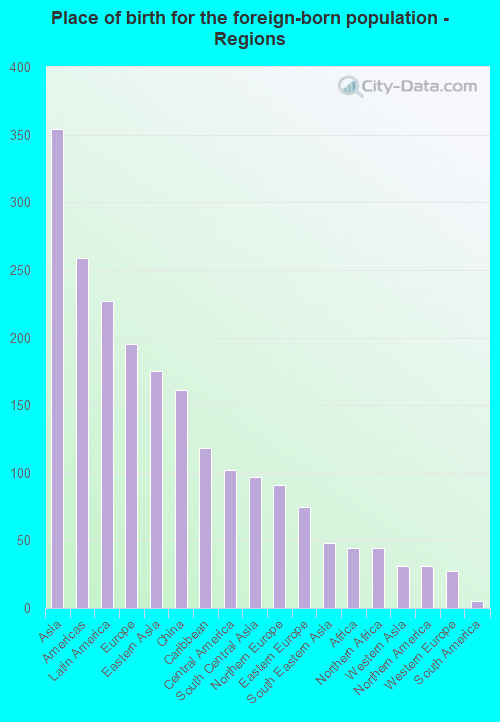
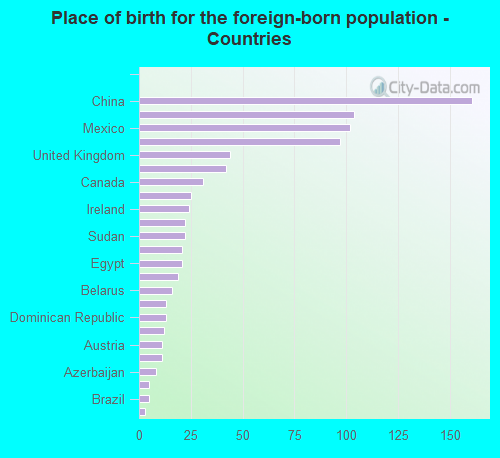
According to 2022 data, the most numerous races in Neenah, WI are White alone (23,278 residents), Hispanic (1,457 residents), and Black alone (735 residents). 95.5% of Neenah residents speak English at home. 3.1% of Neenah, WI residents are foreign-born (1.3% born in Asia, 0.8% born in Latin America, 0.7% born in Europe), which is 59.4% less than the foreign-born rate of 5.0% across the entire state of Wisconsin.
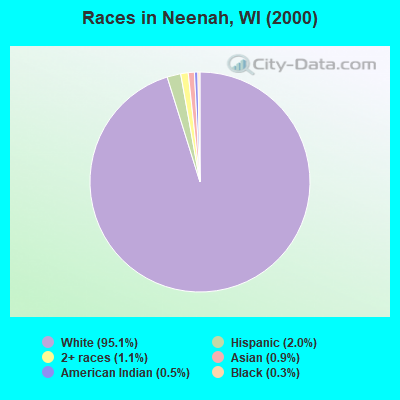
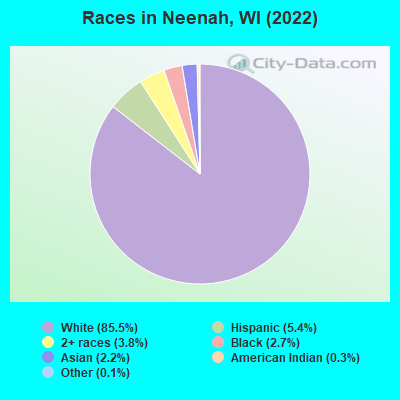
Race distribution in Neenah
2000 2022
4,681,630 87.3% White alone 300,245 5.6% Black alone 192,921 3.6% Hispanic 87,995 1.6% Asian alone 51,921 1.0% Two or more races 43,980 0.8% American Indian alone 3,637 0.07% Other race alone 1,346 0.03% Native Hawaiian and Other
4,654,031 79.0% White alone 447,022 7.6% Hispanic 345,678 5.9% Black alone 217,532 3.7% Two or more races 172,242 2.9% Asian alone 33,762 0.6% American Indian alone 19,680 0.3% Other race alone 2,592 0.04% Native Hawaiian and Other
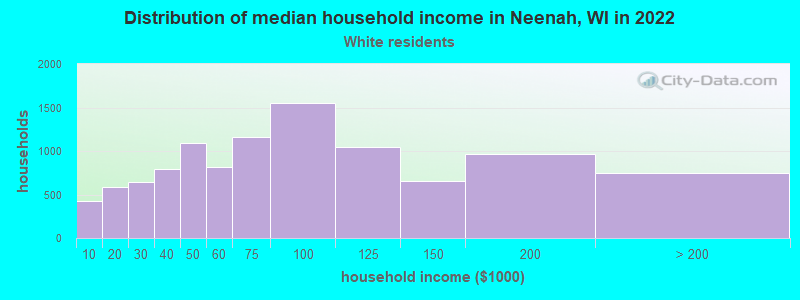
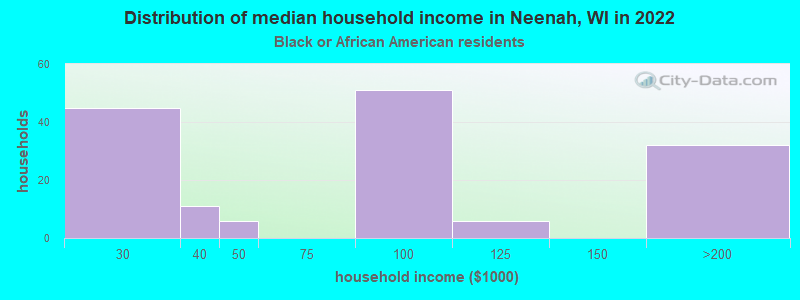
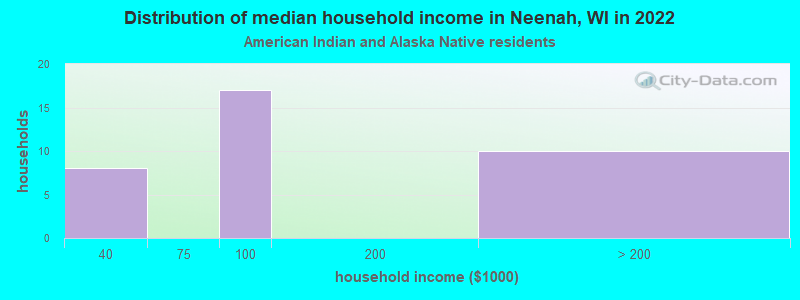
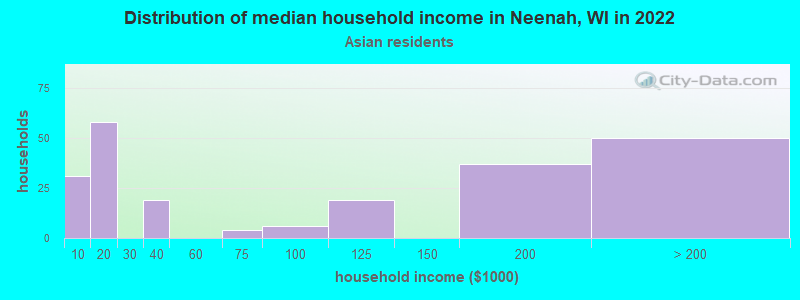
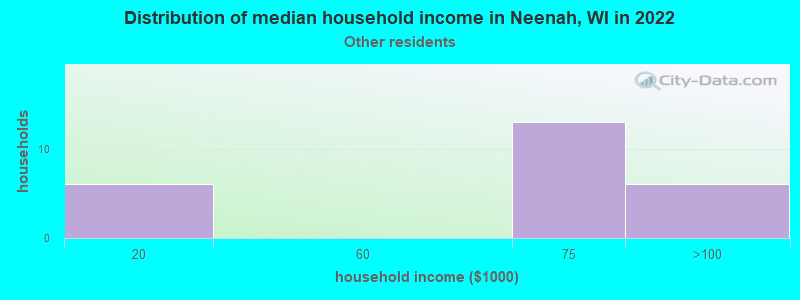
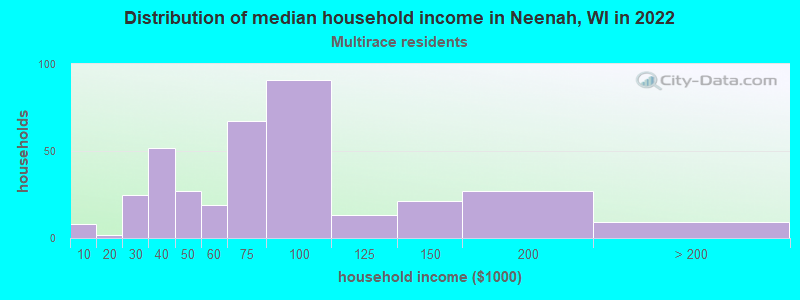
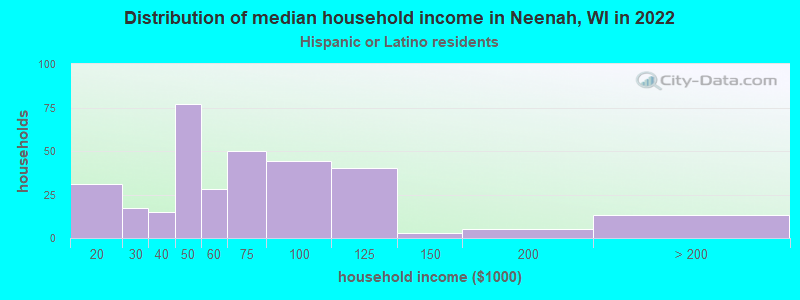
Income and house value in Neenah Median household income in 2022 $70,798 White non-Hispanic householders$173,486 Black householders$97,679 American Indian and Alaska Native householders$100,240 Some other race householders$78,992 Two or more races householders$54,438 Hispanic or Latino race householdersMedian 2022 house value $190,650 White Non-Hispanic householders$92,151 Black or African American householders$146,827 American Indian or Alaska Native householders $261,709 Asian householders$174,063 Some other race householders$138,636 Two or more races householders$153,585 Hispanic or Latino householders
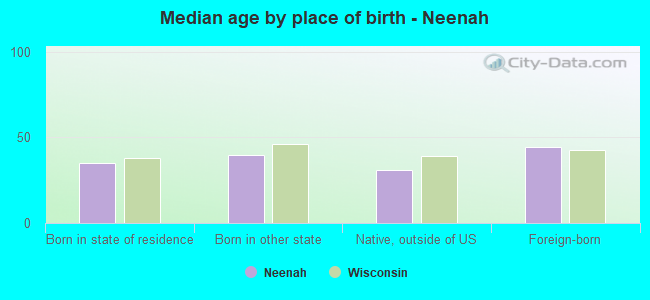
Median age by race in Neenah
39.1 Median age for White residents37.8 40.3 18.3 Median age for Black or African American residents19.2 20.4 35.6 Median age for American Indian / Alaska Native residents32.9 21.1 38.5 Median age for Asian residents30.5 42.3 -825,688,072.6 Median age for Native Hawaiian / Pacific Islander residents-666,666,666.0 -666,666,666.0 47.0 Median age for Other race residents38.2 -654,970,759.6 22.5 Median age for Two or more races residents15.8 24.5 39.6 Median age for White alone residents38.9 40.4 19.2 Median age for Hispanic or Latino residents18.0 26.7
Owner/renter occupied households by race in Neenah
House owners and renters - White residents 6,896 65.6% Owner occupied3,624 34.4% Renter occupiedHouse owners and renters - Black or African American residents 56 46.0% Owner occupied66 54.0% Renter occupiedHouse owners and renters - American Indian / Alaska Native residents 24 70.9% Owner occupied10 29.1% Renter occupiedHouse owners and renters - Asian residents 107 41.6% Owner occupied150 58.4% Renter occupiedHouse owners and renters - Other race residents 16 57.3% Owner occupied12 42.7% Renter occupiedHouse owners and renters - Two or more races residents 154 44.0% Owner occupied196 56.0% Renter occupiedHouse owners and renters - White alone residents 6,824 65.3% Owner occupied3,621 34.7% Renter occupiedHouse owners and renters - Hispanic or Latino residents 156 43.1% Owner occupied206 56.9% Renter occupied
Language usage in Neenah
English speakers - Total 95.5% of residents of Neenah speak English at home.
2.4% of residents speak Spanish at home 324 51.8% Speak English very well301 48.2% Speak English less than very well2.9% of residents speak other language at home 574 76.0% Speak English very well181 24.0% Speak English less than very well
English speakers - Born in the United States 92.2% of residents of Neenah speak English at home.
4.5% of residents speak Spanish at home 76 27.0% Speak English very well205 73.0% Speak English less than very well3.8% of residents speak other language at home 237 100.0% Speak English very well
English speakers - Native, born elsewhere 76.4% of residents of Neenah speak English at home.
2.0% of residents speak Spanish at home 10 100.0% Speak English less than very well6.3% of residents speak other language at home 31 100.0% Speak English very well
English speakers - Foreign-born 53.9% of residents of Neenah speak English at home.
16.5% of residents speak Spanish at home 83 63.4% Speak English very well48 36.6% Speak English less than very well43.8% of residents speak other language at home 199 57.2% Speak English very well149 42.8% Speak English less than very well
White (Caucasian) - Speak only English Native:
99.0% (22,218)Foreign-born:
100.0% (228)
White (Caucasian) - Speak another language Native:
0.9% (202)Foreign-born:
18.3% (42)
Black or African American - Speak only English Native:
74.2% (500)Foreign-born:
11.2% (21)
Black or African American - Speak another language Native:
17.1% (115)Foreign-born:
99.6% (183)
Asian - Speak only English Native:
97.3% (354)Foreign-born:
76.9% (193)
Asian - Speak another language Native:
30.6% (111)Foreign-born:
54.4% (136)
Other race - Speak only English Native:
49.9% (17)Foreign-born:
47.6% (19)
Other race - Speak another language Native:
45.7% (15)Foreign-born:
57.1% (23)
Two or more races - Speak only English Native:
76.9% (1,002)Foreign-born:
27.6% (37)
Two or more races - Speak another language Native:
28.5% (371)Foreign-born:
80.3% (108)
White alone - Speak only English Native:
99.1% (21,633)Foreign-born:
100.0% (251)
White alone - Speak another language Native:
0.9% (187)Foreign-born:
14.1% (36)
Hispanic or Latino - Speak only English Native:
77.4% (925)Foreign-born:
15.9% (25)
Hispanic or Latino - Speak another language Native:
22.5% (269)Foreign-born:
93.0% (146)
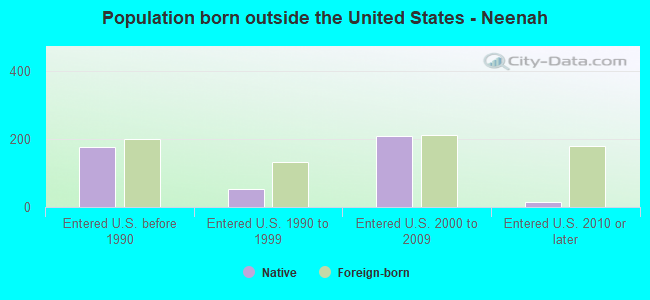
Foreign-born residents in Neenah 854 residents are foreign born (1.3% Asia , 0.8% Latin America , 0.7% Europe ).
This city:
3.1%Wisconsin:
5.0%
Marital status for residents in Neenah Marital status - White (Caucasian) population 15 years and over
Males 37.5% Never married49.2% Now married0.4% Separated2.1% Widowed10.9% DivorcedFemales 29.0% Never married46.8% Now married0.5% Separated8.2% Widowed15.4% DivorcedWomen who gave birth in the past 12 months Now married:
83.1% (266)Unmarried:
16.9% (54)
Women who did not give birth in the past 12 months Now married:
39.8% (2,001)Unmarried:
60.2% (3,027)
Marital status - Black or African American population 15 years and over
Males 45.5% Never married54.1% Now married0.0% Separated0.0% Widowed0.4% DivorcedFemales 52.8% Never married32.6% Now married0.0% Separated14.5% Widowed0.0% DivorcedWomen who did not give birth in the past 12 months Now married:
40.7% (89)Unmarried:
59.3% (129)
Marital status - American Indian / Alaska Native population 15 years and over
Males 48.3% Never married51.7% Now married0.0% Separated0.0% Widowed0.0% DivorcedFemales 32.1% Never married53.6% Now married0.0% Separated3.6% Widowed10.7% DivorcedWomen who did not give birth in the past 12 months Now married:
57.1% (11)Unmarried:
42.9% (9)
Marital status - Asian population 15 years and over
Males 38.6% Never married54.8% Now married2.9% Separated0.0% Widowed3.8% DivorcedFemales 39.9% Never married51.8% Now married0.0% Separated3.6% Widowed4.7% DivorcedWomen who did not give birth in the past 12 months Now married:
52.2% (94)Unmarried:
47.8% (86)
Marital status - Other race population 15 years and over
Males 60.7% Never married39.3% Now married0.0% Separated0.0% Widowed0.0% DivorcedFemales 0.0% Never married42.9% Now married0.0% Separated0.0% Widowed57.1% DivorcedMarital status - Two or more races population 15 years and over
Males 55.8% Never married33.3% Now married7.1% Separated0.0% Widowed3.8% DivorcedFemales 70.0% Never married21.9% Now married4.5% Separated0.7% Widowed2.9% DivorcedWomen who did not give birth in the past 12 months Now married:
16.3% (91)Unmarried:
83.7% (466)
Marital status - White alone, not Hispanic / Latino population 15 years and over
Males 37.0% Never married49.6% Now married0.4% Separated2.1% Widowed10.9% DivorcedFemales 28.6% Never married47.5% Now married0.4% Separated8.3% Widowed15.1% DivorcedWomen who gave birth in the past 12 months Now married:
83.1% (272)Unmarried:
16.9% (55)
Women who did not give birth in the past 12 months Now married:
40.5% (1,989)Unmarried:
59.5% (2,920)
Marital status - Hispanic or Latino population 15 years and over
Males 58.8% Never married36.0% Now married0.0% Separated0.0% Widowed5.2% DivorcedFemales 57.9% Never married17.9% Now married5.0% Separated2.9% Widowed16.2% DivorcedWomen who did not give birth in the past 12 months Now married:
23.5% (100)Unmarried:
76.5% (326)
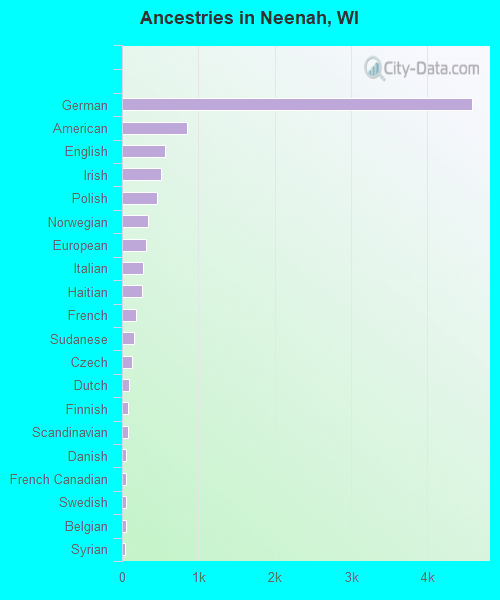
Ancestries in Neenah
4,578 39.2% German851 7.3% American569 4.9% English517 4.4% Irish457 3.9% Polish334 2.9% Norwegian319 2.7% European273 2.3% Italian262 2.2% Haitian184 1.6% French151 1.3% Sudanese127 1.1% Czech96 0.8% Dutch81 0.7% Finnish77 0.7% Scandinavian54 0.5% Danish52 0.4% French Canadian49 0.4% Swedish46 0.4% Belgian43 0.4% Syrian40 0.3% Russian31 0.3% British28 0.2% Scottish25 0.2% Austrian23 0.2% Slavic23 0.2% Swiss19 0.2% Hungarian19 0.2% Eastern European13 0.1% Cajun12 0.1% Northern European10 0.09% Iranian10 0.09% Welsh8 0.07% Czechoslovakian8 0.07% Greek6 0.05% Brazilian5 0.04% Scotch-Irish5 0.04% Slovene
Children Nativity (place of birth) in Neenah
Children under 6 years - Living with two parents Both parents native 1,361 100.0% NativeBoth parents foreign-born 47 100.0% NativeOne native, one foreign-born parent 64 100.0% NativeChildren under 6 years - Living with one parent Native parent 462 100.0% NativeForeign-born parent 43 92.2% Native4 7.8% Foreign-bornChildren 6 to 17 years - Living with two parents Both parents native 2,386 98.3% Native42 1.7% Foreign-bornBoth parents foreign-born 326 92.7% Native26 7.3% Foreign-bornOne native, one foreign-born parent 87 100.0% NativeChildren 6 to 17 years - Living with one parent Native parent 1,592 100.0% NativeForeign-born parent 57 48.4% Native61 51.6% Foreign-born
Grandparents responsible for own grandchildren in Neenah
Grandparents (30 to 59 years) White / Caucasian 43 32.7% Responsible for grandchildren88 67.3% Not responsible for grandchildrenTwo or more races 30 100.0% Not responsible for grandchildrenWhite alone, not Hispanic / Latino 45 34.5% Responsible for grandchildren85 65.5% Not responsible for grandchildrenHispanic or Latino 24 100.0% Not responsible for grandchildrenGrandparents (60 years and over) White / Caucasian 65 36.5% Responsible for grandchildren113 63.5% Not responsible for grandchildrenWhite alone, not Hispanic / Latino 66 40.1% Responsible for grandchildren98 59.9% Not responsible for grandchildrenHispanic or Latino 13 100.0% Not responsible for grandchildren