Races in Neosho, Missouri (MO) Detailed Stats
Data:
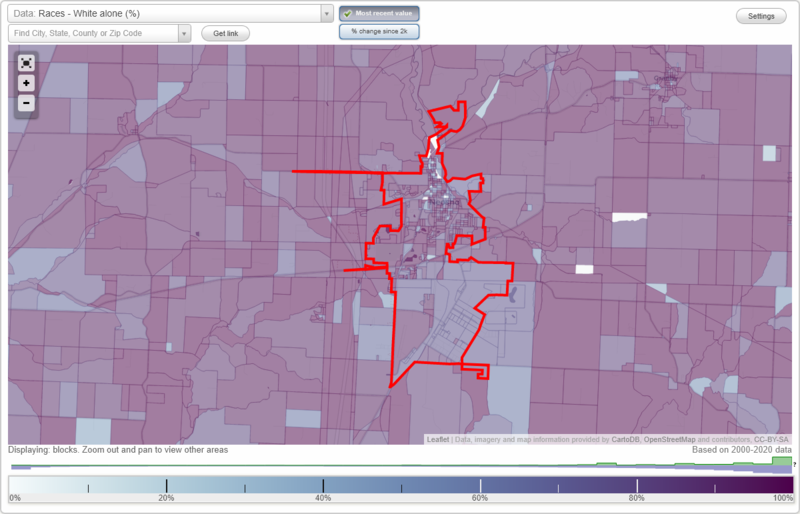
Races - White alone (%)
Races - White alone (% change since 2000)
Races - Black alone (%)
Races - Black alone (% change since 2000)
Races - American Indian alone (%)
Races - American Indian alone (% change since 2000)
Races - Asian alone (%)
Races - Asian alone (% change since 2000)
Races - Hispanic (%)
Races - Hispanic (% change since 2000)
Races - Native Hawaiian and Other Pacific Islander alone (%)
Races - Native Hawaiian and Other Pacific Islander alone (% change since 2000)
Races - Two or more races(%)
Races - Two or more races(% change since 2000)
Races - Other race alone (%)
Races - Other race alone (% change since 2000)
Racial diversity
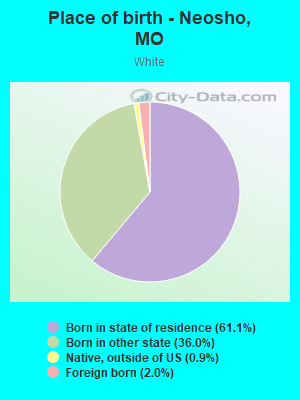
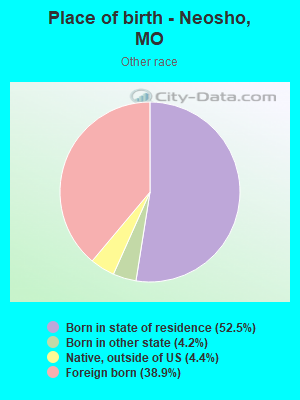
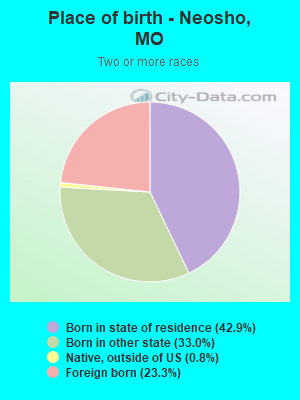
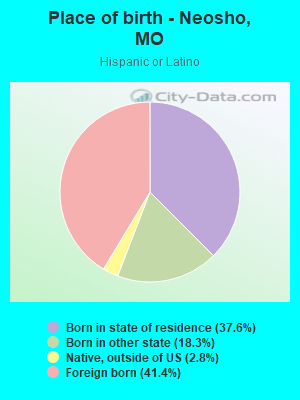
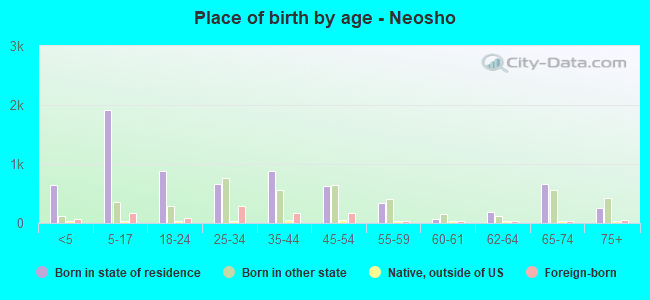
Place of birth - Born in state of residence (%)
Place of birth - Born in state of residence (%) - White
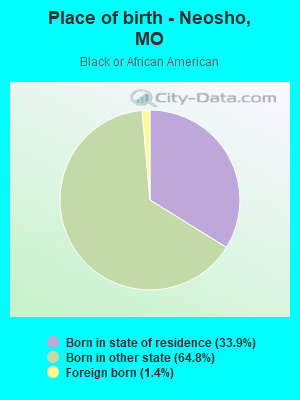
Place of birth - Born in state of residence (%) - Black or African American
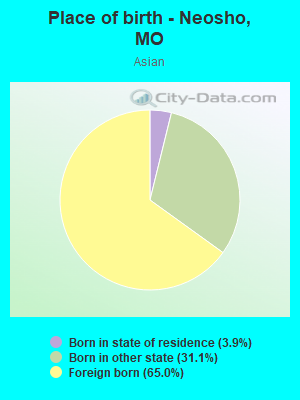
Place of birth - Born in state of residence (%) - Asian
Place of birth - Born in state of residence (%) - Hispanic or Latino
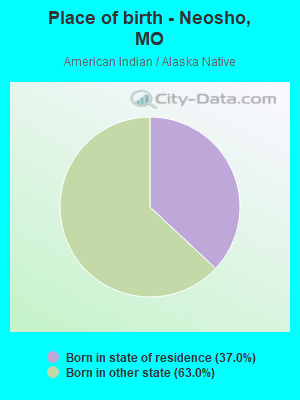
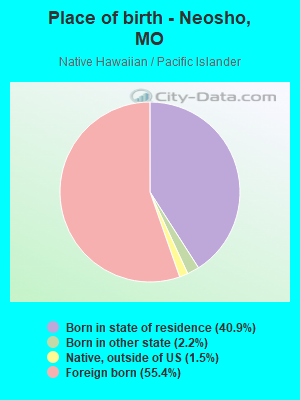
Place of birth - Born in state of residence (%) - American Indian and Alaska Native
Place of birth - Born in state of residence (%) - Multirace
Place of birth - Born in state of residence (%) - Other Race
Place of birth - Born in other state (%)
Place of birth - Born in other state (%) - White
Place of birth - Born in other state (%) - Black or African American
Place of birth - Born in other state (%) - Asian
Place of birth - Born in other state (%) - Hispanic or Latino
Place of birth - Born in other state (%) - American Indian and Alaska Native
Place of birth - Born in other state (%) - Multirace
Place of birth - Born in other state (%) - Other Race
Place of birth - Native, outside of US (%)
Place of birth - Native, outside of US (%) - White
Place of birth - Native, outside of US (%) - Black or African American
Place of birth - Native, outside of US (%) - Asian
Place of birth - Native, outside of US (%) - Hispanic or Latino
Place of birth - Native, outside of US (%) - American Indian and Alaska Native
Place of birth - Native, outside of US (%) - Multirace
Place of birth - Native, outside of US (%) - Other Race
Place of birth - Foreign born (%)
Place of birth - Foreign born (%) - White
Place of birth - Foreign born (%) - Black or African American
Place of birth - Foreign born (%) - Asian
Place of birth - Foreign born (%) - Hispanic or Latino
Place of birth - Foreign born (%) - American Indian and Alaska Native
Place of birth - Foreign born (%) - Multirace
Place of birth - Foreign born (%) - Other Race
Residents speaking English at home (%)
Residents speaking English at home - Born in the United States (%)
Residents speaking English at home - Native, born elsewhere (%)
Residents speaking English at home - Foreign born (%)
Residents speaking Spanish at home (%)
Residents speaking Spanish at home - Born in the United States (%)
Residents speaking Spanish at home - Native, born elsewhere (%)
Residents speaking Spanish at home - Foreign born (%)
Residents speaking other language at home (%)
Residents speaking other language at home - Born in the United States (%)
Residents speaking other language at home - Native, born elsewhere (%)
Residents speaking other language at home - Foreign born (%)
Marital status - Never married (%)
Marital status - Now married (%)
Marital status - Separated (%)
Marital status - Widowed (%)
Marital status - Divorced (%)
Ancestries Reported - Arab (%)
Ancestries Reported - Czech (%)
Ancestries Reported - Danish (%)
Ancestries Reported - Dutch (%)
Ancestries Reported - English (%)
Ancestries Reported - French (%)
Ancestries Reported - French Canadian (%)
Ancestries Reported - German (%)
Ancestries Reported - Greek (%)
Ancestries Reported - Hungarian (%)
Ancestries Reported - Irish (%)
Ancestries Reported - Italian (%)
Ancestries Reported - Lithuanian (%)
Ancestries Reported - Norwegian (%)
Ancestries Reported - Polish (%)
Ancestries Reported - Portuguese (%)
Ancestries Reported - Russian (%)
Ancestries Reported - Scotch-Irish (%)
Ancestries Reported - Scottish (%)
Ancestries Reported - Slovak (%)
Ancestries Reported - Subsaharan African (%)
Ancestries Reported - Swedish (%)
Ancestries Reported - Swiss (%)
Ancestries Reported - Ukrainian (%)
Ancestries Reported - United States (%)
Ancestries Reported - Welsh (%)
Ancestries Reported - West Indian (%)
Ancestries Reported - Other (%)
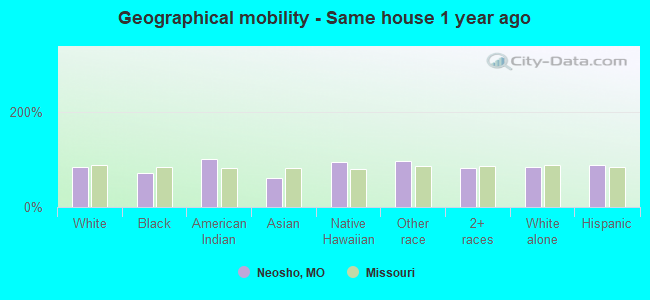
Geographical mobility - Same house 1 year ago (%)
Geographical mobility - Same house 1 year ago (%) - White
Geographical mobility - Same house 1 year ago (%) - Black or African American
Geographical mobility - Same house 1 year ago (%) - Asian
Geographical mobility - Same house 1 year ago (%) - Hispanic or Latino
Geographical mobility - Same house 1 year ago (%) - American Indian and Alaska Native
Geographical mobility - Same house 1 year ago (%) - Multirace
Geographical mobility - Same house 1 year ago (%) - Other Race
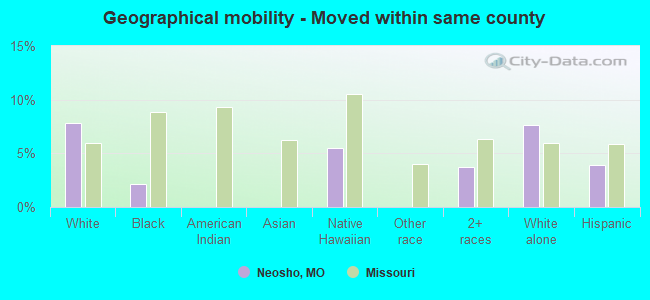
Geographical mobility - Moved within same county (%)
Geographical mobility - Moved within same county (%) - White
Geographical mobility - Moved within same county (%) - Black or African American
Geographical mobility - Moved within same county (%) - Asian
Geographical mobility - Moved within same county (%) - Hispanic or Latino
Geographical mobility - Moved within same county (%) - American Indian and Alaska Native
Geographical mobility - Moved within same county (%) - Multirace
Geographical mobility - Moved within same county (%) - Other Race
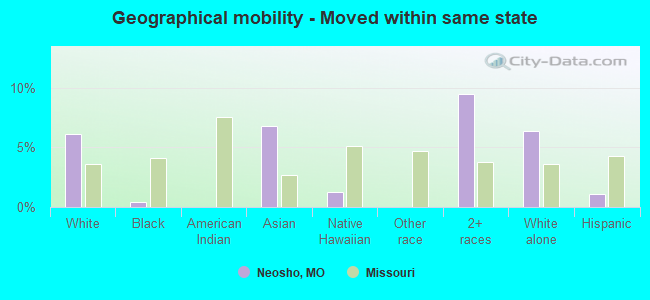
Geographical mobility - Moved from different county within same state (%)
Geographical mobility - Moved from different county within same state (%) - White
Geographical mobility - Moved from different county within same state (%) - Black or African American
Geographical mobility - Moved from different county within same state (%) - Asian
Geographical mobility - Moved from different county within same state (%) - Hispanic or Latino
Geographical mobility - Moved from different county within same state (%) - American Indian and Alaska Native
Geographical mobility - Moved from different county within same state (%) - Multirace
Geographical mobility - Moved from different county within same state (%) - Other Race
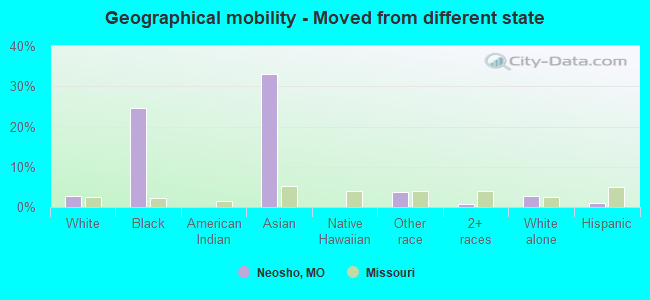
Geographical mobility - Moved from different state (%)
Geographical mobility - Moved from different state (%) - White
Geographical mobility - Moved from different state (%) - Black or African American
Geographical mobility - Moved from different state (%) - Asian
Geographical mobility - Moved from different state (%) - Hispanic or Latino
Geographical mobility - Moved from different state (%) - American Indian and Alaska Native
Geographical mobility - Moved from different state (%) - Multirace
Geographical mobility - Moved from different state (%) - Other Race
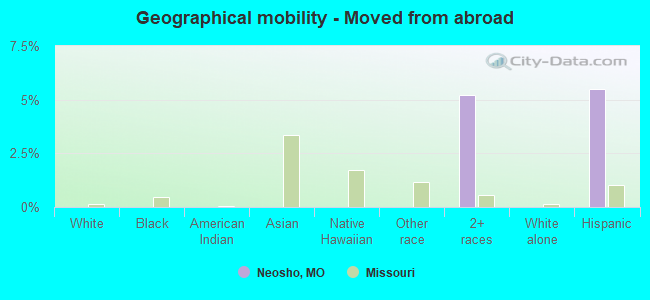
Geographical mobility - Moved from abroad (%)
Geographical mobility - Moved from abroad (%) - White
Geographical mobility - Moved from abroad (%) - Black or African American
Geographical mobility - Moved from abroad (%) - Asian
Geographical mobility - Moved from abroad (%) - Hispanic or Latino
Geographical mobility - Moved from abroad (%) - American Indian and Alaska Native
Geographical mobility - Moved from abroad (%) - Multirace
Geographical mobility - Moved from abroad (%) - Other Race
Place of birth for the foreign-born population - Ireland (%)
Place of birth for the foreign-born population - Denmark (%)
Place of birth for the foreign-born population - Norway (%)
Place of birth for the foreign-born population - Sweden (%)
Place of birth for the foreign-born population - United Kingdom (%)
Place of birth for the foreign-born population - England (%)
Place of birth for the foreign-born population - Scotland (%)
Place of birth for the foreign-born population - Other Northern Europe (%)
Place of birth for the foreign-born population - Austria (%)
Place of birth for the foreign-born population - Belgium (%)
Place of birth for the foreign-born population - France (%)
Place of birth for the foreign-born population - Germany (%)
Place of birth for the foreign-born population - Netherlands (%)
Place of birth for the foreign-born population - Switzerland (%)
Place of birth for the foreign-born population - Other Western Europe (%)
Place of birth for the foreign-born population - Greece (%)
Place of birth for the foreign-born population - Italy (%)
Place of birth for the foreign-born population - Portugal (%)
Place of birth for the foreign-born population - Spain (%)
Place of birth for the foreign-born population - Other Southern Europe (%)
Place of birth for the foreign-born population - Albania (%)
Place of birth for the foreign-born population - Belarus (%)
Place of birth for the foreign-born population - Bosnia and Herzegovina (%)
Place of birth for the foreign-born population - Bulgaria (%)
Place of birth for the foreign-born population - Croatia (%)
Place of birth for the foreign-born population - Czechoslovakia (%)
Place of birth for the foreign-born population - Hungary (%)
Place of birth for the foreign-born population - Latvia (%)
Place of birth for the foreign-born population - Lithuania (%)
Place of birth for the foreign-born population - North Macedonia (Macedonia) (%)
Place of birth for the foreign-born population - Moldova (%)
Place of birth for the foreign-born population - Poland (%)
Place of birth for the foreign-born population - Romania (%)
Place of birth for the foreign-born population - Russia (%)
Place of birth for the foreign-born population - Serbia (%)
Place of birth for the foreign-born population - Ukraine (%)
Place of birth for the foreign-born population - Other Eastern Europe (%)
Place of birth for the foreign-born population - China (%)
Place of birth for the foreign-born population - Hong Kong (%)
Place of birth for the foreign-born population - Taiwan (%)
Place of birth for the foreign-born population - Japan (%)
Place of birth for the foreign-born population - Korea (%)
Place of birth for the foreign-born population - Other Eastern Asia (%)
Place of birth for the foreign-born population - Afghanistan (%)
Place of birth for the foreign-born population - Bangladesh (%)
Place of birth for the foreign-born population - India (%)
Place of birth for the foreign-born population - Iran (%)
Place of birth for the foreign-born population - Kazakhstan (%)
Place of birth for the foreign-born population - Nepal (%)
Place of birth for the foreign-born population - Pakistan (%)
Place of birth for the foreign-born population - Sri Lanka (%)
Place of birth for the foreign-born population - Uzbekistan (%)
Place of birth for the foreign-born population - Other South Central Asia (%)
Place of birth for the foreign-born population - Burma (%)
Place of birth for the foreign-born population - Cambodia (%)
Place of birth for the foreign-born population - Indonesia (%)
Place of birth for the foreign-born population - Laos (%)
Place of birth for the foreign-born population - Malaysia (%)
Place of birth for the foreign-born population - Philippines (%)
Place of birth for the foreign-born population - Singapore (%)
Place of birth for the foreign-born population - Thailand (%)
Place of birth for the foreign-born population - Vietnam (%)
Place of birth for the foreign-born population - Other South Eastern Asia (%)
Place of birth for the foreign-born population - Armenia (%)
Place of birth for the foreign-born population - Iraq (%)
Place of birth for the foreign-born population - Israel (%)
Place of birth for the foreign-born population - Jordan (%)
Place of birth for the foreign-born population - Kuwait (%)
Place of birth for the foreign-born population - Lebanon (%)
Place of birth for the foreign-born population - Saudi Arabia (%)
Place of birth for the foreign-born population - Syria (%)
Place of birth for the foreign-born population - Turkey (%)
Place of birth for the foreign-born population - Yemen (%)
Place of birth for the foreign-born population - Other Western Asia (%)
Place of birth for the foreign-born population - Eritrea (%)
Place of birth for the foreign-born population - Ethiopia (%)
Place of birth for the foreign-born population - Kenya (%)
Place of birth for the foreign-born population - Somalia (%)
Place of birth for the foreign-born population - Uganda (%)
Place of birth for the foreign-born population - Zimbabwe (%)
Place of birth for the foreign-born population - Other Eastern Africa (%)
Place of birth for the foreign-born population - Cameroon (%)
Place of birth for the foreign-born population - Congo (%)
Place of birth for the foreign-born population - Democratic Republic of Congo (Zaire) (%)
Place of birth for the foreign-born population - Other Middle Africa (%)
Place of birth for the foreign-born population - Egypt (%)
Place of birth for the foreign-born population - Morocco (%)
Place of birth for the foreign-born population - Sudan (%)
Place of birth for the foreign-born population - Other Northern Africa (%)
Place of birth for the foreign-born population - South Africa (%)
Place of birth for the foreign-born population - Other Southern Africa (%)
Place of birth for the foreign-born population - Cabo Verde (%)
Place of birth for the foreign-born population - Ghana (%)
Place of birth for the foreign-born population - Liberia (%)
Place of birth for the foreign-born population - Nigeria (%)
Place of birth for the foreign-born population - Senegal (%)
Place of birth for the foreign-born population - Sierra Leone (%)
Place of birth for the foreign-born population - Other Western Africa (%)
Place of birth for the foreign-born population - Australia (%)
Place of birth for the foreign-born population - New Zealand (%)
Place of birth for the foreign-born population - Fiji (%)
Place of birth for the foreign-born population - Micronesia (%)
Place of birth for the foreign-born population - Bahamas (%)
Place of birth for the foreign-born population - Barbados (%)
Place of birth for the foreign-born population - Cuba (%)
Place of birth for the foreign-born population - Dominica (%)
Place of birth for the foreign-born population - Dominican Republic (%)
Place of birth for the foreign-born population - Grenada (%)
Place of birth for the foreign-born population - Haiti (%)
Place of birth for the foreign-born population - Jamaica (%)
Place of birth for the foreign-born population - St. Vincent and the Grenadines (%)
Place of birth for the foreign-born population - Trinidad and Tobago (%)
Place of birth for the foreign-born population - West Indies (%)
Place of birth for the foreign-born population - Other Caribbean (%)
Place of birth for the foreign-born population - Belize (%)
Place of birth for the foreign-born population - Costa Rica (%)
Place of birth for the foreign-born population - El Salvador (%)
Place of birth for the foreign-born population - Guatemala (%)
Place of birth for the foreign-born population - Honduras (%)
Place of birth for the foreign-born population - Mexico (%)
Place of birth for the foreign-born population - Nicaragua (%)
Place of birth for the foreign-born population - Panama (%)
Place of birth for the foreign-born population - Other Central America (%)
Place of birth for the foreign-born population - Argentina (%)
Place of birth for the foreign-born population - Bolivia (%)
Place of birth for the foreign-born population - Brazil (%)
Place of birth for the foreign-born population - Chile (%)
Place of birth for the foreign-born population - Colombia (%)
Place of birth for the foreign-born population - Ecuador (%)
Place of birth for the foreign-born population - Guyana (%)
Place of birth for the foreign-born population - Peru (%)
Place of birth for the foreign-born population - Uruguay (%)
Place of birth for the foreign-born population - Venezuela (%)
Place of birth for the foreign-born population - Other South America (%)
Place of birth for the foreign-born population - Canada (%)
Place of birth for the foreign-born population - Other Northern America (%)
Place of birth for the foreign-born population - Other (%)
Latest news about races in Neosho, MO collected exclusively by city-data.com from local newspapers, TV, and radio stations
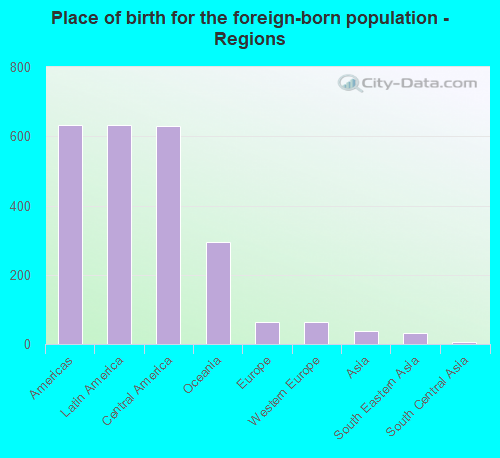
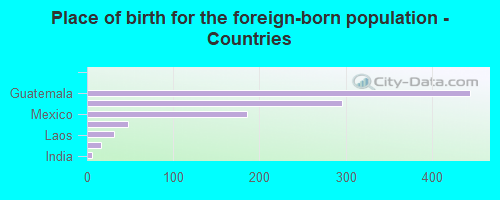
According to 2022 data, the most numerous races in Neosho, MO are White alone (9,045 residents), Black alone (227 residents), and Two or more races (1,487 residents). 85.7% of Neosho residents speak English at home. 8.1% of Neosho, MO residents are foreign-born (5.1% born in Latin America, 2.4% born in Oceania), which is 50.8% greater than the foreign-born rate of 4.0% across the entire state of Missouri.
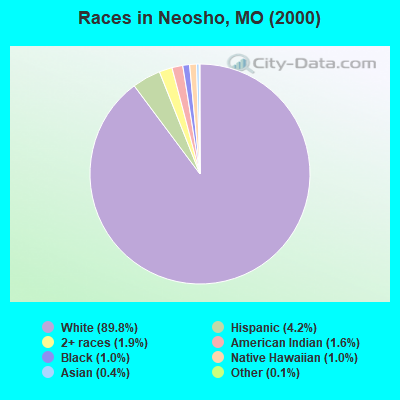
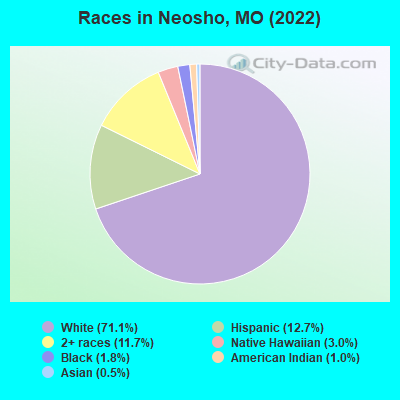
Race distribution in Neosho
2000 2022
4,686,474 83.8% White alone 625,667 11.2% Black alone 118,592 2.1% Hispanic 71,905 1.3% Two or more races 61,041 1.1% Asian alone 23,302 0.4% American Indian alone 5,291 0.09% Other race alone 2,939 0.05% Native Hawaiian and Other
4,733,411 76.6% White alone 656,739 10.6% Black alone 316,300 5.1% Two or more races 291,763 4.7% Hispanic 132,436 2.1% Asian alone 27,467 0.4% Other race alone 12,313 0.2% American Indian alone 7,528 0.1% Native Hawaiian and Other
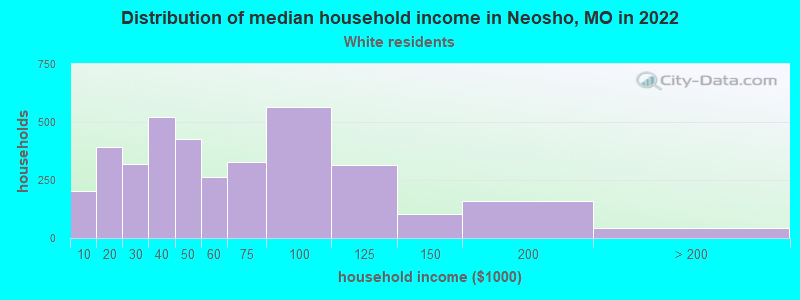
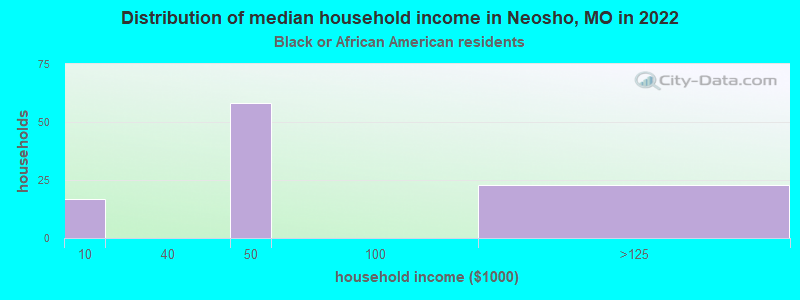
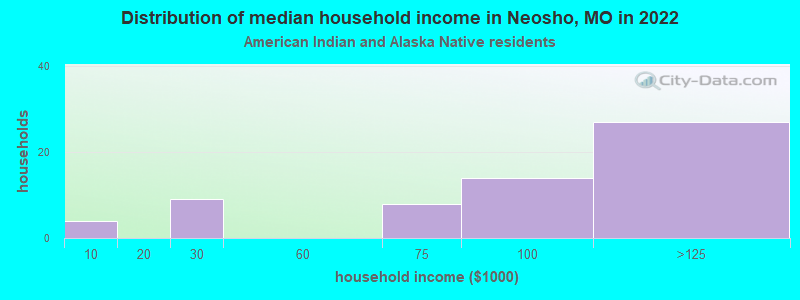
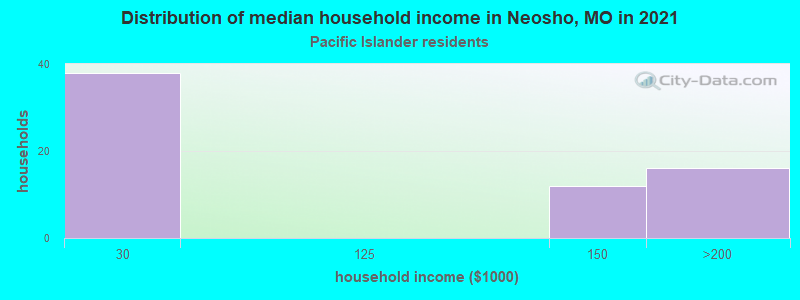
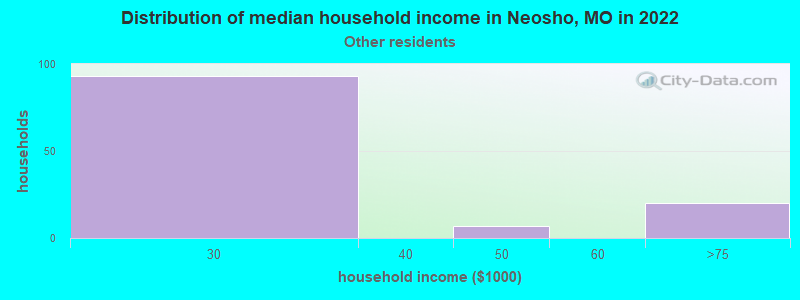
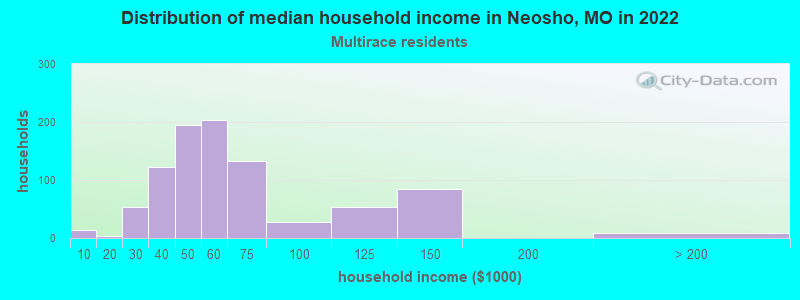
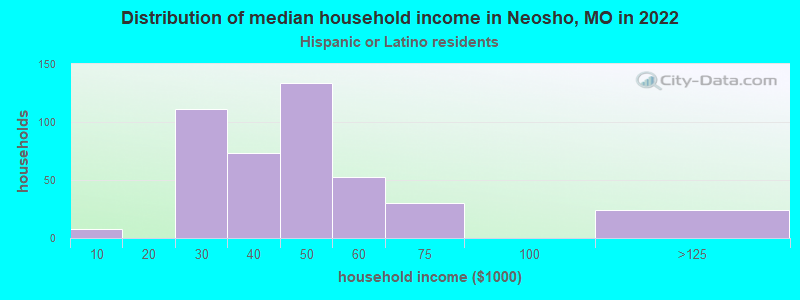
Income and house value in Neosho Median household income in 2022 $49,175 White non-Hispanic householders$110,566 American Indian and Alaska Native householders$25,638 Some other race householders$54,015 Two or more races householders$39,119 Hispanic or Latino race householdersMedian 2022 house value $151,020 White Non-Hispanic householders$241,724 American Indian or Alaska Native householders$86,993 Native Hawaiian and other Pacific Islander householders$129,909 Two or more races householders$127,589 Hispanic or Latino householders
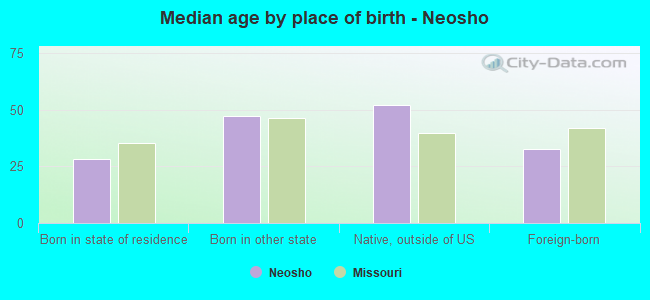
Median age by race in Neosho
38.2 Median age for White residents34.9 40.8 54.8 Median age for Black or African American residents59.1 55.0 35.0 Median age for American Indian / Alaska Native residents38.9 29.9 29.6 Median age for Asian residents30.3 -666,666,666.0 12.1 Median age for Native Hawaiian / Pacific Islander residents6.8 27.2 29.6 Median age for Other race residents33.7 12.1 33.2 Median age for Two or more races residents34.6 30.2 39.2 Median age for White alone residents36.3 41.9 23.0 Median age for Hispanic or Latino residents19.4 22.9
Owner/renter occupied households by race in Neosho
House owners and renters - White residents 2,186 60.6% Owner occupied1,422 39.4% Renter occupiedHouse owners and renters - Black or African American residents 97 100.0% Renter occupiedHouse owners and renters - American Indian / Alaska Native residents 41 85.5% Owner occupied7 14.5% Renter occupiedHouse owners and renters - Asian residents 18 100.0% Renter occupiedHouse owners and renters - Native Hawaiian / Pacific Islander residents 43 54.7% Owner occupied35 45.3% Renter occupiedHouse owners and renters - Other race residents 64 59.2% Owner occupied44 40.8% Renter occupiedHouse owners and renters - Two or more races residents 448 51.2% Owner occupied427 48.8% Renter occupiedHouse owners and renters - White alone residents 2,181 62.2% Owner occupied1,327 37.8% Renter occupiedHouse owners and renters - Hispanic or Latino residents 125 31.4% Owner occupied274 68.6% Renter occupied
Language usage in Neosho
English speakers - Total 85.7% of residents of Neosho speak English at home.
10.7% of residents speak Spanish at home 611 48.3% Speak English very well655 51.7% Speak English less than very well3.7% of residents speak other language at home 297 66.9% Speak English very well147 33.1% Speak English less than very well
English speakers - Born in the United States 94.5% of residents of Neosho speak English at home.
4.8% of residents speak Spanish at home 188 92.6% Speak English very well15 7.4% Speak English less than very well0.9% of residents speak other language at home 31 81.6% Speak English very well7 18.4% Speak English less than very well
English speakers - Native, born elsewhere 60.9% of residents of Neosho speak English at home.
28.6% of residents speak Spanish at home 21 55.3% Speak English very well17 44.7% Speak English less than very well6.8% of residents speak other language at home 9 100.0% Speak English very well
English speakers - Foreign-born 3.0% of residents of Neosho speak English at home.
60.1% of residents speak Spanish at home 69 12.0% Speak English very well508 88.0% Speak English less than very well39.0% of residents speak other language at home 244 65.2% Speak English very well130 34.8% Speak English less than very well
White (Caucasian) - Speak only English Native:
96.4% (8,514)Foreign-born:
4.6% (9)
White (Caucasian) - Speak another language Native:
3.4% (298)Foreign-born:
94.6% (177)
Asian - Speak another language Native:
75.0% (16)Foreign-born:
100.0% (39)
Native Hawaiian / Pacific Islander - Speak only English Native:
86.7% (68)Foreign-born:
9.1% (17)
Native Hawaiian / Pacific Islander - Speak another language Native:
12.1% (9)Foreign-born:
87.1% (165)
Other race - Speak another language Native:
80.7% (184)Foreign-born:
94.9% (141)
Two or more races - Speak another language Native:
17.5% (298)Foreign-born:
100.0% (455)
White alone - Speak only English Native:
98.8% (8,429)Foreign-born:
14.6% (9)
White alone - Speak another language Native:
1.2% (101)Foreign-born:
89.1% (53)
Hispanic or Latino - Speak another language Native:
73.8% (613)Foreign-born:
99.4% (571)
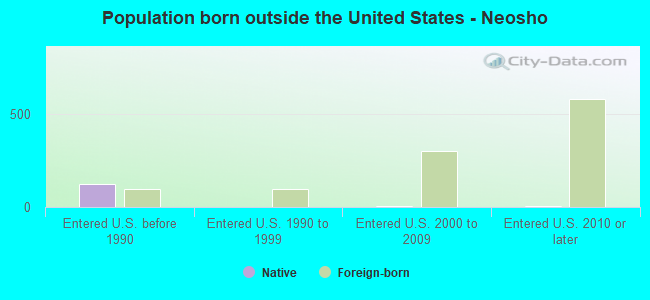
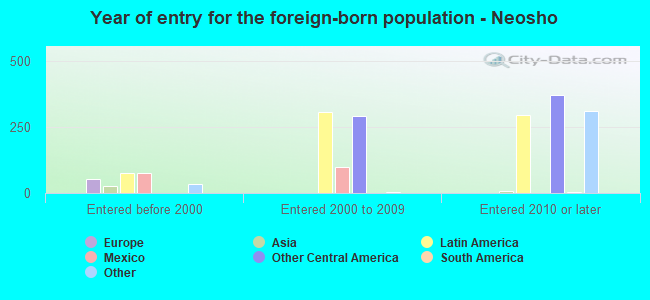
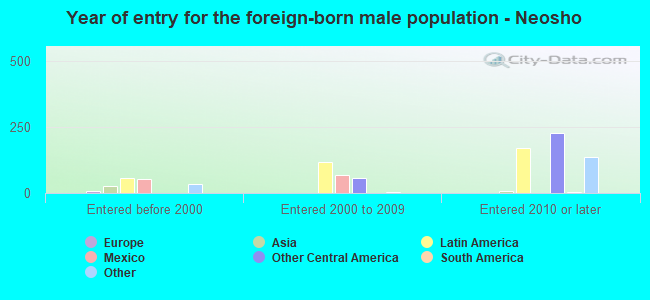
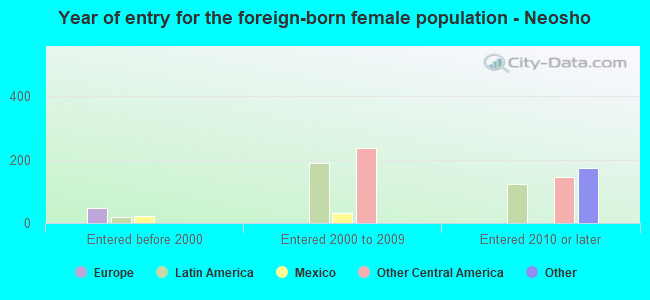
Foreign-born residents in Neosho 1,035 residents are foreign born (5.1% Latin America , 2.4% Oceania ).
This city:
8.1%Missouri:
4.2%
Marital status for residents in Neosho Marital status - White (Caucasian) population 15 years and over
Males 31.4% Never married48.7% Now married1.7% Separated3.6% Widowed14.5% DivorcedFemales 24.6% Never married45.1% Now married4.1% Separated11.3% Widowed14.9% DivorcedWomen who gave birth in the past 12 months Now married:
84.3% (195)Unmarried:
15.7% (36)
Women who did not give birth in the past 12 months Now married:
48.4% (1,030)Unmarried:
51.6% (1,098)
Marital status - Black or African American population 15 years and over
Males 47.9% Never married13.8% Now married1.2% Separated0.0% Widowed37.1% DivorcedFemales 26.3% Never married43.9% Now married0.0% Separated0.0% Widowed29.8% DivorcedWomen who gave birth in the past 12 months Now married:
93.8% (1)Unmarried:
0.0% (0)
Women who did not give birth in the past 12 months Now married:
0.0% (0)Unmarried:
100.0% (12)
Marital status - American Indian / Alaska Native population 15 years and over
Males 25.9% Never married55.6% Now married0.0% Separated0.0% Widowed18.5% DivorcedFemales 0.0% Never married75.0% Now married0.0% Separated0.0% Widowed25.0% DivorcedWomen who did not give birth in the past 12 months Now married:
100.0% (29)Unmarried:
0.0% (0)
Marital status - Asian population 15 years and over
Males 100.0% Never married0.0% Now married0.0% Separated0.0% Widowed0.0% DivorcedFemales 100.0% Never married0.0% Now married0.0% Separated0.0% Widowed0.0% DivorcedWomen who did not give birth in the past 12 months Now married:
0.0% (0)Unmarried:
100.0% (13)
Marital status - Native Hawaiian / Pacific Islander population 15 years and over
Males 17.6% Never married60.0% Now married0.0% Separated0.0% Widowed22.4% DivorcedFemales 51.6% Never married42.9% Now married5.5% Separated0.0% Widowed0.0% DivorcedWomen who did not give birth in the past 12 months Now married:
48.4% (35)Unmarried:
51.6% (38)
Marital status - Other race population 15 years and over
Males 23.7% Never married48.4% Now married0.0% Separated0.0% Widowed28.0% DivorcedFemales 25.3% Never married59.6% Now married0.0% Separated15.2% Widowed0.0% DivorcedWomen who gave birth in the past 12 months Now married:
0.0% (0)Unmarried:
100.0% (16)
Women who did not give birth in the past 12 months Now married:
83.1% (72)Unmarried:
16.9% (15)
Marital status - Two or more races population 15 years and over
Males 46.5% Never married48.0% Now married4.1% Separated0.0% Widowed1.4% DivorcedFemales 41.3% Never married45.9% Now married0.0% Separated5.4% Widowed7.4% DivorcedWomen who gave birth in the past 12 months Now married:
0.0% (0)Unmarried:
100.0% (12)
Women who did not give birth in the past 12 months Now married:
40.7% (275)Unmarried:
59.3% (401)
Marital status - White alone, not Hispanic / Latino population 15 years and over
Males 31.4% Never married48.3% Now married1.3% Separated3.8% Widowed15.2% DivorcedFemales 24.4% Never married44.5% Now married4.3% Separated11.9% Widowed14.9% DivorcedWomen who gave birth in the past 12 months Now married:
84.3% (197)Unmarried:
15.7% (37)
Women who did not give birth in the past 12 months Now married:
47.6% (932)Unmarried:
52.4% (1,028)
Marital status - Hispanic or Latino population 15 years and over
Males 35.8% Never married47.1% Now married11.0% Separated0.0% Widowed6.1% DivorcedFemales 48.4% Never married41.0% Now married0.0% Separated3.2% Widowed7.3% DivorcedWomen who gave birth in the past 12 months Now married:
0.0% (0)Unmarried:
100.0% (14)
Women who did not give birth in the past 12 months Now married:
43.7% (208)Unmarried:
56.3% (268)
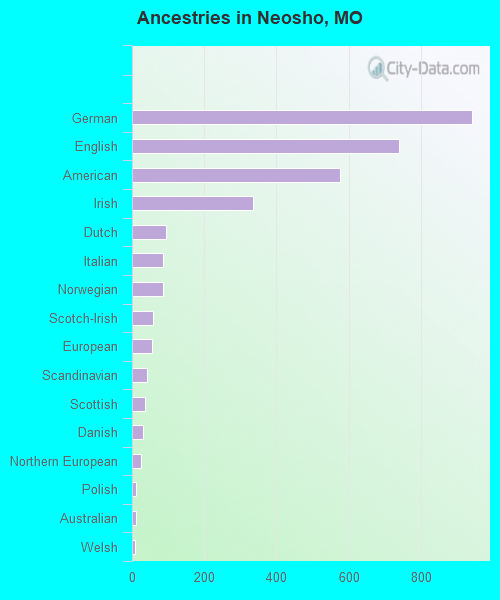
Ancestries in Neosho
942 16.0% German739 12.5% English575 9.7% American335 5.7% Irish93 1.6% Dutch86 1.5% Italian85 1.4% Norwegian57 1.0% Scotch-Irish55 0.9% European41 0.7% Scandinavian36 0.6% Scottish30 0.5% Danish26 0.4% Northern European11 0.2% Polish10 0.2% Australian9 0.2% Welsh7 0.1% French4 0.07% Brazilian3 0.05% French Canadian
Children Nativity (place of birth) in Neosho
Children under 6 years - Living with two parents Both parents native 585 100.0% NativeBoth parents foreign-born 144 100.0% NativeOne native, one foreign-born parent 16 100.0% NativeChildren under 6 years - Living with one parent Native parent 188 100.0% NativeForeign-born parent 55 26.8% Native149 73.2% Foreign-bornChildren 6 to 17 years - Living with two parents Both parents native 1,011 100.0% NativeBoth parents foreign-born 139 49.8% Native140 50.2% Foreign-bornOne native, one foreign-born parent 24 100.0% NativeChildren 6 to 17 years - Living with one parent Native parent 679 100.0% NativeForeign-born parent 122 55.0% Native99 45.0% Foreign-born
Grandparents responsible for own grandchildren in Neosho
Grandparents (30 to 59 years) White / Caucasian 16 19.1% Responsible for grandchildren68 80.9% Not responsible for grandchildrenAmerican Indian / Alaska Native 9 100.0% Not responsible for grandchildrenTwo or more races 10 100.0% Not responsible for grandchildrenWhite alone, not Hispanic / Latino 16 19.0% Responsible for grandchildren69 81.0% Not responsible for grandchildrenGrandparents (60 years and over) White / Caucasian 7 39.2% Responsible for grandchildren11 60.8% Not responsible for grandchildrenTwo or more races 4 100.0% Not responsible for grandchildrenWhite alone, not Hispanic / Latino 7 38.8% Responsible for grandchildren12 61.2% Not responsible for grandchildren