Races in New Ipswich, New Hampshire (NH) Detailed Stats
Ancestries, Foreign-born residents, place of birth

Recent posts about races in New Ipswich, New Hampshire on our local forum with over 2,400,000 registered users:
 | Where to find period, old homes for sale? (20 replies) |
| New Ipswitch? (18 replies) |
| Picture Thread for NH (1997 replies) |
| From Kentucky.... (24 replies) |
| Moving to Southern NH/ Pipeline concerns (26 replies) |
| Getting ready for the storm. (62 replies) |
2.6% of New Ipswich, NH residents are foreign-born (1.1% born in North America, 0.9% born in Europe, 0.4% born in Latin America), which is 95.0% less than the foreign-born rate of 5.0% across the entire state of New Hampshire.
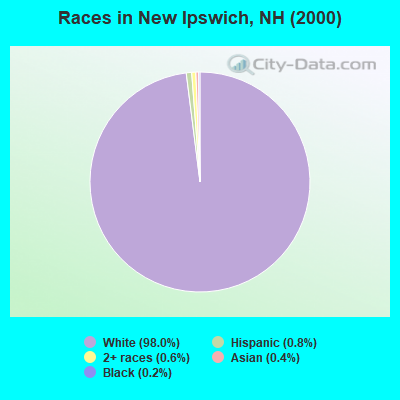
Race distribution in New Ipswich

- 4,20298.0%White alone
- 340.8%Hispanic
- 240.6%Two or more races
- 160.4%Asian alone
- 80.2%Black alone
- 30.07%American Indian alone
- 20.05%Other race alone
2000
2022
-
- 1,175,25295.1%White alone
- 20,4891.7%Hispanic
- 15,8031.3%Asian alone
- 11,6060.9%Two or more races
- 8,3540.7%Black alone
- 2,6980.2%American Indian alone
- 1,2540.1%Other race alone
- 3300.03%Native Hawaiian and Other
Pacific Islander alone

-
- 1,208,10186.6%White alone
- 63,4794.5%Hispanic
- 60,7244.4%Two or more races
- 36,5192.6%Asian alone
- 17,9311.3%Black alone
- 6,6150.5%Other race alone
- 1,0140.07%American Indian alone
- 8480.06%Native Hawaiian and Other
Pacific Islander alone

Income and house value in New Ipswich
- Median household income in 2022
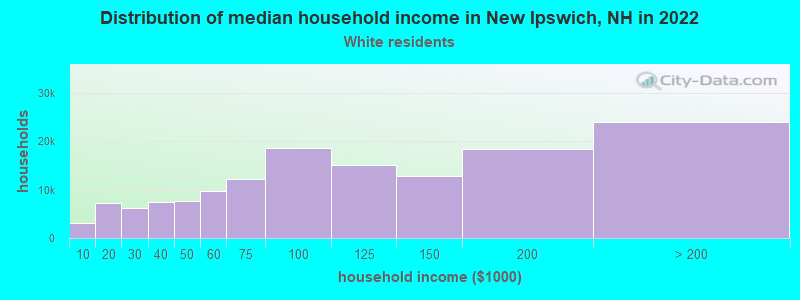
- $98,144White non-Hispanic householders
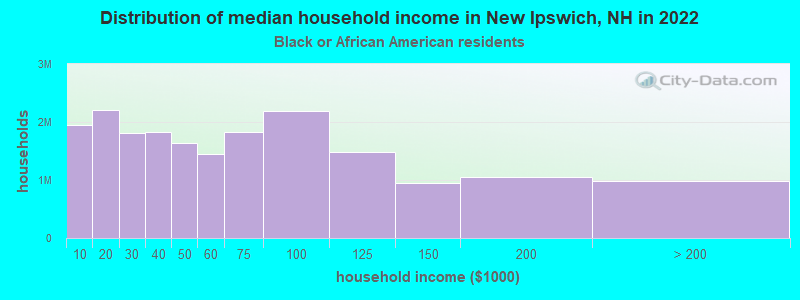
- $54,487Black householders
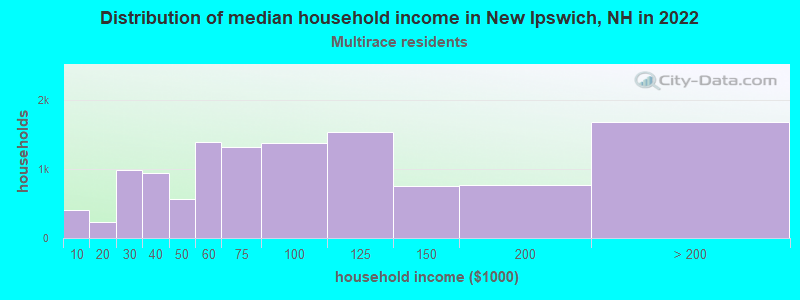
- $87,554Two or more races householders
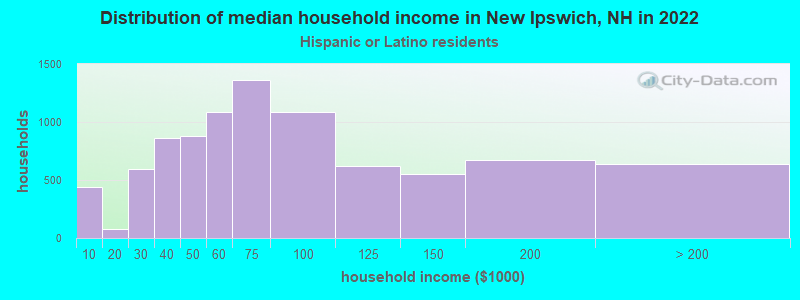
- $59,792Hispanic or Latino race householders
- Median 2022 house value
- $367,802White Non-Hispanic householders
- $338,330Black or African American householders
- $255,627Two or more races householders
Household income for White non-Hispanic householders
Household income for Black householders
Household income for Two or more races householders
Household income for Hispanic or Latino race householders
Foreign-born residents in New Ipswich
110 residents are foreign born (1.1% North America, 0.9% Europe, 0.4% Latin America).
| This city: | 2.6% |
| New Hampshire: | 4.4% |
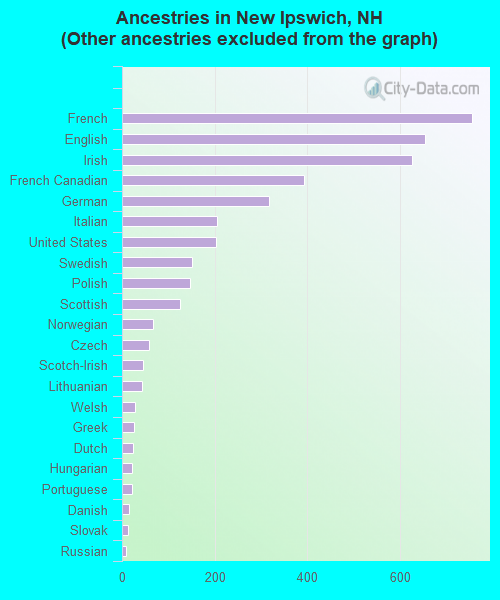
Ancestries in New Ipswich

- 1,21023.4%Other
- 75414.6%French
- 65312.7%English
- 62512.1%Irish
- 3937.6%French Canadian
- 3186.2%German
- 2064.0%Italian
- 2033.9%United States
- 1522.9%Swedish
- 1462.8%Polish
- 1252.4%Scottish
- 671.3%Norwegian
- 591.1%Czech
- 450.9%Scotch-Irish
- 440.9%Lithuanian
- 280.5%Welsh
- 250.5%Greek
- 230.4%Dutch
- 220.4%Hungarian
- 210.4%Portuguese
- 150.3%Danish
- 130.3%Slovak
- 90.2%Russian
- 50.10%Ukrainian
Zip codes: 03071.