Races in New Rochelle, New York (NY) Detailed Stats
Data:
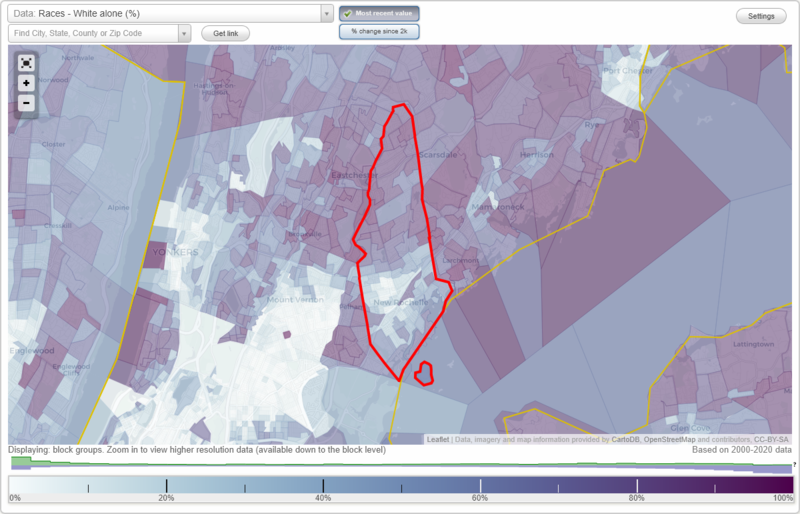
Races - White alone (%)
Races - White alone (% change since 2000)
Races - Black alone (%)
Races - Black alone (% change since 2000)
Races - American Indian alone (%)
Races - American Indian alone (% change since 2000)
Races - Asian alone (%)
Races - Asian alone (% change since 2000)
Races - Hispanic (%)
Races - Hispanic (% change since 2000)
Races - Native Hawaiian and Other Pacific Islander alone (%)
Races - Native Hawaiian and Other Pacific Islander alone (% change since 2000)
Races - Two or more races(%)
Races - Two or more races(% change since 2000)
Races - Other race alone (%)
Races - Other race alone (% change since 2000)
Racial diversity
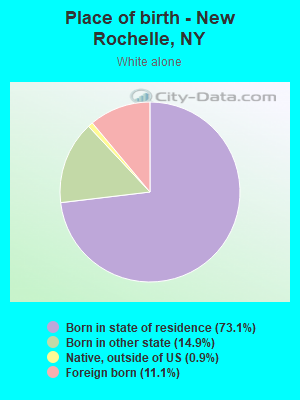
Place of birth - Born in state of residence (%)
Place of birth - Born in state of residence (%) - White
Place of birth - Born in state of residence (%) - Black or African American
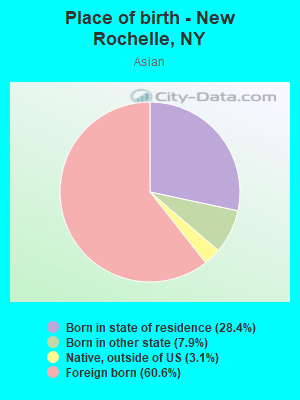
Place of birth - Born in state of residence (%) - Asian
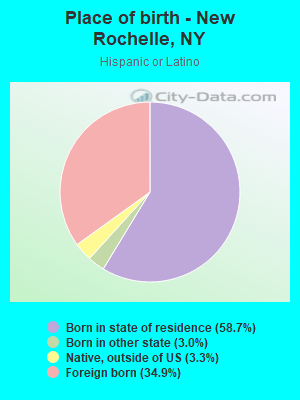
Place of birth - Born in state of residence (%) - Hispanic or Latino
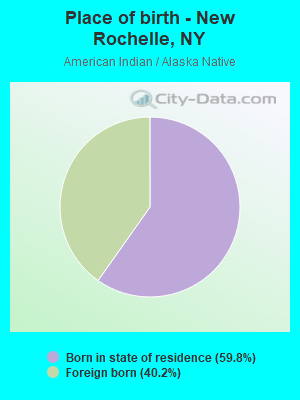
Place of birth - Born in state of residence (%) - American Indian and Alaska Native
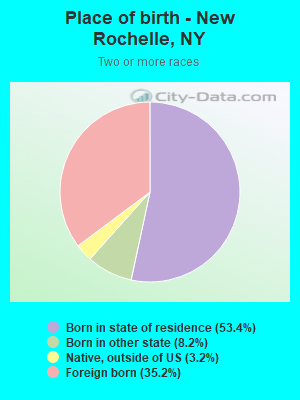
Place of birth - Born in state of residence (%) - Multirace
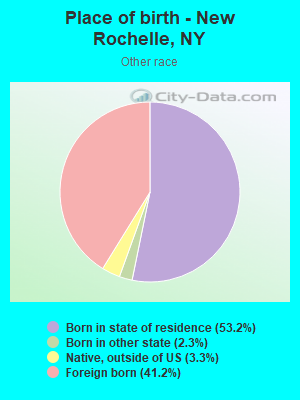
Place of birth - Born in state of residence (%) - Other Race
Place of birth - Born in other state (%)
Place of birth - Born in other state (%) - White
Place of birth - Born in other state (%) - Black or African American
Place of birth - Born in other state (%) - Asian
Place of birth - Born in other state (%) - Hispanic or Latino
Place of birth - Born in other state (%) - American Indian and Alaska Native
Place of birth - Born in other state (%) - Multirace
Place of birth - Born in other state (%) - Other Race
Place of birth - Native, outside of US (%)
Place of birth - Native, outside of US (%) - White
Place of birth - Native, outside of US (%) - Black or African American
Place of birth - Native, outside of US (%) - Asian
Place of birth - Native, outside of US (%) - Hispanic or Latino
Place of birth - Native, outside of US (%) - American Indian and Alaska Native
Place of birth - Native, outside of US (%) - Multirace
Place of birth - Native, outside of US (%) - Other Race
Place of birth - Foreign born (%)
Place of birth - Foreign born (%) - White
Place of birth - Foreign born (%) - Black or African American
Place of birth - Foreign born (%) - Asian
Place of birth - Foreign born (%) - Hispanic or Latino
Place of birth - Foreign born (%) - American Indian and Alaska Native
Place of birth - Foreign born (%) - Multirace
Place of birth - Foreign born (%) - Other Race
Residents speaking English at home (%)
Residents speaking English at home - Born in the United States (%)
Residents speaking English at home - Native, born elsewhere (%)
Residents speaking English at home - Foreign born (%)
Residents speaking Spanish at home (%)
Residents speaking Spanish at home - Born in the United States (%)
Residents speaking Spanish at home - Native, born elsewhere (%)
Residents speaking Spanish at home - Foreign born (%)
Residents speaking other language at home (%)
Residents speaking other language at home - Born in the United States (%)
Residents speaking other language at home - Native, born elsewhere (%)
Residents speaking other language at home - Foreign born (%)
Marital status - Never married (%)
Marital status - Now married (%)
Marital status - Separated (%)
Marital status - Widowed (%)
Marital status - Divorced (%)
Ancestries Reported - Arab (%)
Ancestries Reported - Czech (%)
Ancestries Reported - Danish (%)
Ancestries Reported - Dutch (%)
Ancestries Reported - English (%)
Ancestries Reported - French (%)
Ancestries Reported - French Canadian (%)
Ancestries Reported - German (%)
Ancestries Reported - Greek (%)
Ancestries Reported - Hungarian (%)
Ancestries Reported - Irish (%)
Ancestries Reported - Italian (%)
Ancestries Reported - Lithuanian (%)
Ancestries Reported - Norwegian (%)
Ancestries Reported - Polish (%)
Ancestries Reported - Portuguese (%)
Ancestries Reported - Russian (%)
Ancestries Reported - Scotch-Irish (%)
Ancestries Reported - Scottish (%)
Ancestries Reported - Slovak (%)
Ancestries Reported - Subsaharan African (%)
Ancestries Reported - Swedish (%)
Ancestries Reported - Swiss (%)
Ancestries Reported - Ukrainian (%)
Ancestries Reported - United States (%)
Ancestries Reported - Welsh (%)
Ancestries Reported - West Indian (%)
Ancestries Reported - Other (%)
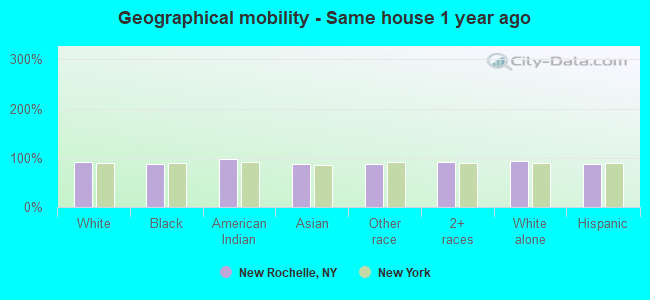
Geographical mobility - Same house 1 year ago (%)
Geographical mobility - Same house 1 year ago (%) - White
Geographical mobility - Same house 1 year ago (%) - Black or African American
Geographical mobility - Same house 1 year ago (%) - Asian
Geographical mobility - Same house 1 year ago (%) - Hispanic or Latino
Geographical mobility - Same house 1 year ago (%) - American Indian and Alaska Native
Geographical mobility - Same house 1 year ago (%) - Multirace
Geographical mobility - Same house 1 year ago (%) - Other Race
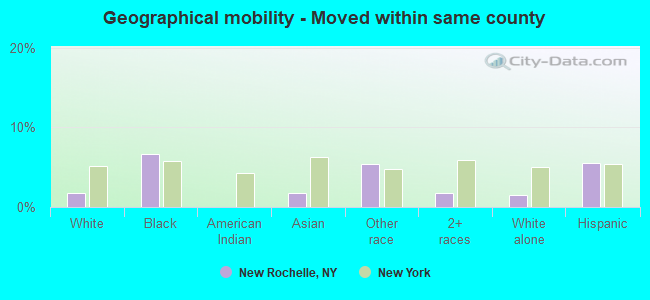
Geographical mobility - Moved within same county (%)
Geographical mobility - Moved within same county (%) - White
Geographical mobility - Moved within same county (%) - Black or African American
Geographical mobility - Moved within same county (%) - Asian
Geographical mobility - Moved within same county (%) - Hispanic or Latino
Geographical mobility - Moved within same county (%) - American Indian and Alaska Native
Geographical mobility - Moved within same county (%) - Multirace
Geographical mobility - Moved within same county (%) - Other Race
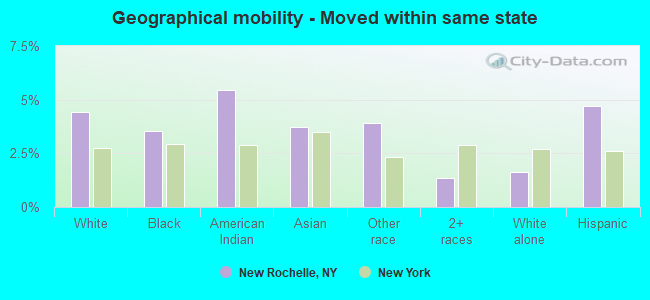
Geographical mobility - Moved from different county within same state (%)
Geographical mobility - Moved from different county within same state (%) - White
Geographical mobility - Moved from different county within same state (%) - Black or African American
Geographical mobility - Moved from different county within same state (%) - Asian
Geographical mobility - Moved from different county within same state (%) - Hispanic or Latino
Geographical mobility - Moved from different county within same state (%) - American Indian and Alaska Native
Geographical mobility - Moved from different county within same state (%) - Multirace
Geographical mobility - Moved from different county within same state (%) - Other Race
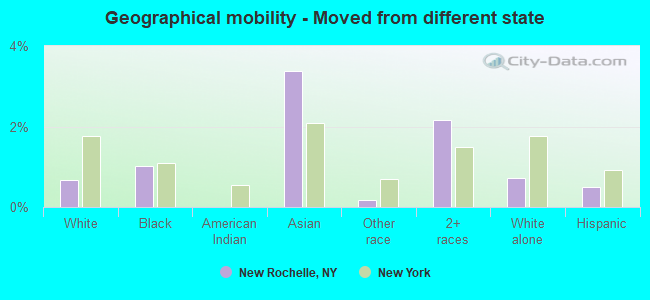
Geographical mobility - Moved from different state (%)
Geographical mobility - Moved from different state (%) - White
Geographical mobility - Moved from different state (%) - Black or African American
Geographical mobility - Moved from different state (%) - Asian
Geographical mobility - Moved from different state (%) - Hispanic or Latino
Geographical mobility - Moved from different state (%) - American Indian and Alaska Native
Geographical mobility - Moved from different state (%) - Multirace
Geographical mobility - Moved from different state (%) - Other Race
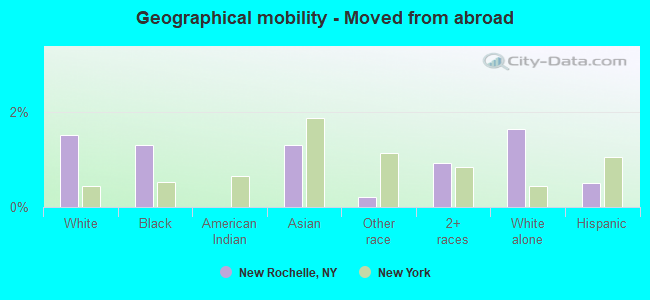
Geographical mobility - Moved from abroad (%)
Geographical mobility - Moved from abroad (%) - White
Geographical mobility - Moved from abroad (%) - Black or African American
Geographical mobility - Moved from abroad (%) - Asian
Geographical mobility - Moved from abroad (%) - Hispanic or Latino
Geographical mobility - Moved from abroad (%) - American Indian and Alaska Native
Geographical mobility - Moved from abroad (%) - Multirace
Geographical mobility - Moved from abroad (%) - Other Race
Place of birth for the foreign-born population - Ireland (%)
Place of birth for the foreign-born population - Denmark (%)
Place of birth for the foreign-born population - Norway (%)
Place of birth for the foreign-born population - Sweden (%)
Place of birth for the foreign-born population - United Kingdom (%)
Place of birth for the foreign-born population - England (%)
Place of birth for the foreign-born population - Scotland (%)
Place of birth for the foreign-born population - Other Northern Europe (%)
Place of birth for the foreign-born population - Austria (%)
Place of birth for the foreign-born population - Belgium (%)
Place of birth for the foreign-born population - France (%)
Place of birth for the foreign-born population - Germany (%)
Place of birth for the foreign-born population - Netherlands (%)
Place of birth for the foreign-born population - Switzerland (%)
Place of birth for the foreign-born population - Other Western Europe (%)
Place of birth for the foreign-born population - Greece (%)
Place of birth for the foreign-born population - Italy (%)
Place of birth for the foreign-born population - Portugal (%)
Place of birth for the foreign-born population - Spain (%)
Place of birth for the foreign-born population - Other Southern Europe (%)
Place of birth for the foreign-born population - Albania (%)
Place of birth for the foreign-born population - Belarus (%)
Place of birth for the foreign-born population - Bosnia and Herzegovina (%)
Place of birth for the foreign-born population - Bulgaria (%)
Place of birth for the foreign-born population - Croatia (%)
Place of birth for the foreign-born population - Czechoslovakia (%)
Place of birth for the foreign-born population - Hungary (%)
Place of birth for the foreign-born population - Latvia (%)
Place of birth for the foreign-born population - Lithuania (%)
Place of birth for the foreign-born population - North Macedonia (Macedonia) (%)
Place of birth for the foreign-born population - Moldova (%)
Place of birth for the foreign-born population - Poland (%)
Place of birth for the foreign-born population - Romania (%)
Place of birth for the foreign-born population - Russia (%)
Place of birth for the foreign-born population - Serbia (%)
Place of birth for the foreign-born population - Ukraine (%)
Place of birth for the foreign-born population - Other Eastern Europe (%)
Place of birth for the foreign-born population - China (%)
Place of birth for the foreign-born population - Hong Kong (%)
Place of birth for the foreign-born population - Taiwan (%)
Place of birth for the foreign-born population - Japan (%)
Place of birth for the foreign-born population - Korea (%)
Place of birth for the foreign-born population - Other Eastern Asia (%)
Place of birth for the foreign-born population - Afghanistan (%)
Place of birth for the foreign-born population - Bangladesh (%)
Place of birth for the foreign-born population - India (%)
Place of birth for the foreign-born population - Iran (%)
Place of birth for the foreign-born population - Kazakhstan (%)
Place of birth for the foreign-born population - Nepal (%)
Place of birth for the foreign-born population - Pakistan (%)
Place of birth for the foreign-born population - Sri Lanka (%)
Place of birth for the foreign-born population - Uzbekistan (%)
Place of birth for the foreign-born population - Other South Central Asia (%)
Place of birth for the foreign-born population - Burma (%)
Place of birth for the foreign-born population - Cambodia (%)
Place of birth for the foreign-born population - Indonesia (%)
Place of birth for the foreign-born population - Laos (%)
Place of birth for the foreign-born population - Malaysia (%)
Place of birth for the foreign-born population - Philippines (%)
Place of birth for the foreign-born population - Singapore (%)
Place of birth for the foreign-born population - Thailand (%)
Place of birth for the foreign-born population - Vietnam (%)
Place of birth for the foreign-born population - Other South Eastern Asia (%)
Place of birth for the foreign-born population - Armenia (%)
Place of birth for the foreign-born population - Iraq (%)
Place of birth for the foreign-born population - Israel (%)
Place of birth for the foreign-born population - Jordan (%)
Place of birth for the foreign-born population - Kuwait (%)
Place of birth for the foreign-born population - Lebanon (%)
Place of birth for the foreign-born population - Saudi Arabia (%)
Place of birth for the foreign-born population - Syria (%)
Place of birth for the foreign-born population - Turkey (%)
Place of birth for the foreign-born population - Yemen (%)
Place of birth for the foreign-born population - Other Western Asia (%)
Place of birth for the foreign-born population - Eritrea (%)
Place of birth for the foreign-born population - Ethiopia (%)
Place of birth for the foreign-born population - Kenya (%)
Place of birth for the foreign-born population - Somalia (%)
Place of birth for the foreign-born population - Uganda (%)
Place of birth for the foreign-born population - Zimbabwe (%)
Place of birth for the foreign-born population - Other Eastern Africa (%)
Place of birth for the foreign-born population - Cameroon (%)
Place of birth for the foreign-born population - Congo (%)
Place of birth for the foreign-born population - Democratic Republic of Congo (Zaire) (%)
Place of birth for the foreign-born population - Other Middle Africa (%)
Place of birth for the foreign-born population - Egypt (%)
Place of birth for the foreign-born population - Morocco (%)
Place of birth for the foreign-born population - Sudan (%)
Place of birth for the foreign-born population - Other Northern Africa (%)
Place of birth for the foreign-born population - South Africa (%)
Place of birth for the foreign-born population - Other Southern Africa (%)
Place of birth for the foreign-born population - Cabo Verde (%)
Place of birth for the foreign-born population - Ghana (%)
Place of birth for the foreign-born population - Liberia (%)
Place of birth for the foreign-born population - Nigeria (%)
Place of birth for the foreign-born population - Senegal (%)
Place of birth for the foreign-born population - Sierra Leone (%)
Place of birth for the foreign-born population - Other Western Africa (%)
Place of birth for the foreign-born population - Australia (%)
Place of birth for the foreign-born population - New Zealand (%)
Place of birth for the foreign-born population - Fiji (%)
Place of birth for the foreign-born population - Micronesia (%)
Place of birth for the foreign-born population - Bahamas (%)
Place of birth for the foreign-born population - Barbados (%)
Place of birth for the foreign-born population - Cuba (%)
Place of birth for the foreign-born population - Dominica (%)
Place of birth for the foreign-born population - Dominican Republic (%)
Place of birth for the foreign-born population - Grenada (%)
Place of birth for the foreign-born population - Haiti (%)
Place of birth for the foreign-born population - Jamaica (%)
Place of birth for the foreign-born population - St. Vincent and the Grenadines (%)
Place of birth for the foreign-born population - Trinidad and Tobago (%)
Place of birth for the foreign-born population - West Indies (%)
Place of birth for the foreign-born population - Other Caribbean (%)
Place of birth for the foreign-born population - Belize (%)
Place of birth for the foreign-born population - Costa Rica (%)
Place of birth for the foreign-born population - El Salvador (%)
Place of birth for the foreign-born population - Guatemala (%)
Place of birth for the foreign-born population - Honduras (%)
Place of birth for the foreign-born population - Mexico (%)
Place of birth for the foreign-born population - Nicaragua (%)
Place of birth for the foreign-born population - Panama (%)
Place of birth for the foreign-born population - Other Central America (%)
Place of birth for the foreign-born population - Argentina (%)
Place of birth for the foreign-born population - Bolivia (%)
Place of birth for the foreign-born population - Brazil (%)
Place of birth for the foreign-born population - Chile (%)
Place of birth for the foreign-born population - Colombia (%)
Place of birth for the foreign-born population - Ecuador (%)
Place of birth for the foreign-born population - Guyana (%)
Place of birth for the foreign-born population - Peru (%)
Place of birth for the foreign-born population - Uruguay (%)
Place of birth for the foreign-born population - Venezuela (%)
Place of birth for the foreign-born population - Other South America (%)
Place of birth for the foreign-born population - Canada (%)
Place of birth for the foreign-born population - Other Northern America (%)
Place of birth for the foreign-born population - Other (%)
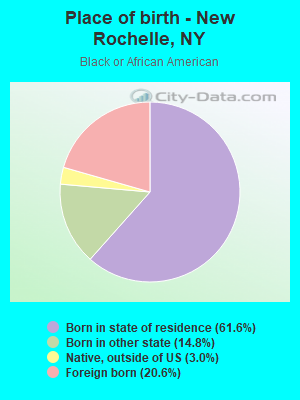
According to 2022 data, the most numerous races in New Rochelle, NY are White alone (37,873 residents), Hispanic (21,102 residents), and Black alone (17,610 residents). 69.0% of New Rochelle residents speak English at home. 27.3% of New Rochelle, NY residents are foreign-born (17.3% born in Latin America, 4.1% born in Europe, 3.9% born in Asia), which is 19.3% greater than the foreign-born rate of 22.0% across the entire state of New York.
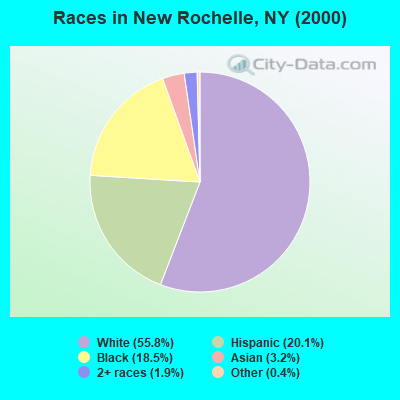
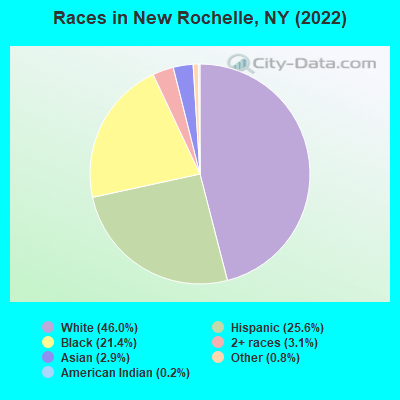
Race distribution in New Rochelle
2000 2022
40,272 55.8% White alone 14,492 20.1% Hispanic 13,389 18.5% Black alone 2,304 3.2% Asian alone 1,359 1.9% Two or more races 280 0.4% Other race alone 64 0.09% American Indian alone 22 0.03% Native Hawaiian and Other
37,873 46.0% White alone 21,102 25.6% Hispanic 17,610 21.4% Black alone 2,579 3.1% Two or more races 2,367 2.9% Asian alone 623 0.8% Other race alone 138 0.2% American Indian alone
2000 2022
11,760,981 62.0% White alone 2,867,583 15.1% Hispanic 2,812,623 14.8% Black alone 1,035,926 5.5% Asian alone 366,116 1.9% Two or more races 75,499 0.4% Other race alone 52,499 0.3% American Indian alone 5,230 0.03% Native Hawaiian and Other
10,408,933 52.9% White alone 3,867,299 19.7% Hispanic 2,633,840 13.4% Black alone 1,776,286 9.0% Asian alone 732,670 3.7% Two or more races 216,110 1.1% Other race alone 35,082 0.2% American Indian alone 6,931 0.04% Native Hawaiian and Other
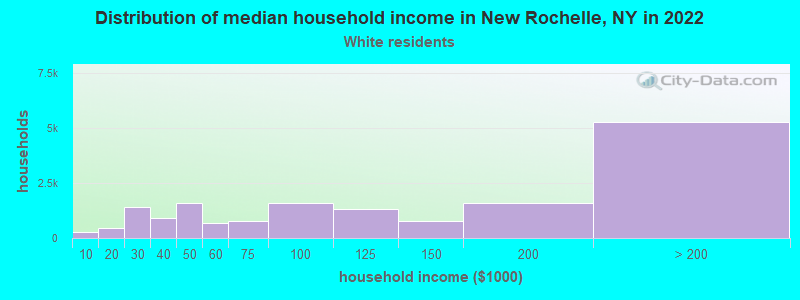
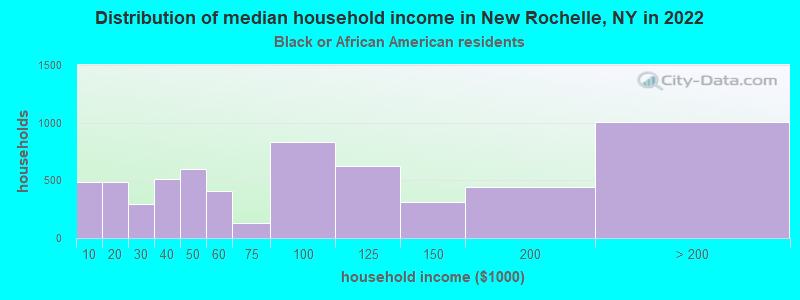
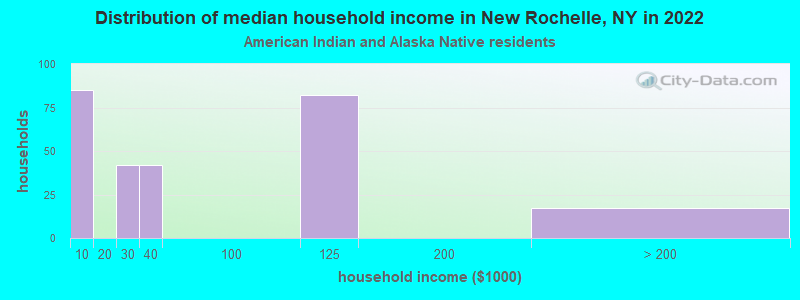
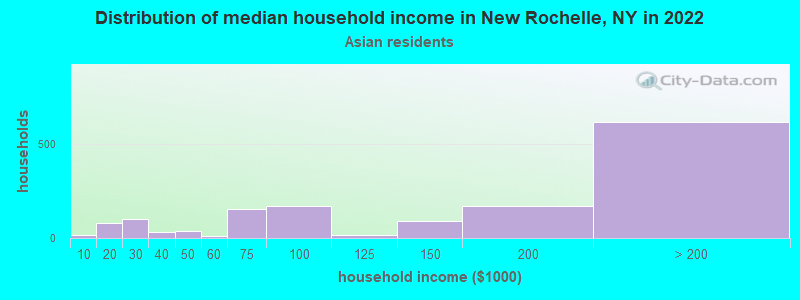
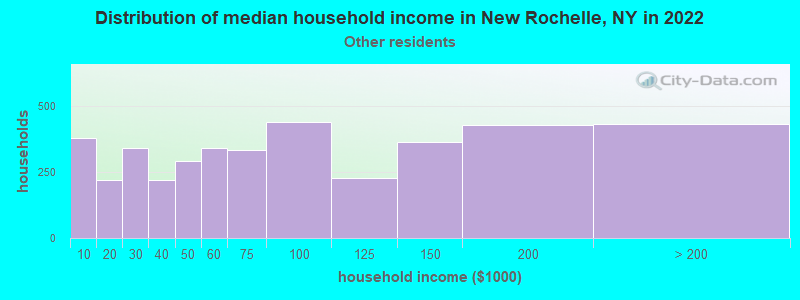
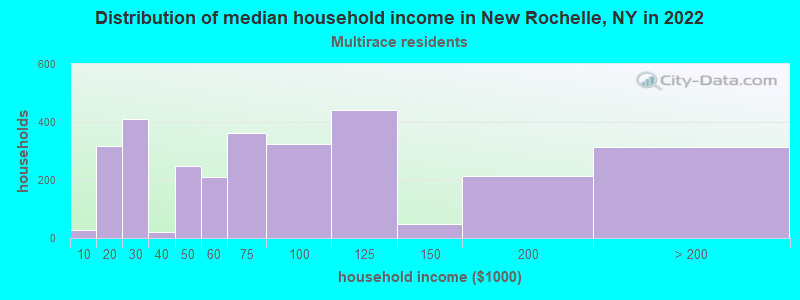
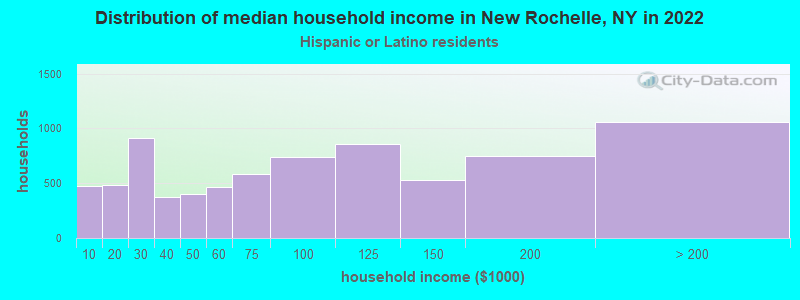
Income and house value in New Rochelle Median household income in 2022 $105,886 White non-Hispanic householders$106,250 Black householders$132,833 Asian householders$52,125 Some other race householders$99,375 Two or more races householders$91,569 Hispanic or Latino race householdersMedian 2022 house value $861,762 White Non-Hispanic householders$668,243 Black or African American householders$371,717 American Indian or Alaska Native householders $780,206 Asian householdersover $1,000,000 Native Hawaiian and other Pacific Islander householders$540,958 Some other race householders$729,056 Two or more races householders$621,336 Hispanic or Latino householders
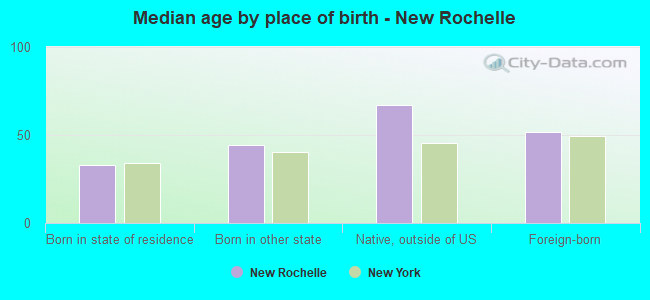
Median age by race in New Rochelle
45.1 Median age for White residents44.0 46.4 41.8 Median age for Black or African American residents38.4 44.2 30.3 Median age for American Indian / Alaska Native residents31.2 27.7 43.9 Median age for Asian residents40.8 51.0 -666,666,666.0 Median age for Native Hawaiian / Pacific Islander residents-666,666,666.0 -666,666,666.0 31.5 Median age for Other race residents31.4 31.7 39.5 Median age for Two or more races residents41.8 37.0 46.4 Median age for White alone residents45.0 47.2 32.6 Median age for Hispanic or Latino residents32.0 37.5
Owner/renter occupied households by race in New Rochelle
House owners and renters - White residents 11,054 66.7% Owner occupied5,519 33.3% Renter occupiedHouse owners and renters - Black or African American residents 2,124 28.7% Owner occupied5,269 71.3% Renter occupiedHouse owners and renters - American Indian / Alaska Native residents 88 26.4% Owner occupied246 73.6% Renter occupiedHouse owners and renters - Asian residents 706 55.9% Owner occupied556 44.1% Renter occupiedHouse owners and renters - Other race residents 878 33.3% Owner occupied1,759 66.7% Renter occupiedHouse owners and renters - Two or more races residents 1,050 26.6% Owner occupied2,893 73.4% Renter occupiedHouse owners and renters - White alone residents 10,707 69.1% Owner occupied4,780 30.9% Renter occupiedHouse owners and renters - Hispanic or Latino residents 1,913 26.0% Owner occupied5,435 74.0% Renter occupied
Language usage in New Rochelle
English speakers - Total 69.0% of residents of New Rochelle speak English at home.
21.1% of residents speak Spanish at home 11,544 69.3% Speak English very well5,108 30.7% Speak English less than very well9.8% of residents speak other language at home 5,710 73.7% Speak English very well2,035 26.3% Speak English less than very well
English speakers - Born in the United States 91.8% of residents of New Rochelle speak English at home.
2.5% of residents speak Spanish at home 186 78.8% Speak English very well50 21.2% Speak English less than very well5.8% of residents speak other language at home 532 96.7% Speak English very well18 3.3% Speak English less than very well
English speakers - Native, born elsewhere 65.3% of residents of New Rochelle speak English at home.
29.5% of residents speak Spanish at home 382 77.6% Speak English very well110 22.4% Speak English less than very well5.2% of residents speak other language at home 75 86.2% Speak English very well12 13.8% Speak English less than very well
English speakers - Foreign-born 33.0% of residents of New Rochelle speak English at home.
36.3% of residents speak Spanish at home 2,855 44.7% Speak English very well3,527 55.3% Speak English less than very well30.7% of residents speak other language at home 3,581 66.5% Speak English very well1,808 33.5% Speak English less than very well
White (Caucasian) - Speak only English Native:
90.0% (31,338)Foreign-born:
42.5% (1,826)
White (Caucasian) - Speak another language Native:
10.0% (3,488)Foreign-born:
57.5% (2,469)
Black or African American - Speak only English Native:
92.9% (12,643)Foreign-born:
67.2% (2,466)
Black or African American - Speak another language Native:
7.1% (967)Foreign-born:
32.8% (1,206)
American Indian / Alaska Native - Speak only English Native:
24.4% (76)Foreign-born:
1.8% (6)
American Indian / Alaska Native - Speak another language Native:
83.5% (260)Foreign-born:
98.0% (357)
Asian - Speak only English Native:
74.8% (536)Foreign-born:
31.8% (548)
Asian - Speak another language Native:
25.2% (181)Foreign-born:
68.2% (1,176)
Other race - Speak only English Native:
19.1% (994)Foreign-born:
12.5% (505)
Other race - Speak another language Native:
80.9% (4,199)Foreign-born:
87.5% (3,524)
Two or more races - Speak only English Native:
46.9% (2,959)Foreign-born:
12.2% (454)
Two or more races - Speak another language Native:
53.1% (3,352)Foreign-born:
87.8% (3,264)
White alone - Speak only English Native:
95.3% (30,533)Foreign-born:
44.2% (1,826)
White alone - Speak another language Native:
4.7% (1,520)Foreign-born:
55.8% (2,303)
Hispanic or Latino - Speak only English Native:
23.9% (3,041)Foreign-born:
10.1% (748)
Hispanic or Latino - Speak another language Native:
76.1% (9,665)Foreign-born:
89.9% (6,623)
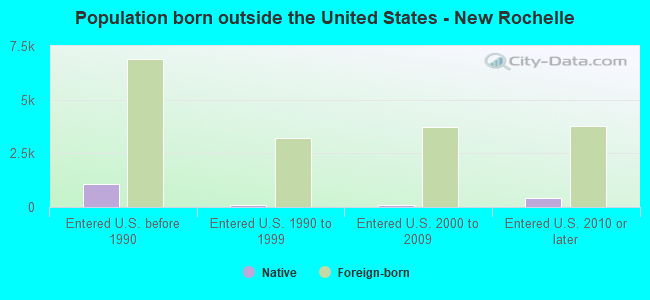
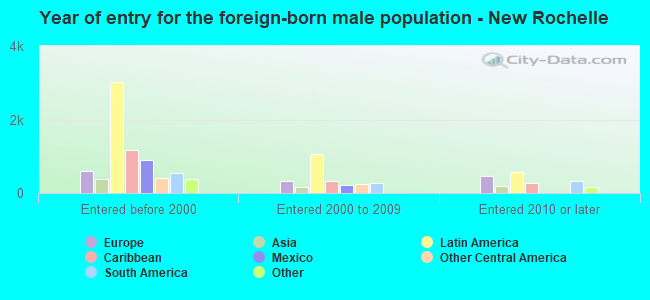
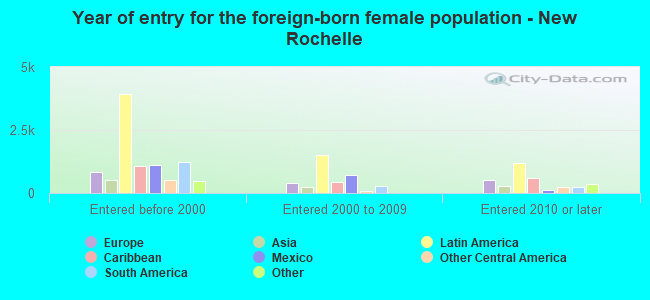
Foreign-born residents in New Rochelle 21,865 residents are foreign born (17.3% Latin America , 4.1% Europe , 3.9% Asia ).
This city:
27.3%New York:
22.6%
Marital status for residents in New Rochelle Marital status - White (Caucasian) population 15 years and over
Males 35.2% Never married51.6% Now married0.1% Separated2.9% Widowed10.2% DivorcedFemales 25.9% Never married49.7% Now married1.8% Separated15.0% Widowed7.5% DivorcedWomen who gave birth in the past 12 months Now married:
100.0% (76)Unmarried:
0.0% (0)
Women who did not give birth in the past 12 months Now married:
48.9% (3,975)Unmarried:
51.1% (4,152)
Marital status - Black or African American population 15 years and over
Males 49.5% Never married45.0% Now married3.3% Separated0.6% Widowed1.6% DivorcedFemales 53.9% Never married20.0% Now married1.5% Separated11.8% Widowed12.8% DivorcedWomen who gave birth in the past 12 months Now married:
17.1% (32)Unmarried:
82.9% (155)
Women who did not give birth in the past 12 months Now married:
27.5% (1,007)Unmarried:
72.5% (2,650)
Marital status - American Indian / Alaska Native population 15 years and over
Males 48.1% Never married51.9% Now married0.0% Separated0.0% Widowed0.0% DivorcedFemales 48.5% Never married34.4% Now married0.0% Separated0.0% Widowed17.0% DivorcedWomen who gave birth in the past 12 months Now married:
100.0% (23)Unmarried:
0.0% (0)
Women who did not give birth in the past 12 months Now married:
36.6% (64)Unmarried:
63.4% (112)
Marital status - Asian population 15 years and over
Males 19.1% Never married78.4% Now married0.0% Separated0.0% Widowed2.4% DivorcedFemales 24.8% Never married58.7% Now married7.2% Separated5.2% Widowed4.1% DivorcedWomen who gave birth in the past 12 months Now married:
100.0% (67)Unmarried:
0.0% (0)
Women who did not give birth in the past 12 months Now married:
59.5% (849)Unmarried:
40.5% (579)
Marital status - Other race population 15 years and over
Males 41.8% Never married39.6% Now married0.0% Separated2.5% Widowed16.1% DivorcedFemales 50.3% Never married28.9% Now married2.9% Separated3.0% Widowed14.9% DivorcedWomen who gave birth in the past 12 months Now married:
36.5% (82)Unmarried:
63.5% (142)
Women who did not give birth in the past 12 months Now married:
39.3% (1,368)Unmarried:
60.7% (2,110)
Marital status - Two or more races population 15 years and over
Males 38.8% Never married49.5% Now married1.9% Separated0.0% Widowed9.8% DivorcedFemales 38.9% Never married44.1% Now married2.7% Separated3.1% Widowed11.2% DivorcedWomen who gave birth in the past 12 months Now married:
100.0% (118)Unmarried:
0.0% (0)
Women who did not give birth in the past 12 months Now married:
44.7% (1,177)Unmarried:
55.3% (1,459)
Marital status - White alone, not Hispanic / Latino population 15 years and over
Males 34.4% Never married51.9% Now married0.1% Separated3.2% Widowed10.4% DivorcedFemales 26.3% Never married49.1% Now married2.0% Separated16.2% Widowed6.4% DivorcedWomen who gave birth in the past 12 months Now married:
100.0% (76)Unmarried:
0.0% (0)
Women who did not give birth in the past 12 months Now married:
47.8% (3,318)Unmarried:
52.2% (3,626)
Marital status - Hispanic or Latino population 15 years and over
Males 43.8% Never married44.2% Now married0.0% Separated1.0% Widowed10.9% DivorcedFemales 42.2% Never married39.0% Now married2.8% Separated3.0% Widowed13.0% DivorcedWomen who gave birth in the past 12 months Now married:
57.0% (176)Unmarried:
43.0% (133)
Women who did not give birth in the past 12 months Now married:
43.4% (2,751)Unmarried:
56.6% (3,593)
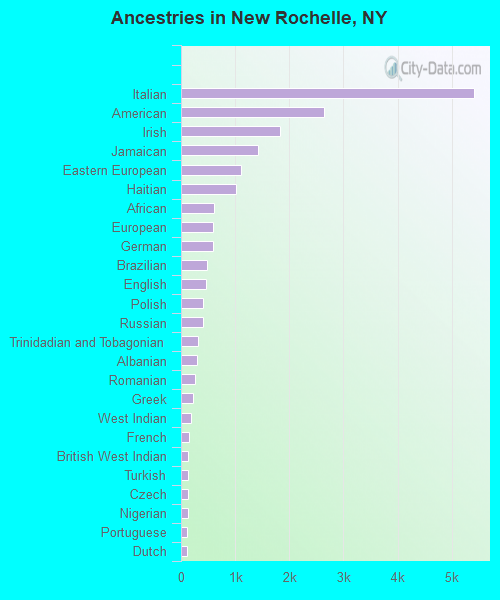
Ancestries in New Rochelle
5,417 11.3% Italian2,635 5.5% American1,833 3.8% Irish1,422 3.0% Jamaican1,110 2.3% Eastern European1,022 2.1% Haitian610 1.3% African597 1.2% European592 1.2% German481 1.0% Brazilian465 1.0% English414 0.9% Polish412 0.9% Russian313 0.7% Trinidadian and Tobagonian296 0.6% Albanian261 0.5% Romanian213 0.4% Greek183 0.4% West Indian140 0.3% French123 0.3% British West Indian123 0.3% Turkish122 0.3% Czech122 0.3% Nigerian114 0.2% Portuguese102 0.2% Dutch88 0.2% Ukrainian76 0.2% Scottish74 0.2% Palestinian72 0.1% Croatian69 0.1% Canadian54 0.1% Guyanese50 0.1% Lebanese48 0.10% Ethiopian47 0.10% Austrian46 0.10% Liberian45 0.09% Norwegian44 0.09% South African44 0.09% Swedish43 0.09% Ghanaian37 0.08% Moroccan35 0.07% Israeli35 0.07% Barbadian28 0.06% Macedonian28 0.06% Serbian27 0.06% Iranian26 0.05% Armenian25 0.05% Lithuanian23 0.05% Slovene20 0.04% British16 0.03% Yugoslavian15 0.03% Welsh9 0.02% Czechoslovakian9 0.02% Swiss8 0.02% Slovak8 0.02% Finnish6 0.01% Northern European5 0.01% Australian4 0.01% Scotch-Irish4 0.01% Belizean3 0.01% Hungarian
Geographical mobility in New Rochelle Same house 1 year ago 37,241 91.7% White (Caucasian)15,626 87.5% Black or African American532 97.4% American Indian / Alaska Native4,184 88.1% Asian11,468 88.2% Other race9,332 90.7% Two or more races35,608 94.5% White alone, not Hispanic / Latino22,120 88.4% Hispanic or LatinoMoved within same county 690 1.7% White / Caucasian1,182 6.6% Black or African American85 1.8% Asian696 5.4% Other race185 1.8% Two or more races564 1.5% White alone, not Hispanic / Latino1,382 5.5% Hispanic or LatinoMoved within same state 1,803 4.4% White / Caucasian633 3.5% Black or African American30 5.4% American Indian / Alaska Native177 3.7% Asian509 3.9% Other race141 1.4% Two or more races623 1.7% White alone, not Hispanic / Latino1,172 4.7% Hispanic or LatinoMoved from different state 274 0.7% White / Caucasian184 1.0% Black or African American161 3.4% Asian24 0.2% Other race221 2.2% Two or more races274 0.7% White alone, not Hispanic / Latino124 0.5% Hispanic or LatinoMoved from abroad 617 1.5% White234 1.3% Black or African American62 1.3% Asian27 0.2% Other race96 0.9% Two or more races617 1.6% White alone, not Hispanic / Latino126 0.5% Hispanic or Latino
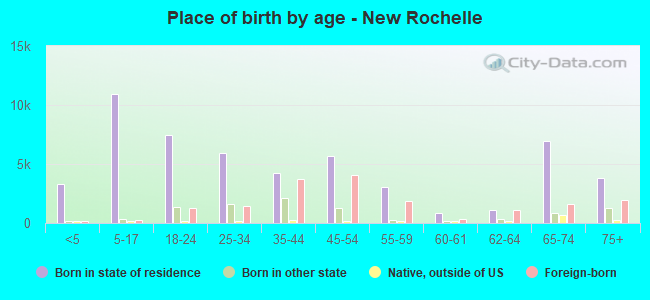
Children Nativity (place of birth) in New Rochelle
Children under 6 years - Living with two parents Both parents native 1,076 99.9% Native1 0.1% Foreign-bornBoth parents foreign-born 1,392 96.4% Native51 3.6% Foreign-bornOne native, one foreign-born parent 647 100.0% NativeChildren under 6 years - Living with one parent Native parent 838 100.0% NativeForeign-born parent 367 97.3% Native10 2.7% Foreign-bornChildren 6 to 17 years - Living with two parents Both parents native 4,010 100.0% NativeBoth parents foreign-born 2,085 88.6% Native268 11.4% Foreign-bornOne native, one foreign-born parent 1,919 99.2% Native15 0.8% Foreign-bornChildren 6 to 17 years - Living with one parent Native parent 1,545 100.0% NativeForeign-born parent 1,098 59.6% Native745 40.4% Foreign-born
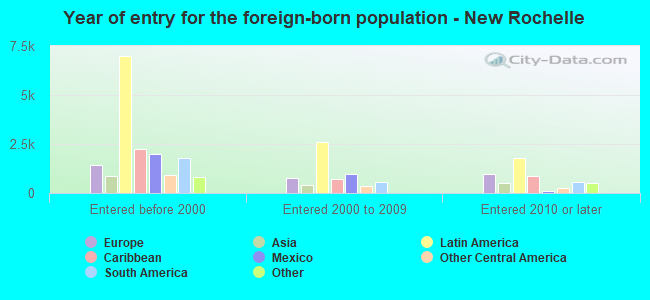
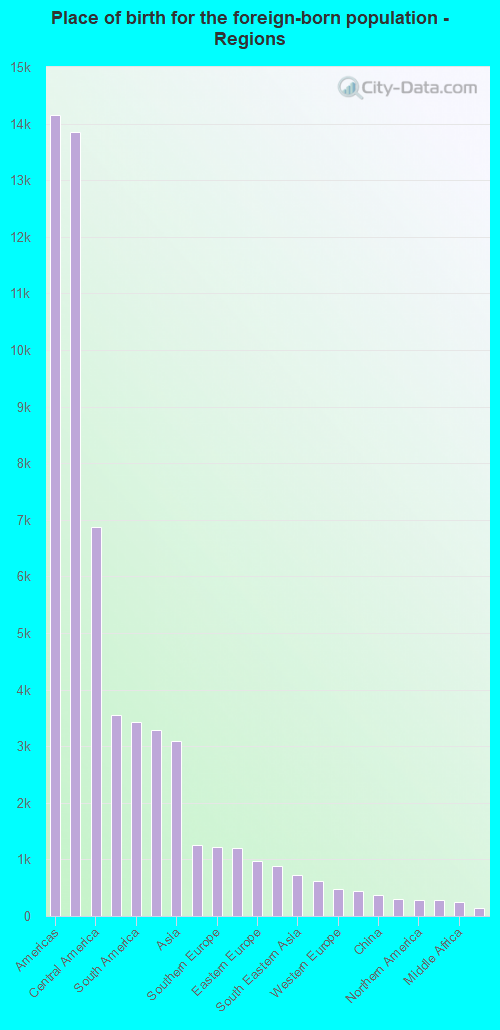
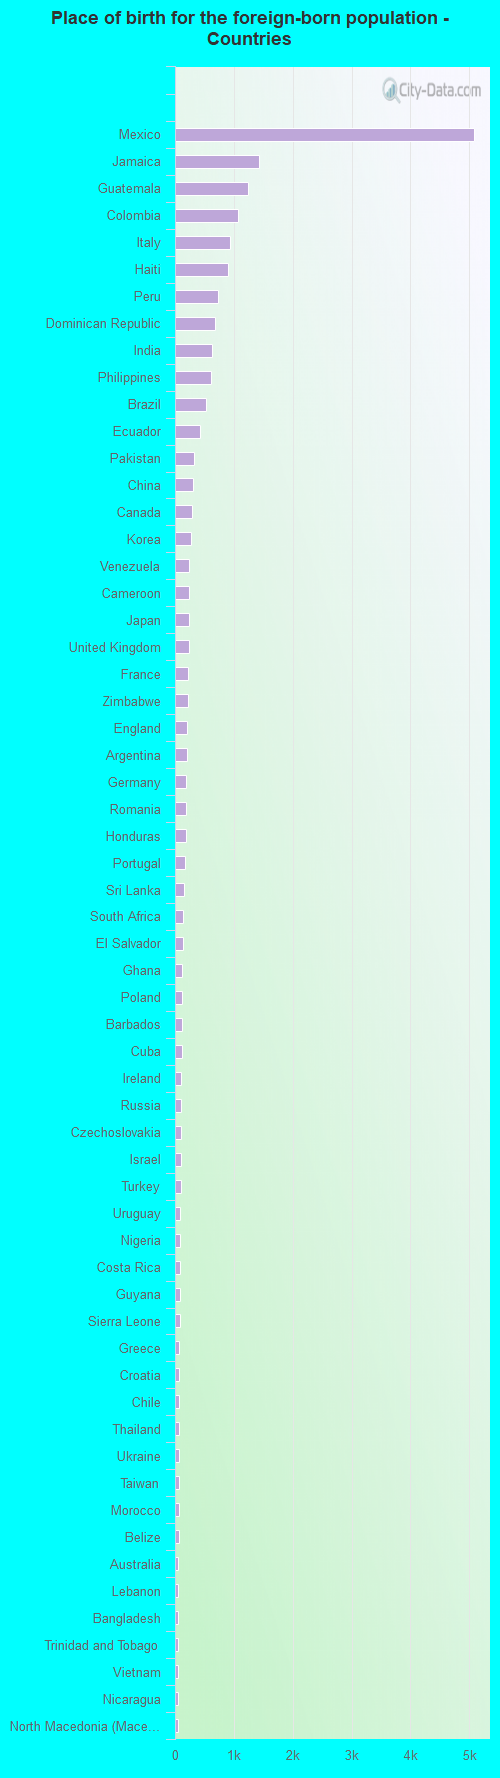
Place of birth for residents in New Rochelle 14,145 Americas13,854 Latin America6,877 Central America3,549 Caribbean3,427 South America3,289 Europe3,099 Asia1,257 Africa1,215 Southern Europe1,208 South Central Asia972 Eastern Europe876 Eastern Asia730 South Eastern Asia618 Northern Europe483 Western Europe440 Western Africa372 China306 Eastern Africa290 Northern America281 Western Asia241 Middle Africa140 Southern Africa74 Northern Africa73 Oceania73 Australia and New Zealand Subregion5,080 Mexico1,429 Jamaica1,244 Guatemala1,068 Colombia939 Italy904 Haiti732 Peru678 Dominican Republic626 India610 Philippines520 Brazil419 Ecuador326 Pakistan307 China290 Canada267 Korea242 Venezuela241 Cameroon236 Japan233 United Kingdom224 France218 Zimbabwe201 England198 Argentina190 Germany186 Romania186 Honduras170 Portugal153 Sri Lanka140 South Africa128 El Salvador126 Ghana126 Poland121 Barbados114 Cuba107 Ireland106 Russia102 Czechoslovakia99 Israel96 Turkey92 Uruguay91 Nigeria82 Costa Rica78 Guyana77 Sierra Leone76 Greece76 Croatia74 Chile71 Thailand69 Ukraine65 Taiwan60 Morocco60 Belize59 Australia54 Lebanon54 Bangladesh50 Trinidad and Tobago49 Vietnam48 Nicaragua47 North Macedonia (Macedonia)46 Panama45 Ethiopia43 Albania33 Grenada33 Switzerland30 Syria30 Iran29 Sweden29 West Indies29 Spain26 Dominica24 Serbia23 Denmark19 Austria17 Scotland17 Uzbekistan17 Togo14 Belgium13 New Zealand11 Liberia9 Senegal8 Belarus3 Norway2 Eritrea
Grandparents responsible for own grandchildren in New Rochelle
Grandparents (30 to 59 years) White / Caucasian 84 100.0% Not responsible for grandchildrenBlack or African American 71 56.8% Responsible for grandchildren54 43.2% Not responsible for grandchildrenAsian 9 100.0% Not responsible for grandchildrenOther race 95 100.0% Not responsible for grandchildrenWhite alone, not Hispanic / Latino 82 100.0% Not responsible for grandchildrenHispanic or Latino 122 100.0% Not responsible for grandchildrenGrandparents (60 years and over) White / Caucasian 62 29.0% Responsible for grandchildren153 71.0% Not responsible for grandchildrenBlack or African American 57 21.6% Responsible for grandchildren206 78.4% Not responsible for grandchildrenAsian 151 100.0% Not responsible for grandchildrenOther race 143 100.0% Not responsible for grandchildrenWhite alone, not Hispanic / Latino 52 24.6% Responsible for grandchildren159 75.4% Not responsible for grandchildrenHispanic or Latino 15 5.2% Responsible for grandchildren268 94.8% Not responsible for grandchildren